Science and Mathematics
Education
David Azcona M.Sc.
Supervised by Prof. Alan F. Smeaton
Supervised by Prof. Sharon Hsiao (Arizona State University)
A thesis presented for the degree of Doctor of Philosophy (Ph.D.)
School of Computing
Dublin City University
programme of study leading to the award of Doctor of Philosophy is entirely my own work, that I have exercised reasonable care to ensure that the work is original, and does not to the best of my knowledge breach any law of copyright, and has not been taken from the work of others save and to the extent that such work has been cited and acknowledged within the text of my work.
David Azcona
David Azcona ID No.: 15212605 August 2019
I would like to thank my tireless supervisor Prof. Alan F. Smeaton for his continu-ous support, patience, knowledge and encouragement over the last four years.
I would also like to thank my wonderful hosts at Arizona State University John Rome and Prof. I-Han Sharon Hsiao for believing in my potential and guiding me throughout the year where I conducted research as a Fulbright scholar in the United States.
I would also like express my deepest appreciation to my family and my girlfriend Maria for their daily encouragement. Thanks for being always there for me when I need it the most.
I am also indebted to Dr. Stephen Blott at the School of Computing in Dublin City University and the Action Lab at EdPlus in Arizona State University for their support and help.
Finally, I would like to acknowledge support from the following funding sources:
• Irish Research Council in partnership with The National Forum for the
En-hancement of Teaching & Learning in Ireland under project number GOIPG/2015/3497
• Fulbright Ireland
• Science Foundation Ireland under grant number 12/RC/2289 (Insight Centre for Data Analytics)
• Dublin City University’s School of Computing and Faculty of Engineering & Computing
• Arizona State University’s University Technology Office and School of Com-puting, Informatics & Decision Systems Engineering
Acknowledgements i
List of Figures vii
List of Tables x
Abstract xiv
1 Introduction 1
1.1 Introduction to Predictive Modelling . . . 3
1.2 Introduction to Representational Learning and Embeddings . . . 6
1.3 Introduction to Adaptive Feedback . . . 9
1.4 Introduction to Graph Theory and Networks . . . 10
1.5 Thesis Structure. . . 11
2 Literature Review 12 2.1 Introduction . . . 12
2.2 Machine Learning and Predictive Modelling . . . 12
2.2.1 Traditional Machine Learning in Practice . . . 15
2.3 Deep Learning and Embeddings . . . 18
2.4 Adaptive Feedback in Learning . . . 24
2.5 Graph Theory and Networks . . . 25
3 Students’ Digital Footprints and the Data Used in the Thesis 27 3.1 Dublin City University . . . 29
3.1.1 School of Computing . . . 29
3.1.2 Data from across the Whole University . . . 32
3.2 Arizona State University . . . 33
3.2.1 School of Computing, Informatics, and Decision Systems Engineering . . . 33
3.2.2 Global Freshman Academy and ALEKS via EdX . . . 34
3.3 Feature Importances . . . 36
4 Modelling Students’ Online Behaviour 38 4.1 Introduction . . . 38
4.2 Context and Dublin City University Courses . . . 38
4.3 Exploratory Data Analysis (EDA) . . . 41
4.4 Data Processing and Feature Engineering . . . 43
4.5 Feature Exploration and Correlations . . . 46
4.6 Splitting Data between Training, Validation and Testing . . . 49
4.7 Model Selection . . . 50
4.7.1 Empirical Risk . . . 50
4.7.2 Hyperparameter Optimization . . . 53
4.8 Predicting which incoming students are “at-risk” . . . 54
4.9 Re-visiting RQ1: Accuracy of Predictive Modelling . . . 55
4.10 Extra: Retrospective Analysis on Reviewing Behaviours at ASU . . . 59
4.10.1 Data Processing . . . 60
4.10.2 Features . . . 60
4.10.3 Classification and Regression Modelling . . . 62
4.10.4 Conclusions . . . 68
4.11 Extra: Retrospective Analysis on All First-years at DCU . . . 68
4.11.1 Exploratory Data Analysis . . . 68
4.11.2 Data Summarisation . . . 69
4.11.3 Feature Engineering . . . 70
4.11.5 Ablation Study & Mutual Information . . . 72
4.11.6 Conclusion. . . 74
5 Modelling Students With Embeddings 77 5.1 Introduction . . . 77
5.2 Context and Dublin City University Courses . . . 78
5.3 Research Method: Code Vectorisation . . . 79
5.3.1 Program Code as Word Vectors . . . 81
5.3.2 Program Code as Token Vectors . . . 82
5.3.3 Program Code as Abstract Syntax Tree Vectors . . . 84
5.4 Experiment: code2vec . . . 86
5.4.1 Code BOW (bag-of-words) . . . 87
5.4.2 Code Embeddings . . . 88
5.5 Experiment: user2code2vec. . . 89
5.6 RQ2 Results: code2vec . . . 90
5.6.1 Code BOW (bag-of-words) . . . 90
5.6.2 Code Embeddings . . . 92
5.7 RQ3 Results: user2code2vec . . . 96
6 Adaptive Feedback to Students 99 6.1 Introduction . . . 99
6.2 Learning Context . . . 100
6.3 Research Methodology . . . 101
6.3.1 Feedback to Students . . . 101
6.3.2 Feedback to Lecturers . . . 103
6.3.3 Measuring Students’ Level of Engagement . . . 104
6.4 RQ4: Quantitative Effects of Adaptive Feedback . . . 105
6.4.1 Academic year: 2015/2016 . . . 106
6.4.2 Academic year: 2016/2017 . . . 107
6.4.4 Comparison with the baseline . . . 114
6.5 RQ5: Qualitative Feedback. . . 115
6.5.1 Students have their say . . . 115
6.5.2 Lecturers have their say . . . 118
6.6 Extra: Virtual Coding Assistant . . . 120
7 Using Graph Theory and Networks to Model Students 122 7.1 Introduction . . . 122
7.2 The Global Freshmen Academy at Arizona State University . . . 123
7.3 Exploratory Data Analysis . . . 126
7.4 RQ6: Insights from MOOCs and Sequences of Learning States . . . . 129
7.5 Conclusion on RQ6 . . . 137
8 Conclusions 139 8.1 Introduction . . . 139
8.2 Modelling Student Behaviour . . . 139
8.3 Modelling Students With Embeddings . . . 140
8.4 Providing Adaptive Feedback to Students. . . 142
8.5 Using Graph Theory and Networks to Model Students . . . 144
8.6 Final thoughts. . . 146
Appendices 147
A Publications on Work from this Thesis 148
B Organisational Activities 151
C Presentations on Work from this Thesis 152
D Awards 155
1.1 Higher Education Authority’s Report on Overall Completion Rates by ISCED broad field of study . . . 2
1.2 Blended Classrooms Combine Traditional Classrooms with Online Learning . . . 3
2.1 Venn diagram showing how deep learning is a kind of representation learning, which is in turn a kind of machine learning, which is used for many but not all approaches to AI. Image taken from [43]. . . 19
2.2 Flowcharts showing how the different parts of an AI system relate to each other within different AI disciplines. Shaded boxes indicate components that are able to learn from data. Image taken from [43].. 20
3.1 Screengrab from the Virtual Learning Environment for the Teaching of Computer Programming at Dublin City University . . . 31
3.2 Instant Feedback Provided to the Student After Submitting a Pro-gram to the Automated Grading Assistant . . . 32
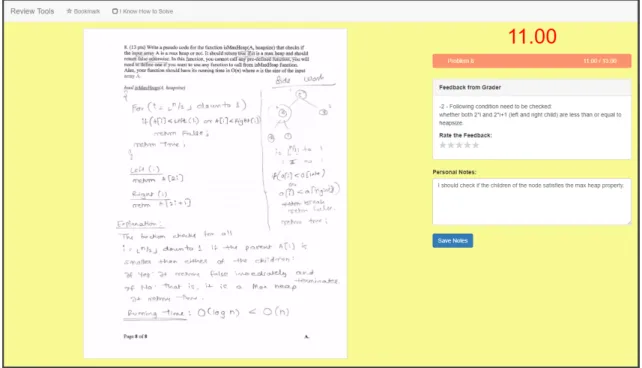
3.3 Web Programming Grading Assistant Platform When a Student Re-views Her Graded Response to an Exercise . . . 35
4.1 University Entry Points Correlated with First-Year Precision Mark for Computing Students at Dublin City University from 2013 - 2014 Academic Year to 2016 - 2017 Academic Year . . . 42
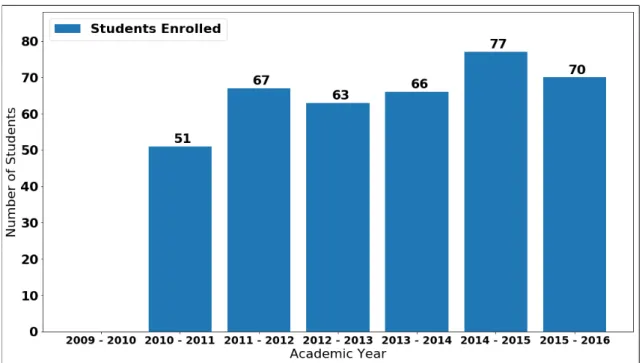
4.2 Number of Students Enrolled in CA114 over from 2009 - 2010 Aca-demic Year to 2015 - 2016 AcaAca-demic Year . . . 43
4.3 CA114’s Numbers per Examination over from 2009 - 2010 Academic Year to 2015 - 2016 Academic Year . . . 43
4.4 CA114’s Failure Rates Per Examination from 2009 - 2010 Academic Year to 2015 - 2016 Academic Year . . . 44
4.5 Correlations for CA116 2016/2017’s Features in Week 12 . . . 47
4.6 Correlations for CA116 2016/2017’s Features Every Week . . . 48
4.7 Empirical Risk for CA116 for the Training Data using Accuracy . . . 51
4.8 Empirical Risk for CA116 for the Training Data using F1-Score . . . 52
4.9 Empirical Risk for CA116 for the Training Data using F1-Score for the Fail Class Only . . . 52
4.10 CA116’s Validation Data’s Accuracy after Hyperparameter Tuning . . 54
4.11 Snapshot of Anonymised Predictions for a Sample of 3 Students . . . 55
4.12 Evaluation using F1 for CA116’s Incoming 2018/2019 Cohort Shown Weekly . . . 57
4.13 Confusion Matrix for Week 4 for CA116’s Incoming 2018/2019 Cohort 57
4.14 Confusion Matrix for Week 8 for CA116’s Incoming 2018/2019 Cohort 58
4.15 Confusion Matrix for Week 12 for CA116’s Incoming 2018/2019 Cohort 58
4.16 Distribution of Students’ Academic Performance for Computing Stu-dents in a Data Structures and Algorithms Course at Arizona State University . . . 61
4.17 Feature Importance Across Periods for ASU’s Data Structures Course 65
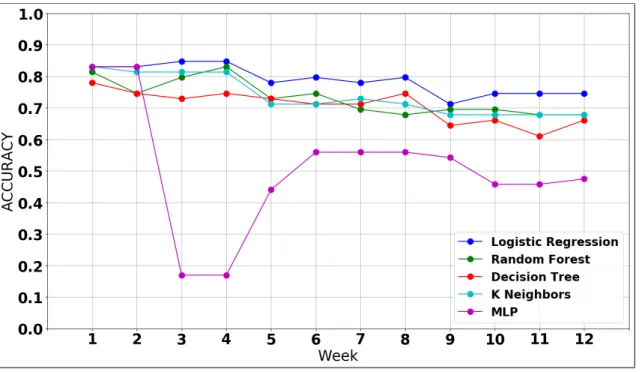
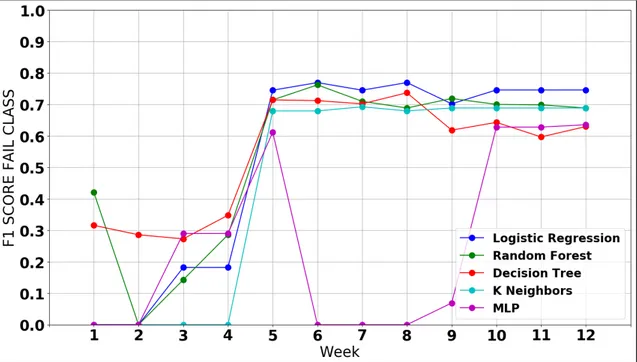
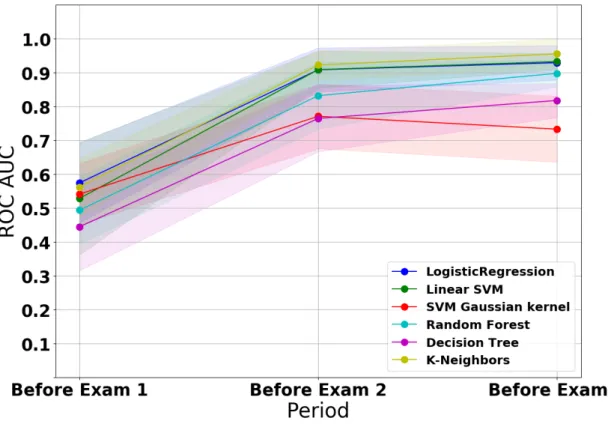
4.18 Classification Performance using ROC AUC for ASU’s Data Struc-tures Course . . . 65
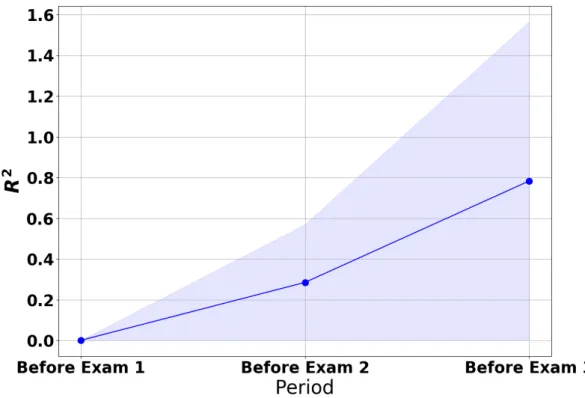
4.19 Linear Regression Performance using R2 for ASU’s Data Structures
Course . . . 66
4.20 Linear Regression Predictions vs. Actual Results Before the Third Exam for ASU’s Data Structures Course . . . 67
4.22 Scatter Plot between CAO Points and the Precision Mark, color coded
by Faculty . . . 70
4.23 Scatter Plots between CAO Points and the Precision Mark by Faculty 71 4.24 Examples of Mutual Information between Two Variables. Image taken from [2].. . . 73
4.25 Mutual Information Score between a Feature and the Precision Mark, for Several Features . . . 75
5.1 Abstract Syntax Tree (AST) for Hello World Example . . . 84
5.2 AST for Call a Function Example . . . 85
5.3 AST for Sum of Two Variables Example . . . 85
5.4 Performance of code2vec using BOW (bag-of-words). . . 93
5.5 Performance of code2vec using Embeddings . . . 94
5.6 Embeddings for the Top Words & Token Words. These Embeddings Are Projected from 100 Dimensions to 2 Dimensions for Visualization Using Principal Component Analysis (PCA). Axis in the Graphs Are the PCA’s Two Principal Components. . . 95
5.7 user2code2vec applied to CA116 course during 2016/2017 academic year. These Representations Are Projected from 100 Dimensions to 2 Dimensions for Visualization Using Principal Component Analysis (PCA). Axis in the Graphs Are the PCA’s Two Principal Components. 98 6.1 Students Struggling with Programming Concepts May Have Different Learning Issues . . . 100
6.2 An Anonymised Customised Email Notification Sent to a Student in CA117 during the 2017/2018 Course. . . 103
6.3 Frequency of Access to Material and Labsheets from the Notifications 112 7.1 Number of Students that Took each Type of Assessment for MAT117 and MAT170 in ASU’s GFA via EdX . . . 126
7.2 Number of Students Binned Based on their Completion Percentage of Each of the Courses . . . 127
7.3 Total Duration for each Topic Using All Students’ Data, Ordered, Split and Colour Coded for each Learning State . . . 127
7.4 Number and Percentage of Students Who Worked on Each Section for Both Courses . . . 128
7.5 Screengrab from the Web Application which shows the First Trans-actions for a Particular Student . . . 129
7.6 Screengrab from the Web Application which shows the Distribution of Learning States Grouped By Date for a Particular Student . . . . 130
7.7 Screengrab from the Web Application which shows Network Visuali-sations for the First Three Topics for a Particular Student . . . 130
7.8 Visualizations of Networks for Two Students Going Through Various Learning States on Two Different Topics . . . 131
7.9 Network Degree Metrics Extracted from Two Topic Networks and the Values for Each Learning State. Metrics for One Topic Network are shown in Blue and for the Other Topic Network in Red. . . 133
7.10 Custom Network Metrics Extracted from the Section Networks Di-vided by In-coming and Out-going Metrics . . . 135
7.11 Number of Concepts per Section for MAT117 and MAT170 in ASU’s GFA via EdX . . . 136
7.12 Diagram of Modelling How Students Learn on MOOC Platforms us-ing Learnus-ing States and Hidden Markov Models . . . 136
3.1 Summary of the Data Used in the Thesis . . . 28
3.2 Courses in DCU’s School of Computing used in this thesis . . . 31
3.3 Some Math Courses at ASU’s GFA in EdX . . . 35
4.1 List of Feature Names and associated Short Names . . . 46
4.2 CA116 Split between Training, Validation & Test sets . . . 49
4.3 CA116 Prediction Metrics including passing rates and at-risk rates . . 56
4.4 Feature correlations with the cumulative exam average . . . 62
4.5 Number Features per period and Students below the Threshold . . . 63
4.6 Linear SVM Classification Performance throughout the periods for ASU’s Data Structures Course . . . 66
4.7 Linear Regression Performance throughout the periods for ASU’s Data Structures Course . . . 67
5.1 Count Occurrence Matrix for Listings 5.1 and 5.2 . . . 88
5.2 Top-5 Words & Token Categories in terms of Number of Occurrences 91 5.3 Top-5 Token Words & AST Nodes in terms of Number of Occurrences 91 5.4 Performance of the Models Using BOW and Embeddings . . . 94
5.5 Cosine Distance Between Word Vectors . . . 96
5.6 Courses Analysed on user2code2vec . . . 97
6.1 Demographics and prior information for students in 2015/2016 in courses CA117 and CA114 . . . 107
6.2 Difference and Normalised Gain Index between the examinations for CA117 and CA114 in the 2015/2016 academic year . . . 108
6.3 Demographic information and prior information from the 2016/2017 student groups in CA117, CA114 and CA278 . . . 110
6.4 Difference and Normalised Gain Index among the examinations for CA117, CA114 and CA278 in the 2016/2017 academic year . . . 111
6.5 Difference and Normalised Gain Index between the examinations for CA117, CA114 and CA278 on 2017/2018 academic year . . . 113
6.6 Comparision between 2015/2016, 2016/2017 and 2018/2019 academic years . . . 114
6.7 2016/2017 Student survey responses from students about the project 116
Artificial Intelligence in Computer Science and
Mathematics Education
David Azcona
In this thesis I examine how Artificial Intelligence (AI) techniques can help Com-puter Science students learn programming and mathematics skills more efficiently using algorithms and concepts such as Predictive Modelling, Machine Learning, Deep Learning, Representational Learning, Recommender Systems and Graph The-ory.
For that, I use Learning Analytics (LA) and Educational Data Mining (EDM)principles. In Learning Analytics one collects and analyses data about stu-dents and their contexts for purposes of understanding and improving their learning and the environments students interact with. Educational Data Mining applies Data Mining, Machine Learning and statistics to data captured during these learning pro-cesses.
My centralresearch questionis how we can optimise the learning by students, of subjects like computer programming and mathematics in blended and online classrooms by mining and analysing data generated in these environments by the students. To validate the research question I have implemented several examples of monitoring student behaviour while learning, I have gathered various forms of stu-dent interaction data and combined it with demographics and stustu-dent performance data (e.g. exam results) in order to test out different predictive models developed us-ing a variety of AI and machine learnus-ing techniques. In these example environments
I have used these models not only to predict outcome and exam performance but also to automatically generate feedback to students in a variety of ways, including recommending better programming techniques. My research question is explored by examining the performance of the AI techniques in helping to improve student learning.
Introduction
According to the 1stInternational Conference on Learning Analytics and Knowledge, which is an event where the topic really took off, became prominent and started becoming popular, Learning Analytics is the measurement, collection, analysis and reporting of data about learners and their contexts, for purposes of understanding and optimising learning and the environments in which it occurs. Higher education institutions across the world have been generating an enormous amount of raw data about students but they have traditionally been very inefficient in their use of this data and in putting it to good purpose [96]. With the data explosion in many fields such as Healthcare, Transportation and Business along with new methodologies now available and emerging to analyse and understand datasets, higher education institutions should become smarter organisations and should be moving towards using a data-first approach in their decision-making.
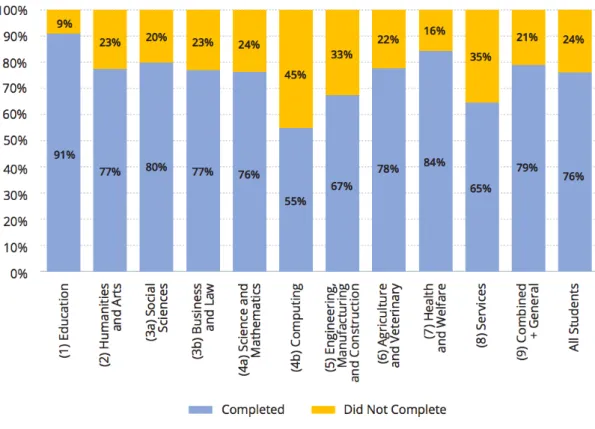
In addition to improving productivity, outputs and their own processes in ed-ucational institutions, there are strong employment opportunities for graduates in the Information and Communications Technology (ICT) sector with higher rates of employment and higher average salaries than most other graduates. In Ireland, according to the Higher Education Authority’s 2019 report [85], computing courses have the highest level of student drop out, with close to half of all students in this area failing to complete their programme, across all third level institutions. Com-puter Science (CS) presents the lowest rate of completion at 55%, see Figure 1.1,
Figure 1.1: Higher Education Authority’s Report on Overall Completion Rates by ISCED broad field of study
using the degree classification by the International Standard Classification of Edu-cation (ISCED). This comprehensive study tracked students who entered the third level system in 2007. A previous report showed the same trend [70].
A large contributor to these low progression rates in computing degrees is the fact that students quite often struggle on their first introductory programming course [102, 82]. The mean worldwide pass rate for introductory programming has been estimated at 67% [15], a figure revisited in 2014 [102].
Learning to program a computer is challenging for most people and few students find it easy at first. Moreover, first-year students often struggle with making the transition into University as they adapt to what is likely to be a very different form of independent study and learning. For instance, Dublin City University provides comprehensive orientation programmes and information for first-year students in order to ease this transition between second- and third-level education, as well as student support and career guidance for students at risk of stopping out (leave and
return) or dropping out (leave permanently) at any stage.
In this section of this introductory chapter, we will introduce the areas we will be discussing throughout this thesis, our motivation to work on them and the research questions we derived for each, which are used to frame the experiments carried out and reported later.
1.1
Introduction to Predictive Modelling
There are many different types of data which are gathered about our University stu-dents, ranging from static demographics to dynamic behaviour logs. These can be harnessed from a variety of data sources at Higher Education Institutions. Combin-ing these into one location assembles a rich student digital footprint, which can enable institutions to better understand student behaviour and to better prepare for guiding students towards reaching their academic potential.
Figure 1.2: Blended Classrooms Combine Traditional Classrooms with Online Learning
In a recent literature review on learning computer programming, ten years of survey results highlighted that today’s CS (Computer Sciences) classes still miss out on the use of diverse forms of Learning Analytics ([51]) to improve student
per-formance in the learning task, in some way. Automated collection of data on com-puter programming activities, the online activities that students carry out during their learning process, is typically used in isolation within designated programming learning environments such as WebCAT ([38]). Yet combining this automatically collected data with other complementary data sources (i.e. performance in class assignments or demographic information or information on prior learning) means it may have to be retrieved and aggregated from different course or University man-agement systems. As a result, most of the data collection in the reported studies in CS learning is extremely customised and impossible to replicate and reproduce at other institutions.
Today, the majority of computer programming classes are delivered via a blended instructional strategy with face-to-face instruction in classrooms supported by online tools such as intelligent tutors, self-assessment quizzes, online assignment submis-sion, and course management systems. New attempts in today’s classrooms seek to combine multiple modalities of data such as gestures, gaze, speech or writing from video cameras, lecture recordings, etc. to leverage students’ digital footprints [19, 79].
In this thesis, we propose, build and then evaluate a series of traditional Ma-chine Learning Predictive Analytics models using student characteristics, prior academic history, students’ programming laboratory work, and all logged in-teractions between students’ offline and online resources. We generate predictions of end-of-course outcome weekly, during the semester. Furthermore, lecturers on the courses were updated each week regarding their students’ progress.
This theoretical work then contributes to a practical implementation of a Predic-tive Analytics technique that aggregates multiple sources of students’ digital foot-prints from blended classroom settings. This is done in order to validate the under-lying theoretical work. This involves using multimodal data in the sense that it is derived from multiple sources of information about students and in the remainder of the thesis we refer to it as the students’ digital footprint. Advanced Data Mining
techniques are adopted to develop and then create mathematical models to provide realtime prediction of course outcomes as well as personalised dynamic feedback to students on their progress. This approach incorporates static and dynamic student data features to enhance predictive model scalability that can be extrapolated to other blended classrooms and to other subjects as well as to other higher education institutions. Additionally, not only is the approach we develop generic, it also per-mits applicability in the case of only limited data sets being available (e.g. log files for access to online laboratory material only) in order to be beneficial in helping students in need. Most importantly, the generated predictions allow us to auto-matically create and provide adaptive feedback to each student according to each student’s progression and also to provide guidance when in need.
We explore how the proposed Predictive Analytics models which are developed here, work in distinguishing students who may be struggling in computer program-ming courses. We have access to, and we use, two years of groundtruth student data as training data from which we can learn. To demonstrate the theory and address research questions, we implemented multimodal models for each course that aggregates sources of student data including student characteristics, prior academic history, students’ programming laboratory work, and all the logged interactions between students’ offline and online resources. Classification models are built by developing data features and automatically identifying and extracting patterns of success on these courses. These are then then trained and cross-validated to de-termine and then refine their accuracy, and finally predictions are generated every week with incoming student data. This gives us experimental data that we can use to validate our underlying research questions and hypotheses. A report containing whether each student is likely to pass or fail their next formal assessment and the associated confidence with that estimation, is sent to the lecturers for each course.
In summary, the single and most important research question derived in this section can be stated as the following:
RQ1: When working with new cohorts of University students about whom we have little historical interaction data, how accurate are the traditional Predictive Analytics models when used with generic static and dynamic student data features, in identifying those students in need of assistance in computer programming courses?
In the next section we will look at the technique of embeddings and how it can be used in this thesis.
1.2
Introduction to Representational Learning and
Embeddings
Online learning tools and platforms including Massive Open Online Courses (MOOCs) provide a rich mechanism for students to engage and interact with educational ma-terial based on their individual existing knowledge and requirements for their own academic development. Such tools also provide a mechanism to support person-alised learning effectively through the use of customised recommendations. These recommendations should be developed based on users’ understanding, effort and their logged interaction with the learning systems to date by interpreting historical data from previous cohorts of students as well as data from the current students. Interest in, and the use of students’ digital footprints and, particularly, interactions on VLE systems have been rising in the last decade because of their advantage in better supporting individualised learning. However, developing aricher represen-tation for student digital footprints effectively and efficiently is still a challenging problem which has been an area of recent research interest, and is the focus of our work in this thesis.
Machine Learning (ML) is a subset of AI that provides computers with the abil-ity to learn without being explicitly programmed [17]. That is done by combining the study of algorithms with statistical models. ML algorithms build a statistical model based on a collection of existing data with known outcomes such as retail data, bank loan applications or customer data from telecoms companies [57]. Those trained models are then used to predict outcomes for unknown data such as new
customers, new bank loan applications or new telecoms customers. There is a range of algorithms and ML techniques to do this including Support Vector Machines (SVM), Naive Bayes, Decision Trees and the recently popular Deep Learning or Neural Networks. New advances and techniques are being discovered regularly. One common challenge across all ML techniques and across all ML applications, is de-ciding what data to use to represent customers, bank loan applicants or telecoms customers, whatever the application is: which kind of customer data is most impor-tant, which is of little value and which can be discarded. This is sometimes called “data wrangling” and involves manual feature engineering including data cleaning and can take far more time than doing actual data analytics.
Representation Learning is a set of techniques in Machine Learning that allows a system to automatically discover the representations needed for feature detection or classification from raw data. This replaces manual feature engineering and allows a machine to both learn the features and use them to perform a specific task. For instance, learning richer distributed representations of words has shown to be quite effective for Natural Language Processing tasks [67, 13].
One of the main objectives of the work in this thesis in the area of learning analytics is to explore the latent signals or information buried in raw data by building high dimensional and distributional representations of student profiles and their programming codes or the outputs of their programming assignments. We propose a new methodology to profile individual CS students based on their programming design using a technique called embeddings. An embedding is a mapping from discrete objects to real number vectors. Such mappings constitute mapping to a dimension which may not always be meaningful or easily explainable in Machine Learning. However, the patterns of location and distances between vectors derived from embeddings may uncover numerous latent factors among the embeddings. In recent research in Deep Learning and Artificial Intelligence, the value of the amount of data has surpassed the complexity of the models. Thus, we investigate the use of hundreds of thousands of code submissions inputted to a Deep Learning model
using Embeddingsas one of our implementation techniquess.
We will investigate different approaches to analyse student source code submis-sions in the Python language. We will compare the performances of different source code vectorisation techniques to predict the correctness of a code submission. In addition, we propose a new mechanism to represent students based on their code submissions for a given set of laboratory tasks on a particular course. Potentially, we can make deeper recommendations for programming solutions and pathways to sup-port student learning and progression in computer programming modules effectively at a Higher Education Institution.
In further work we will investigate how to effectively represent and compare students’ source code as submitted for assessment as part of their computer pro-gramming courses, on our internal online platform. We will investigate different techniques to represent students’ code (code2vec) and evaluate the performance of different internal representations to predict the correctness of a code solution. Fur-thermore, after investigating different representations of user code (code2vec), we will propose a mechanism to represent students using their code submissions for given programming exercises for a course as a matrix (user2code2vec). We will in-vestigate how this methodology can be used to effectively compare and rank students within in a class, to cluster students who show similar behaviour and to perform class-based analytics over the cohort of students.
The research questions that we investigate in this particular aspect of the thesis work can be enumerated as the following:
RQ2: How can students’ programming submissions be encoded into vectors for use as internal representations of those students?
RQ3: By leveraging the vectorisation of code submissions for a given course, how can we represent students based on their programming work?
1.3
Introduction to Adaptive Feedback
As part of the experimental work in this thesis we conducted several semester-long classroom studies and collected data from several computer programming courses that adopted our approach to using predictive analytics in learning applications. In addition, during the second part of the semesters in which this was used, typically after students complete their first laboratory computer-based examination, students were free to opt-in to receive weekly personalised notifications. The feedback con-tained information regarding their predicted performance, based on the student data modalities gathered including their progress with laboratory sheets, programming code solutions, a form of peer feedback from predicted top-ranked students within the same class and university resources to reach out for help if needed, such as the University Student Support department, the course’s lecturer or our system.
The feedback has been given via two methods:
• Weekly email notifications
• Virtual assistant (a WhatsApp ChatBot)
The accuracy of our Predictive Analytics models is crucial as students will receive customised feedback regarding their predicted performance. Then, we were able to measure the engagement with these customised notifications and how that could be an indicator of their performance. In addition, students were surveyed for their views and impressions.
The research questions derived from this subsection are the following:
RQ4: What are the effects of timely automatic adaptive support and peer-programming feedback on students’ performance in computer peer-programming courses?
RQ5: What are students’ and teachers’ perspectives and experiences after adopting a predictive modelling and adaptive feedback system into their own classes?
1.4
Introduction to Graph Theory and Networks
MOOCs are revolutionising education by giving students around the world open ac-cess to first-class education via the web. Lectures, readings, exercises and discussion forums are now one click away for anybody with an internet connection and a com-puter, anywhere. MOOCs gained popularity in 2012, which according to the New York Times, became “the year of the MOOC”. Since then, the leading providers have been Coursera, Udacity and edX.
edX’s mission is to increase access to high-quality education for everyone, every-where and at the same time to enhance teaching and learning on campus and online. This MOOC provider, founded by Harvard University and MIT, is non-profit and open source. They offer courses from the world’s best universities and institutions. On top of that, edX empowers research in education, pedagogy and learning by working with university partners. Their online environment is a great platform to explore how students learn and how lecturers can best teach their courses.
We will introduce a methodology to analyse large amount of students’ learning states on two mathematics courses offered by the Global Freshman Academy pro-gram at Arizona State University. These two courses utilised ALEKS (Assessment and Learning in Knowledge Spaces) Artificial Intelligence technology to facilitate massive open online learning. We will explore network analysis and unsupervised learning approaches (such as probabilistic graphical models) on these types of Intel-ligent Tutoring Systems to examine the potential of the embedding representations that we develop in the thesis, on students’ learning.
The single research question derived in this area is stated as the following:
RQ6: Can we extract valuable insights from massive open online learning platforms utilising the sequences of learning states?
1.5
Thesis Structure
This thesis consists of the following eight chapters:
(i) Introduction: the current chapter, which presents some of the context for the work reported later.
(ii) Literature Review (Chapter 2): this chapter explores state-of-the-art re-search in Learning Analytics and Educational Data Mining available in the literature.
(iii) Students’ Digital Footprints and Data Used in the Thesis (Chapter
3): we introduce the datasets used for the studies which we use throughout the thesis, and these datasets are taken from two institutions.
(iv) Modelling Student Online Behaviour (Chapter 4): this chapter gives an overview of how to deploy a traditional Machine Learning model in an educational environment using students’ digital footprints taken from that education environment.
(v) Modelling Students With Embeddings(Chapter 5): building on the pre-vious chapter we explore how we can model students using their code submis-sions by leveraging the technique of embeddings.
(vi) Adaptive Feedback to Students (Chapter 6): we study how students im-prove their performance in end-of-semester module examinations based on the feedback provided to them.
(vii) Using Graph Theory and Networks to Model Students (Chapter 7): we look at graph theory to explore how students learn mathematical concepts.
(viii) Conclusions (Chapter 8): this final chapter summarises the research pre-sented, revisits the research questions and asks have they been answered and proposes future directions for further research.
Literature Review
2.1
Introduction
In this chapter we examine state-of-the-art literature regarding Artificial Intelligence techniques and how they may be used to help students to learn Computer Science programming skills and Mathematical concepts. These methods are broadly divided into Supervised Learning and Unsupervised Learning.
2.2
Machine Learning and Predictive Modelling
Research has shown that there has been significant interest in searching for the factors which motivate students to succeed in their first computer programming module as they master a programming skill set. In particular, researchers have been trying to identify the so-called “weak” students by looking at their characteristics, demographics, online and offline behaviour and performance in assessments [48]. Demographics, academic and psychological factors are all examples of static char-acteristics. When used for predicting computer programming success they include such things as prior programming knowledge [62], prior academic history like math-ematics scores, number of hours playing video games and programming self-esteem [16, 88]. All these have been used in analysis of learning of computer programming, and with some success.
However useful these are, these factors do have some limitations [105]. First, this information has typically been gathered using written questionnaires. Lectur-ers in UnivLectur-ersity settings have to process them and by the time they finish their course, some students may already have disengaged with their course. Second, and more importantly, these parameters do not reflect the students’ actual effort and their learning progress throughout their course and might discourage students who are working on the material but possess characteristics like previous mathematics results, that are likely to present difficulties.
More recently, researchers have shifted their focus to a more data-driven approach to predicting student outcome by analysing computer programming behaviour, in-cluding patterns in compilations and programming states associated with the com-puter programs that students write and submit for assessment. These are substan-tially more effective at reflecting actual programming ability and competence, as well as progress in learning, than the characteristics on test performance gathered
prior to the commencement of the course [104,18].
The two main predictive measures are the Error Quotient [54] and the Watwin Score [105] which measure a student’s behaviour between compilations and transi-tions in their learning from compilation errors. These metrics gather snapshots of the student’s code on compilation using BlueJ or Microsoft Visual Studio with the OSBIDE plug-in while teaching using the Java or C++ programming languages and they potentially augment the programming environment to offer dynamic feedback or pathways.
Based on these predictors, new models, like the Normalised Programming State Model [23] which focuses on learning transitions, or data-driven approaches using machine learning, are emerging for these type of courses [1,8]. In Computer Science education research, there are further studies to evaluate how students learn and to identify “at-risk” students by detecting changes in their behaviour as they learn computer programming, over time [39,24].
learn, students at Universities usually interact with an online Learning Management System (LMS) or Virtual Learning Environment (VLE) and in doing so they leave a digital trace or footprint. This has been leveraged previously to predict student performance in end-of-course exams across a range of subjects, not just computer programming. The most popular of the online educational systems are Moodle and Blackboard [25]. Moodle is an open source LMS while Blackboard (formerly WebCT) is a proprietary system.
Purdue University’s Course Signals project predicts student performance using demographics, past academic history and learning effort as measured by interaction with their VLE, Blackboard. The predictive algorithm is run on demand by instruc-tors and the outcome is fed back to students as a personalised email as well as a traffic signal which gives an indication of each student’s prediction [7]. The Open University offers distance learning education and is the largest academic institution in the UK with more than 170,000 students. The OU Analyse project identifies and supports struggling students in more than 10 courses at different years of study. Lecturers may find it difficult to identify at-risk students without the feedback from face-to-face interactions that distance education has, but with predictive data at their finger tips they are able to identify, intervene, and support students and im-prove their virtual learning experience [60, 109]. Lastly, Dublin City University’s Predictive Educational Analytics (PredictED) project used student interaction with the university’s VLE, to predict likely performance of end-of-semester final grades for first year students across a range of topics. This project’s interventions yielded nearly 5% improvement in absolute exam grade and proved that weekly automated feedback and personalised feedback to vulnerable first year students has a significant positive effect on their exam performance [28].
Learning Analytics have proven to provide a good indicator of how students are doing by looking at how online resources are being consumed. In computer programming classes and blended learning classrooms, students leave an even far greater digital footprint we can leverage to improve their experience and help to
identify those in need [51]. Combining learning analytics engagement features with programming states or behaviours in large classes can enable Lecturers to automat-ically identify students having difficulties at an earlier stage [58].
In research into Computer Science Education, based on the granularity, namely frequency and type of events, different models have been developed for student programming learning behaviour. The digital footprints used to drive these models include key strokes, program edits, compilations to executions and submissions [51]. In our work, explained in more detail in the following sections, we leverage an automated grading system for the teaching of programming. We collect submissions, a fine-grained footprint about each submission, and web logs regarding students’ interactions with the material. However, we should note, we are limited by the frequency of the students submitting their solutions and we miss the programming actions in between.
2.2.1
Traditional Machine Learning in Practice
Machine learning algorithms build a mathematical model based on sample data (known as “training data”) to make predictions without being explicitly programmed to perform a task [17]. We will now describe the steps followed in this thesis
(i) Data management and storage: data typically comes from files, databases or streams (for real time processing of live data). Files are good for distri-bution, and they can be structured or unstructured data. Databases are a good choice for centralised information and network access and the structure can be enforced using schemas. In our research, we sync all the students’ programming file submissions to our own systems and we are also provided access to other files such as grades and student demographics. These files are usually in plain text format such as CSV or JSON which are human readable. Binary formats are also used for storing numeric arrays. In addition, when we develop web platforms for Faculty to look at we store this type of information in structured or unstructured databases.
(ii) Data wrangling and cleaning: datasets typically contain errors, inaccu-racies, missing values, duplicates, inconsistencies, etc. Data wrangling is the process of transforming raw data into data we can process for extracting useful information. Raw data should be kept separate from cleaned data. Typically, we fix inaccuracies of the data and deal with missing values at this stage of our work.
(iii) Data summarisation: From the data distributions of each of the variables in our dataset, we analyse the measures of central tendency (statistics to cap-ture the middle of the distributions) such as mean, median and mode as well as measures of statistical dispersion (statistics to measure how stretched each distribution is) such as variance, standard deviation and inter-quartile range. In addition, we can measure statistics of association between variables such as the covariance (how much two variables vary together), the linear (Pear-son) and non-linear (Spearman) correlation coefficients (normalised version of the covariance for measuring the relationship between quantitative variables) and the mutual information (measure of the mutual dependence between two variables which is also knows as the “correlation for the 21st century” [99]).
In our work, we confirm the predictive power of our features by analysing the correlation coefficients with a target variable. For instance, the programming percentage of work done by students is typically highly correlated with their performance on examinations.
(iv) Data visualisation: exploring the distributions of our variables and their relationships visually is incredibly useful. This provides us with sanity checks for our datasets and we can generate or confirm any hypothesis we may have at this stage. Visualisations are also key to communicate our hypotheses, conclusions and findings. For that, we typically use histograms for distribu-tions, scatter plots for relationships between variables or bar charts to compare quantities.
(v) Modelling: in traditional Machine Learning a collection of features are hand-crafted from the parameters or variables extracted from the data. This is a very manual process. In order to model the behaviour of, for instance students learning computer programming skills, we can approach it in two different ways:
• Unsupervised Learning: where we only have unlabelled data. In or-der to learn structure from the data, we assume the data forms distinct clusters (clustering) or data lies close to a lower dimensional manifold embedded in a high dimensional space (dimensionality reduction). Clus-tering techniques we can use are k-means, agglomerative clusClus-tering and Gaussian Mixture Models (GMM). The most popular dimensionality re-duction techniques are PCA (Principal component analysis) and t-SNE (t-distributed stochastic neighbour embedding). In our work, as we will explain later, how we learned hidden structure from millions of transac-tions of students learning Mathematical concepts.
• Supervised Learning: here we have labelled examples, also known as groundtruth. There are two types of scenario:
– Regression: when the output variable to be predicted is a real num-ber. In our work, that would be equivalent to predicting an average grade of the year for the first-year university students in our univer-sity based on behavioural logs.
– Classification: when the output variable to be predicted is a cate-gorical variable. In our work, we predicted two categories, whether our students were “at-risk” or not.
Our dataset will be split into three sets: training, validation and testing. Training will be used to fit the model and the validation data to optimise the hyperparameters of the learning function. Cross-Validation is a tech-nique used to validate the model that repeatedly trains it and tests it on
a subset of the data (also known as folds). The testing set will be used to calculate the error using a scoring method such as Accuracy or F1-Score. Some of the more commonly used supervised learning algorithms are: Linear Regression (regression), Logistic Regression (classification), Decision Trees (typically classification), Random Forests (typically clas-sification), Support Vector Machines (typically classification) and many more. A description of these different algorithms is beyond the scope of this thesis but can be found in any good online learning material or textbook such as [43] and [17].
2.3
Deep Learning and Embeddings
Deep Learning (DL) is an approach to designing and building AI systems and a subfield of of the broader area of machine learning. In ML, computers learn patterns from experience and past data, as was explained in more detail in the previous section. DL is a type of ML that represents or models the world as a nested hierarchy of concepts. More abstract concepts or representations are computed in terms of less abstract ones [43]. Figure2.1 shows the relationship between AI disciplines and gives an example for each. Figure 2.2 is a high-level schematic of the relationship among some of these, with examples.
In the work in this thesis we are particularly interested in exploiting embeddings as an AI technique because of their applicability to modelling student behaviour, but first a little background into the topic. Neural language model-based distributed representations of text as proposed by [14] and further developed by [66, 67], learn distributed word representations using Neural Network based methods which are trained over large collections of text. These representations, commonly referred to as embeddings, embed an entire vocabulary into a comparatively low-dimensional vector space, where dimensions are real values. These embedding models have been shown to perform well on semantic similarity between words and on word analogies tasks [67, 13].
Figure 2.1: Venn diagram showing how deep learning is a kind of representation learning, which is in turn a kind of machine learning, which is used for many but not all approaches to AI. Image taken from [43].
Figure 2.2: Flowcharts showing how the different parts of an AI system relate to each other within different AI disciplines. Shaded boxes indicate components that are able to learn from data. Image taken from [43].
In the area of computer programming, predicting code properties or extracting meaningful features from vast amounts of code data has experienced tremendous progress recently [4,83,6]. Predicting code properties without compiling or running is used for name prediction of program entities [5], code generation [90], code com-pletion [91] and code summarisation [3]. In addition, embeddings-based techniques have been recently applied to learning effective code representations, comparing source codes and recommending approaches to students.
[71] recently proposed how to successfully develop program vector representa-tions to be used in conjunction with Deep Learning models for the task of classifying computer programs. The vector representations learned used the nodes from Ab-stract Syntax Trees (ASTs) which are a tree representation of the abAb-stract syntactic structure of source code [77]. The authors explored other granularity levels for rep-resentations such as characters, tokens or statements. In our work, we also explore tokens as a way to vectorise code submissions by leveraging the Python Tokeniser library.
Even more recently, [6] developed a code2vec neural attention network that col-lects AST paths and aggregates them to extract syntactic information from code snippets. Their objective was to predict semantic properties such as method names by representing snippets of code as continuous distributed vectors, also known as Code Embeddings. In our work, we build similar higher-level distributed vectors to predict the correctness of code solutions to verify patterns and meaningful informa-tion is then extracted.
[83] leveraged Code Embeddings to give feedback to students in MOOCs. First, they captured functional and stylistic elements of student submissions and, then, they learned how to give automatic feedback to students. This was done by devel-oping functionality matrices at each point of the syntax tree of the submission.
In terms of providing student feedback, [80] demonstrated a continuous hint approach can predict what capable students would do in solving a multi-step pro-gramming task and that the hints built using embeddings can match the edit hints
that human tutors would have given. Also, [44] proposed feedback strategies and automatic example assignments using structured solution spaces. More recently, [86] collected a dataset of rich events streams. Instead of studying artifacts after they happened, they build FeedBaG, a general-purpose interaction tracker for Vi-sual Studio that monitors development activities and collected data from software developers.
Finally, [72] proposed a tree-based Convolutional Neural Network, denoted as TBCNN, using a convolution kernel designed over programs’ ASTs to capture struc-tural information. They also used this technique to classify programs based on functionality and detecting code snippets with particular patterns. In addition, de-veloping a dataset of syntax trees can be used for recommendations as [87] did for C# using solutions taken from GitHub.
In our work, code solutions from students are transformed into continuous dis-tributed vectors, Code Embeddings, to be used as a representation of their program-ming submissions (code2vec). These vectors are leveraged to construct a matrix that represents each user in a comparable way (user2code2vec). [93] proposed a Tensor Factorisation approach for modelling learning and predicting student’s performance that does not need any prior knowledge. This work outperformed state-of-the-art approaches for measuring learning and predicting performance such as Bayesian Knowledge Tracing and other tensor factorisation approaches. We were inspired by this work [93] to develop a similar representation for users who learn coding at our University and we use embeddings to learn higher level representations of that information.
Deep learning methods for machine learning, are representation-learning meth-ods with multiple levels of representation, obtained by stacking multiple simple but non-linear layers with weights which are learned from data [61]. These culminate in an output which may be a category, or a number, or multiples. The way in which the deep learning architecture operates, we learn increasingly more abstract concepts. As the amount of data available to deep learning algorithms increases, accuracy of
the predicted output does as well, substantially outperforming traditional feature extraction techniques combined with traditional machine learning algorithms [78], across a range of applications.
We consider the following type of neural networks:
• Feed-forward Neural Networks: where each neuron in the input layer is connected to every output neuron in the next layer (fully connected layer).
• Convolutional Neural Networks (CNNs): where each layer in a CNN applies a different set of filters (also known as convolutions) and combines the result before applying an activation function such as Rectified Linear Unit (ReLU). In image classification applications, these convolutional layers can learn edges and shapes and, on top of those layers, higher-level features such as facial structures.
• Recurrent Neural Networks (RNNs): where the connections between nodes form a directed graph along a temporal sequence. This method uses its memory to process sequences of inputs.
In contrast to neural network architectures, mathematical embeddings involve converting an item from a space with many dimensions to a continuous vector space with a much lower number of dimensions. The most popular methods to generate this mapping are neural networks and dimensionality reduction. In our case, we leverage neural networks. By framing a problem as a prediction, for instance, and including an embeddings layer with a much lower dimension we force the network to learn higher level representations. This will be further explored in Chapter 5.
This section has presented a fairly high level overview of deep learning but there is much more that we could describe, including gradient descent, different kinds of activation functions, initialisation of the network, regularisation, and more, but these are outside the scope of this thesis where we want to use these techniques rather than develop new ones. The reader is referred to the well-cited book by Goodfellow et al., for details on this topic [43].
2.4
Adaptive Feedback in Learning
Feedback is an effective way to motivate novice programmers and an important research avenue for teaching computer programming. Recently, researchers have been working on augmenting the IDE or programming environment by crowdsourc-ing code solutions. Students are suggested error corrections or solutions that their peers have applied before. Java has been the programming language initially tar-geted for this approachwith systems such as BlueFix [103] and HelpMeOut [46]. This latter social recommender system was also applied to learning on the Arduino platform. In addition, Crowd::Debug [73] was presented as a similar solution for the Ruby programming environment, a test-driven development language.
In terms of notifying students as to how they are progressing throughout the semester, Purdue University’s Course Signals [7] sent a personalised mail and posted a traffic signal as an indication of their performance and Dublin City University’s PredictED [28] project notified students how they were doing and where they were rated in terms of progress within their own class. Both systems yielded impressive improvement in first-year retention rates. In our work, our programming grading system provides real-time feedback on computer program submissions by running a suite of testcases but it does not provide code suggestions or solutions for errors that the programs may have.
Feedback has always been one of the most effective methods in enhancing stu-dents’ learning [47]. There is an abundance of factors that affect educational achieve-ment. Some factors are more influential than others. For instance, feedback types and formats and the timing of providing feedback [95] are both important. Stud-ies have reported that positive feedback is not always positive for students’ growth and achievement [47]; “critical” rather than “confirmatory” feedback is the most beneficial for learning regardless of whether feedback was chosen or assigned [31]. Content feedback achieves significantly better learning effects than progress feed-back, where the former refers to qualitative information about the domain content and its accuracy, and the latter describes the quantitative assessment of the
stu-dent’s advancement through the material being covered [53]. Several of the different feedback factors were explored at the intersection with the learner’s variables (i.e. skills, affects) and reported to support personalised learning [75]. For instance, cog-nitive feedback was found to make a significant difference in the outcomes of student learning gains in an intelligent dialogue tutor [21]. Students’ affects were adapted to improve motivational outcome (self-efficacy) in work reported in [21,32] while using student characteristics as input to tutoring feedback strategies to optimise students’ learning in adaptive educational systems was reported in [76]. While a large body of empirical studies investigate the feedback impacts in the context of learning [110], we focused on researching educational technology to support delivering adaptive feedback for computer programming courses.
Recommender systems have provided numerous novel applications in industry in-cluding recommendation of books, movies, music and more. Recommender systems can offer the education sector a new direction of research into technology enhanced learning [64] by including recommender technology in learning platforms. In the context of learning computer programming, several studies implemented resource recommendation or best next-item or step recommendation (i.e. the next best item to be viewed in the navigational sequence) [49], and these have reported promis-ing approaches and results. For instance, CodeReco [97], CodeBroker [111] and SnipMatch [107] all use similarity measures to recommend partial source code to facilitate problem solving while OOPS recommends relevant worked examples [98]. In this work, we focus on recommending relevant resources based on learner’s needs.
2.5
Graph Theory and Networks
In the final topic for our literature review, we briefly summarise work in the area of graph theory and networks. The reason for including this topic is that a system called ALEKS (Assessment and Learning in Knowledge Spaces), which we describe in the next Chapter in Section 3.2.2, leverages AI techniques in order to map stu-dents’ knowledge. ALEKS is based on knowledge spaces, which was introduced in
1985 by Doignon and Falmagne, who describe the possible states of knowledge of a learner [35]. In order to develop a knowledge space, a domain like Algebra or Chem-istry is modelled and divided into a set of concepts and feasible states of knowledge where the student’s knowledge is at any given point in time. This technology adapts and navigates the students by determining what the student may know and may not know in a course and guides her to the topics she is most ready to learn. It as-sesses the student’s knowledge periodically to ensure topics are learned and retained [36]. Recent research has shown that using ALEKS for learning Mathematics has a positive learning impact on an after-school program for more than 200 sixth graders [29, 30].
Related to our use of data from the ALEKS system, recent research has shown that Network Analysis measurements can be used as predictive features for machine learning models in addition to generic content-based features [26]. Moreover, se-quential modelling (i.e. Hidden Markov Models (HMMs)) can be useful to uncover student progress or students’ learning behaviours [84, 83, 50]. We hypothesise that modelling the evolution of a large number of students’ working behaviours with so-cial network features, will allow us to uncover students’ progression. This, in turn, will allow the possibility to enhance the student experience with further personalised interventions in these Intelligent Tutoring Systems as they gather rich information about concepts, topics and learning states.
Students’ Digital Footprints and
the Data Used in the Thesis
In the work reported in this thesis, we leveraged data from two Higher Education Institutions, namely Dublin City University (DCU) and Arizona State University (ASU).
Higher Education Institutions collect data about their students at multiple points during the student journey and they store this in different locations and on different institutional systems. This data includes information on students’ background and demographics at the time of initial registration, interaction with the institution’s on-line learning environments and other onon-line resources like WiFi access, onon-line library resources and student support services, geolocated data from physical locations like lecture attendance or library accesses, and some aspects of their social activities like memberships of clubs and societies. Leveraging all these sources of information and many more, if they were integrated together, could shape a picture of the students’ engagement and involvement on campus.
Moreover, in learning discipline-specific subjects such as computer programming, students spend a considerable amount of their time in laboratory sessions. While learning computer programming, students typically interact with a platform to de-velop and submit their program code for specified assignments problems leaving an
even greater digital footprint than learning in other disciplines [51, 52]. Some of these platforms are: Web-CAT [38], CloudCoder [81], CodeWorkout [37], Blackbox [22] using the BlueJ plugin [59] and many more.
These types of computer program submission platforms are often used to eval-uate the correctness of the students’ computer programming work which acts as a measure of their progression through the course, and the effectiveness of their learn-ing. Analytics platforms could be used to make use of this information in order to understand students’ engagement and behaviour, which could, in turn, be an indicator of their learning experience. Unfortunately, these automated assessment systems are not the only tools that the students and the instructors will use, espe-cially when students take multiple courses or modules in the computer science area, and they often have to switch among several online educational platforms for each course. Therefore, without collecting all the diverse interaction data, plus all the other data on students that an institution has, it is challenging to establish reliable groundtruth data in order to train predictive models.
In summary, at Dublin City University, we collected student data from Computer Science students learning how to code in programming modules and, in addition, from first-years at the whole university. In Arizona State University, we collected student data from reviewing behaviours in a programming course and from Math-ematics MOOCs taught at the EdX platform. Table 3.1 shows a summary of the data used in the thesis.
Table 3.1: Summary of the Data Used in the Thesis University School Type Source
Computing Programming DCU’s Grading Assistant DCU
All Usage of Resources Various
Computing Programming ASU’s Grading Assistant ASU
3.1
Dublin City University
Dublin City University is a university based on the Northside of Dublin, Ireland. Created as the National Institute for Higher Education, Dublin in 1975, it enrolled its first students in 1980, and was elevated to university status in September 1989 by statute. The university has 17,000 students and around 1,200 online distance education students.
3.1.1
School of Computing
Dublin City University offers two honours Bachelor degrees in Computer Science through its School of Computing, a B.Sc. in Computer Applications (CA) and a B.Sc. in Enterprise Computing (EC). CA prepares students for a career in com-puting and information technology by giving them in-depth knowledge of software engineering and the practical skills to apply this knowledge to develop the tech-nology behind computing-based products. EC prepares students to use computing technology to help organisations to work together and give companies a competitive edge in the marketplace. The EC degree is more focused on topics like managing information technology and developing and using systems to improve and even to re-design the way organisations do business. It is safe to say, CA teaches students deeper computer programming skills and EC is more business and project manage-ment oriented.
The data used in this thesis from DCU was drawn from students registered in the CA and EC degree programs. Specifically, the data sources we made use of in order to model student interaction, engagement and effort in computer programming courses in DCU consists of:
• Student Characteristics: gender, date of birth, citizenship and domicile.
• Prior Academic history: prior-to-university test scores: Irish CAO points and Leaving Certificate exam scores (equivalent to GPA and SAT exams in the US) and prior academic history at the university if there is any.
• Interaction logs: Students interact online with the custom VLE developed for computer programming courses and every instance of a student’s access to a page of any kind is recorded and stored. These are web logs from an Apache web server for the resource or page requested, the date and time of access, the unique student identifier, and the IP address of the device used for access.
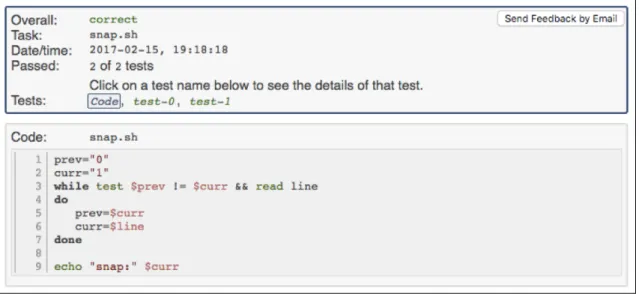
• Programming submissions: A custom Virtual Learning Environment (VLE) for the teaching of computer programming has been developed by Dr. Stephen Blott1. This automated grading platform is used in a variety of computer pro-gramming courses across the Faculty including students in both the CA and EC degree programmes. Using this VLE, students can browse course material (as on any LMS) and submit and verify their computer programming labora-tory work. Figure3.1shows how students are able drag and drop their program files onto the platform. Figure 3.2 shows the real-time feedback students get when verifying a program by running a suite of pre-specified testcases on the grading server. The analytics information extracted for each submission is the program name, code, laboratory sheet that it belongs to, whether the submis-sion is correct or incorrect according to the lecturer’s testcases, and the date and time of the submission.
Table 3.2 presents a list of the courses we used to test our various research questions and hypothesis that will be discussed in the following sections. Some of these courses were delivered multiple times and we use data gathered from multiple runnings of these courses.
These courses use the custom VLE for the teaching of computer programming which allows us to capture a fine-grained digital footprint of students interacting with computer programming learning material and submitting their code solutions.
1Dr. Stephen Blott is an Associate Professor at the School of Computing in Dublin City
Figure 3.1: Screengrab from the Virtual Learning Environment for the Teaching of Computer Programming at Dublin City University
Table 3.2: Courses in DCU’s School of Computing used in this thesis Course Title Degree Year Semester Language
CA116 Programming I CA 1st Fall Python
CA117 Programming II CA 1st Spring Python
CA114 Enterprise Computer Systems EC 1st Spring Shell
CA177 Programming Fundamentals I EC 1st Spring Python
CA277 Programming Fundamentals II EC 2nd Fall Python
Figure 3.2: Instant Feedback Provided to the Student After Submitting a Program to the Automated Grading Assistant
3.1.2
Data from across the Whole University
In addition to log and interaction data from the custom VLE for learning computer programming, a range of other sources have been used to extract data on all first-year undergraduate students at the university. This was gathered in order to model their behaviour and chances of success at the university, and it includes the following:
• Student Characteristics: gender, date of birth, citizenship and domicile.
• Prior Academic history: prior-to-university test scores and prior academic history at the university.
• Registration: date of first registration and date of cancellation if applicable.
• Clubs and Societies: membership to any organisation run at the university.
• Funding: receipt of any SUSI (Student Universal Support Ireland) funding.
• Library: dates of borrowing instances (books) and dates and times of each occasion entering library building.
• Computer resources: occasions students use the on-campus computer labs.
• Student Support (CRM): records of student interaction with the Student Support office for the school attended.
• General VLE usage: students at Dublin City University use Moodle as their main VLE and records associated with assignment submission were recorded and extracted.
• WiFi: Eduroam access logs of students logging in to different hotspots on campus.
• Sports Centre: records of students using the sports facilities on campus. Approval for access to this confidential non-anonymised student data was granted by DCU Research Ethics Committee, reference DCUREC/2014/195.
3.2
Arizona State University
Arizona State University (ASU) is a public research university ranked number 1 in the U.S. for innovation, and dedicated to accessibility and excellence. ASU has five campuses spread across the Phoenix metropolitan area, and four regional learning centres throughout Arizona. ASU is one of the largest public universities by enrol-ment in the U.S. with 80,000 students attending classes across its metro campuses and 30,000 students attending online.
3.2.1
School of Computing, Informatics, and
Decision Systems Engineering
Arizona State University’s Web Programming Grading Assistant (WPGA) 2 was developed by the University to serve as a platform that connects the physical and