TRANSFER LEARNING FOR A MULTIMODAL
HYBRID EEG-FTCD BRAIN-COMPUTER
INTERFACE
by
Elise Veronica Louise Dagois
B.S in Electrical and Computer Engineering, ENSEA, 2017
Submitted to the Graduate Faculty of
the Swanson School of Engineering in partial fulfillment
of the requirements for the degree of
Master of Science
University of Pittsburgh
2018
UNIVERSITY OF PITTSBURGH SWANSON SCHOOL OF ENGINEERING
This thesis was presented by
Elise Veronica Louise Dagois It was defended on November 26th 2018
and approved by
Murat Akcakaya, Ph.D., Assistant Professor, Department of Electrical and Computer Engineering
Ervin Sejdic, Ph.D., Associate Professor, Department of Electrical and Computer Engineering.
Zhi-Hong Mao, Ph.D., Professor,
Department of Electrical and Computer Engineering. Thesis Advisor: Murat Akcakaya, Ph.D., Assistant Professor,
Copyright © by Elise Veronica Louise Dagois 2018
TRANSFER LEARNING FOR A MULTIMODAL HYBRID EEG-FTCD BRAIN-COMPUTER INTERFACE
Elise Veronica Louise Dagois, M.S. University of Pittsburgh, 2018
Transfer learning has been used to overcome the limitations of machine learning in Brain-Computer Interface (BCI) applications. Transfer learning aims to provide higher perfor-mance than no-transfer machine learning when only a limited number of training data is available and can consequently reduce training and calibration requirements. BCI systems are designed to provide communication and control tools for individuals with limited speech and physical abilities (LSPA). Most noninvasive BCI systems are based on Electroencephalo-gram (EEG) because of EEG 's cost effectiveness and portability. However, EEG signals present low signal-to-noise ratio and nonstationarity due to background brain activity. Such a behavior may decrease the global performance of the system. To overcome the disadvan-tages of EEG signals, in our previous work, we developed two different multi-modal BCI systems based on EEG and functional transcranial Doppler (fTCD), a cerebral flood veloc-ity measure. These two multi-modal systems that combine EEG and fTCD signals aim to reduce performance degradation obtained when EEG was the only BCI modality. One of the systems is based on steady state evoked potentials and the other one is designed using motor imagery paradigms. Our results have shown that such a hybrid system outperforms EEG only BCIs. However, both systems require significant amount of training data for per-sonalized design which could be tiresome for the target population. In this study, we extend these systems by performing a new transfer learning algorithm and we demonstrate the cor-responding algorithm on the three different binary classification tasks for both BCIs in order to reduce the calibration requirements. Performing experiments with healthy participants,
we collected EEG and fTCD data using both BCI systems. In order to apply transfer learn-ing and to reduce the calibration requirements for BCIs, for each participant, we identify the most informative datasets from the rest of the participants based on probabilistic similarities between the class conditional distributions and increase the training set from this data. We demonstrate that transfer learning reduces the calibration requirements up to %87.5 for BCI systems. Also, through comparison between different classifiers LDA, QDA, and SVM, we observe that QDA achieves the higher difference between transfer learning and no transfer accuracy.
Keywords: Transfer Learning, Hybrid Brain Computer Interfaces, Electroencephalogram, Functional Transcranial Doppler Ultrasound, Distance Measures, Machine Learning.
TABLE OF CONTENTS
PREFACE . . . ix
1.0 INTRODUCTION . . . 1
2.0 MOTOR IMAGERY BCI SYSTEM . . . 5
2.1 Method . . . 5
2.1.1 Experiment Setup . . . 6
2.1.2 Pre-processing and Features Extraction . . . 8
2.1.3 RDA Scores and Similarity Measures . . . 9
2.1.4 Classification . . . 11
2.2 Transfer Learning Algorithm . . . 12
2.3 Results and Discussion . . . 18
2.4 Conclusion . . . 22
3.0 SSVEP HYBRID BCI SYSTEM . . . 23
3.1 Method . . . 23
3.2 Results and Discussion . . . 25
3.3 Conclusion . . . 31
4.0 CONCLUSIONS AND FUTURE DIRECTIONS . . . 32
LIST OF TABLES
2.1 Table of classification models . . . 13 2.2 Mean of accuracy among all participants and corresponding sensitivity and
specificity for RA vs LA. . . 21 2.3 Mean of accuracy among all participants and corresponding sensitivity and
specificity for RA vs BL. . . 21 2.4 Mean of accuracy among all participants and corresponding sensitivity and
specificity for LA vs BL. . . 21 3.1 Mean of accuracy among all participants and corresponding sensitivity and
specificity for WG vs MR.. . . 30 3.2 Mean of accuracy among all participants and corresponding sensitivity and
specificity for MR vs BL. . . 30 3.3 Mean of accuracy among all participants and corresponding sensitivity and
LIST OF FIGURES
2.1 Stimulus presentation for the hybrid BCI system. During one trial, the arrow indicates the task the user has to mentally performs. . . 7 2.2 Diagram showing features extraction and selection. The two feature vectors
are normalized using min max normalization and are concatenated into one single features vector. . . 8 2.3 Diagram representing the process to obtain the distance between the dataset
of one participant and the others. . . 11 2.4 Process of transfer learning compared to traditional machine learning algorithm
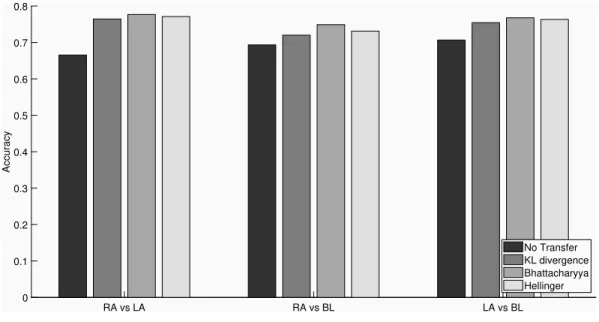
adopted from [41]. . . 15 2.5 Accuracy (averaged across participants) for MI BCI provided by KL
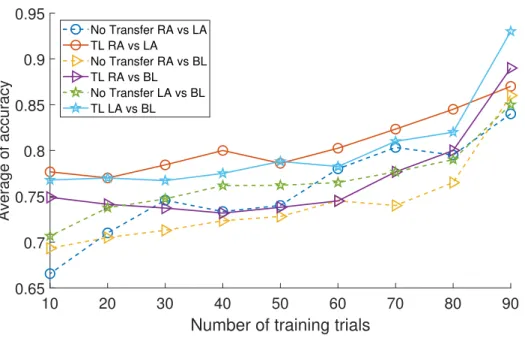
diver-gence, Bhattacharyya and Hellinger computed for the three binary classifica-tion problems through transfer learning. . . 19 2.6 Accuracy for MI BCI as a function of the number of trials in the training set
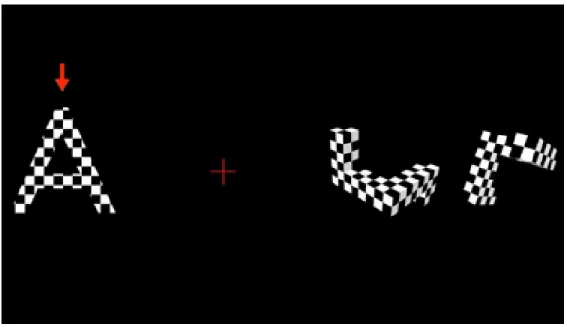
for each binary problem computed with and without transfer. . . 20 3.1 Stimulus presentation for our flickering MR/WG hybrid BCI system. The
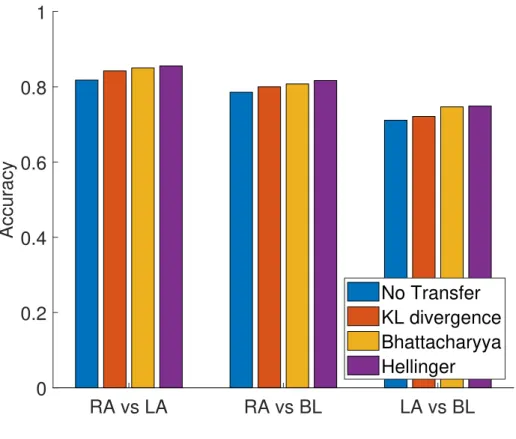
arrow indicates which mental task the user has to perform. . . 25 3.2 Accuracy (averaged across participants) for SSVEP BCI provided by KL
di-vergence, Bhattacharyya and Hellinger computed for the three binary classifi-cation problems through transfer learning. . . 27 3.3 Accuracy for the SSVEP BCI as a function of the number of trials in the
PREFACE
This master thesis would not have been possible without the trust and the guidance of my advisor Dr Murat Akcakaya and the precious advice given by my colleague Aya Khalaf. I thank you for giving me a chance of being part of this research team. I have acquired a great experience and new skills that will be very useful in my future. I also thank Dr Ervin Sejdic and Dr Zhi-Hong Mao for serving on my thesis committee and to review my thesis work.
I also thank everyone in the lab that keep creating a great atmosphere everyday and supporting each other with special thanks to Safaa Mohamed and Busra Tugce Susam, Yasmine Ahmed and Yuansheng Zhu for your help and collaboration. I am very grateful for your warming welcome and for your support during my stay.
I would like to thank Thomas Tang and Carine Sabouraud of the international relations team at the Engineering school ENSEA for giving me the opportunity to spend a part of my study abroad at the University of Pittsburgh. I also thank Dr Mahmoud El Nokali for his constant support and for placing his trust in the international students.
1.0 INTRODUCTION
In recent years, transfer learning has been used extensively to develop classification tech-niques that utilize previously acquired data to train a model that will work on unknown datasets and to improve the generalization performance of classifiers. These methods mimic human memory to generalize the acquired knowledge to perform various tasks [9]. Such transfer learning methods have the capability to increase classification performance when only a small dataset is available to train a classification model [32],[42]. Noninvasive brain computer interface (BCI) design is one application domain that would benefit from such transfer learning approaches [27].
Non invasive BCIs are designed to help individuals with neurological deficits or with Lim-ited Speech and Physical Abilities (LSPA) to communicate with their caretakers [4] without any surgical interventions. More specifically, such BCIs aim to help individuals with LSPA by allowing them to type on a computer screen or control electronic devices such as prosthet-ics limbs, wheelchairs or robotic agents using brain signals [10], [48], [11], [38]. BCI systems work by translating neural activity generated by the brain into control signals. Therefore, they require data generated voluntarily from brain activity to efficiently translate one in-dividual’s intent [43], [19]. Electroencephalogram (EEG) is the most preferred modality to build such BCIs due to its high temporal resolution, cost effectiveness and portability. However, since EEG has low signal-to-noise ratio and demonstrates nonstationarities due to background brain activities, systems built based only on EEG suffer from performance degradations [39], [3]. Hybrid BCI systems are built to overcome the shortcomings of EEG-only BCIs [1]. However the modalities commEEG-only used to complement EEG for hybrid BCI design such as electromyography (EMG) [12], [23] or functional near-infrared spectroscopy (fNIRS) lack the speed and accuracy to be used for real-time BCI applications [25], [31].
In our previous work, we have shown that functional transcranial Doppler (fTCD) that measured blood flow in the brain due to different mental activities has temporal resolutions comparable to EEG to complement EEG for hybrid BCI design and fTCD is robust to nonstationarities due to background brain activities [21], [20]. Moreover we have shown that such a hybrid BCI based on EEG and fTCD outperforms BCIs based on EEG and fTCD only [21], [22]. BCI systems effectiveness depend on the quality of the signals returned by the user. Therefore, the participant is asked to perform specific cognitive tasks to alter brain signals and to produce detectable EEG and fTCD data [18]. Motor Imagery (MI) process movement imagination and conscious mental activity to activate injured regions of the brain and to return brain signals corresponding to a specific movement [35]. Often utilized for rehabilitation, MI has been tested on participants with and without LSPA to explore potential improvements of BCI systems [39], [2]. Systems based on motor imagery BCIs have shown motor improvements for stroke rehabilitation [37]. In our previous study, we developed a novel MI hybrid BCI system based on EEG and fTCD signals both recorded in response to different cognitive tasks. We formulated 3 binary classification problems based on imagery tasks including right arm MI versus baseline, left arm MI versus baseline, right versus left arm MI [21]. From the results of the study, we demonstrated that the multimodal BCI improves performance by about %5 compared to a single modal using EEG only and by %20 compared to a similar model using fTCD only [21].
However, many studies have shown that BCIs using fTCD are more efficient when other types of visual stimuli are utilized and as both tasks formulated are imagery tasks, fTCD is not well adapted for MI hybrid BCI system. In order to overcome this issue that would de-crease the performance and considering these observations from previous studies, we extend this system to a novel BCI system based on visual presentations of EEG and fTCD. The proposed hybrid system is based on two different paradigms including word generation (WG) and mental rotation (MR) jointly presented to the BCI user [28]. It has been shown visual representations such as presented letters and geometric shapes can alter blood velocity and efficiently enables fTCD responses [29]. Based on this observation, the letter and the geo-metric shape instruct the user to perform word generation (starting with the specific letter presented on the screen) and mental rotation of the presented three dimensional geometric
shape to induce changes in the blood flow in two different parts of the brain that are recorded by fTCD. However, to induce changes in EEG we need to modify the representation of the tasks. EEG is indeed not sensitive to such visual presentations as it cannot differentiate these two tasks. Therefore, the EEG component of the hybrid BCI is based on steady state visual evoked potentials (SSVEPs) that are recorded in response to flickering word genera-tion and flickering mental rotagenera-tion with two different frequencies [45], [8], [30], [24]. Previous studies have demonstrated the efficiency of SSVEP BCIs to allow the mental communication between an individual with LSPA and an external device. The user has to perform mental tasks indicated by visual stimuli. The visual icons are flickering with different frequencies and displayed on a screen.
In our previous work, in order to improve the hybrid BCI performance, we utilized a vi-sual presentation paradigm to induce changes in EEG (based on SSVEP) and fTCD (based on mental tasks) simultaneously [21]. Specifically, we expect that SSVEP based BCI will achieve higher performance than the previously developed MI based BCI contributing to an increase in the overall hybrid BCI performance [15]. In order to demonstrate these improve-ments, we have performed BCI experiments with 11 healthy participants. Through these experiments we have developed 3 different binary classifications including word generation (WG) vs mental rotation (MR), MR vs baseline and WG vs baseline, and we have shown that hybrid BCI increases the classification accuracy by%5compared to BCI based on EEG only for the same tasks [21]. Even though the hybrid system improves the performance compared to a BCI based on EEG only, such a hybrid system requires long calibration data (which causes fatigue especially in target population) to design user specific classifiers for the BCI operation.
Contributions of this thesis: In this thesis, we extend our existing systems and we propose to use a novel transfer learning approach to decrease the training requirements. We perform the novel transfer learning method on both MI and SSVEP based BCI systems. In order to apply transfer learning, we extract features using Regularized Discriminant Analy-sis (RDA) from EEG and fTCD data for three different binary classification problems and learn class conditional distributions using kernel density estimation (KDE) for these features. Class conditional distributions are then used to probabilistically identify similarities among
the data collected from multiple participants and to apply transfer learning. For probabilistic similarities, we utilize various probabilistic measures including Kullback-Leibler divergence (KL divergence), Bhattacharyya, and Hellinger distances. We use the RDA scores for transfer learning and as the final features for the classification. We compare three different classi-fiers: quadratic discriminant analysis (QDA), linear discriminant analysis (LDA), and linear support vector machine (SVM). Using the data we collected from healthy participants, we demonstrate that the transfer learning can reduce the training dataset by up to%87.5. Also we show that QDA provides the highest difference between transfer learning and no transfer for both systems.
2.0 MOTOR IMAGERY BCI SYSTEM
MI is a process regularly used to restore physical and cognitive functions for individuals with LSPA [36], [33]. Certain regions of the brain, specifically the motor cortex, and frontal cortex which are activated due to physical movements are also activated by MI procedures. Therefore, MI could be used to induce changes in EEG which eventually could be used for BCI system design. Previous studies demonstrated that BCI systems based on MI could be efficiently performed on participants with neural disorders and that they greatly improve physical movements and rehabilitation. On the other hand, as also described above, in our previous study we showed that MI also induces changes in fTCD [20], [21]. The aim of this study is to extend our previous EEG and fTCD-based hybrid system with our novel transfer learning algorithm. The purpose is to reduce calibration requirements and training data to achieve higher or at least same performance than without transfer learning. In this chapter, we introduce the experimental setup, and signal pre processing and transfer learning methodology. The chapter also includes results and discussions.
2.1 METHOD
In this section, we introduce our experimental setup for MI BCI, pre-processing, and feature extraction methods as well as the distance measures used to determine similarities between datasets.
2.1.1 Experiment Setup
We collected EEG signals using 16 electrodes placed over frontal, central and parietal lobes at the positions Fp1, Fp2, F3, F4, Fz, Fc1, Fc2, Cz, P1, P2, C1, C2, Cp3, Cp4, P5, and P6 with the reference electrode placed over the left mastoid. The signals are amplified using a g.tec EEG system with g. USBamp. Collected data are sent from the amplifiers to a laptop via USB 2.0.
Two 2 MHz transducers of a SONARA TCD system were used to collect the fTCD data. The transducers are positioned on the left and right sides of the transtemporal window located above the zygomatic arch [26] [40]. The fTCD depth was set to the depth of the mid-point of the middle cerebral arteries (50 mm) [26] as it delivers approximately %80 of the brain with blood.
In this study, EEG and fTCD data are recording simultaneously from the participants during visualization of the motor imagery tasks. The g.USBamp is used to record EEG sig-nals and it includes 16 24-bit simultaneously sampled EEG channels. EEG data is recorded on the experiment laptop through USB connection. To record fTCD signals, we used 2 MHz SONARA TCD transducers. In our study EEG and fTCD are synchronized based on time stamps. We are looking for the available time stamps from both modalities and we syn-chronized the two signals based on these measures. The presentation software Psychtoolbox included in the EEG system sends triggers to the EEG amplifier in order to segment the EEG data. These triggers indicate the type of stimulus shown on the screen and record the time stamp corresponding to each trigger. The same triggers are used to segment the fTCD data based on software-generated time stamps available from the fTCD device.
The g.USBamp amplifier used during the experiment includes a 16 24-bit simultaneously sampled channels. This device is equipped with an internal digital signal that process the received signal by filtering and sampling rate up to 38.4 kHz. These data were digitized using a sampling rate of 256 samples/s [21].
16-channel EEG and two-channels fTCD data were recorded simultaneously (under Uni-versity of Pittsburgh approved IRB) from 10 healthy right-handed subjects with ages ranging from 23 to 32 years old. Participants were seated at 1 m away from the computer and are
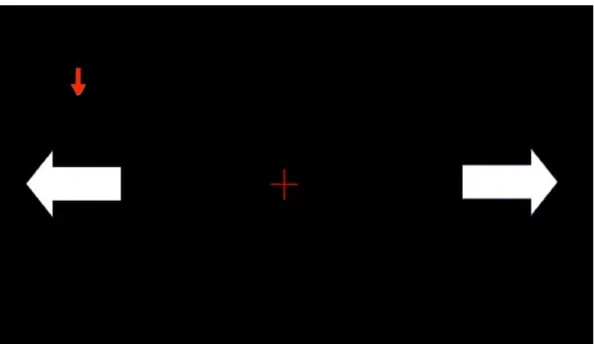
Figure 2.1: Stimulus presentation for the hybrid BCI system. During one trial, the arrow indicates the task the user has to mentally performs.
asked to keep their attention on the screen. During data acquisition, each participant is ob-serving visual icons corresponding to right and left arm MI mental tasks as well as baseline. In particular, as shown in Figure2.1, left arrow represents left arm MI and right arrow rep-resents right arm MI while the fixation cross in the middle reprep-resents the baseline. During each trial of 10-s duration, a vertical red arrow selects randomly one of the 3 tasks and the participant is instructed to mentally perform the task selected by the vertical arrow.
Each participant have signed a consent form and attended one data collection session of 25-min duration. 150 trials are randomly presented per user in total. Assuming equal probability, we approximately have 50 trials per task. Considering preparation and calibra-tion time, the whole experiment lasts for approximately 1 hour and 15 minutes. From the three imagery tasks presented during the experiment, we formulate three binary classifica-tion problems for our MI BCI system including right arm MI vs left arm MI (RA vs LA), right arm MI vs baseline (RA vs BL) and left arm MI vs baseline (LA vs BL).
We decide to focus on three different binary classification problems instead of three class classifications to demonstrate the feasibility of the transfer learning for this hybrid BCI system. We show that we can achieve significant reduction in the required calibration data for these binary classification problems. Also binary systems are more preferable in real-time usage by the target population, individuals with LSPA. This is mainly because binary selection systems have lower cognitive load.
2.1.2 Pre-processing and Features Extraction
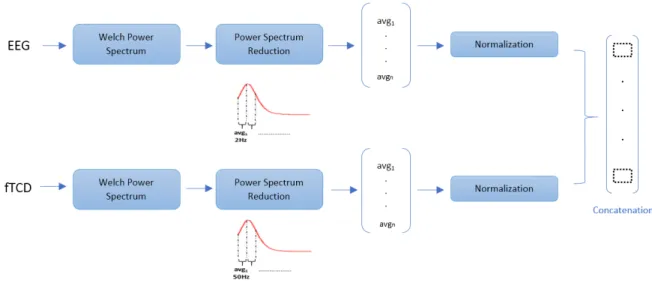
Figure 2.2: Diagram showing features extraction and selection. The two feature vectors are normalized using min max normalization and are concatenated into one single features vector.
EEG and fTCD data of each trial were segmented. Features corresponding to each trial included power spectrum raw values calculated using Welch method [46]. We return the power spectral density estimate of the raw values of each channel independently using Welch’s overlapped segment averaging estimator. Instead of considering the power spectrum values over all frequency bins, the number of features is reduced by taking the average power over a small range of frequencies. A specific window size in Hz is defined for EEG and fTCD separately and the average power over this width was considered as one feature. More
specifically, the average power over each consecutive 2 Hz of the EEG data was considered as one feature while for the fTCD data, since it has a much higher bandwidth (2.5 kHz compared to 40 Hz for EEG), the average power over each consecutive 50 Hz for the fTCD data was considered as one feature. EEG and fTCD feature vectors were normalized separately across trials using min-max normalization [17].
A single features vector (EEG and fTCD feature vectors of each trial) representing each trial were obtained by concatenating the reduced power spectrums corresponding to the 16 EEG segments and to the 2 fTCD segments respectively as represented in Figure 2.2. 2.1.3 RDA Scores and Similarity Measures
To apply transfer learning across participants, similarity is measured between the dataset under test and the other datasets collected from other individuals. Various distance measures are used in this study to measure distance between two probability density functionsPandQ including KL divergence, Bhattacharyya, and Hellinger [7]. The equations of these distance measures are respectively given by equations 2.1, 2.2 and 2.3.
dK L =Ín i=1Piln Pi Qi (2.1) dB =−lnÍn i=1 √ PiQi (2.2) dH =2 q 1−Ín i=1 √ PiQi (2.3)
with n the length of the probability density functions P and Q.
Instead of measuring similarity directly using EEG and fTCD concatenated feature vec-tors, these feature vectors are reduced using RDA [14] [13] into scalar RDA scores. RDA is a commonly used method to classify objects in low-dimension to one or several groups or classes [14]. Class k are chosen such that the risk or expected loss induced by classifying an element of the observations X as k is minimized. RDA is utilized to overcome problems
induced by small sample sizes such as ill-posed and poorly-posed problems. Ill-posed and poorly-posed problems respectively define a situation where the number of parameters is
greater than the sample size or comparable to the number of observations. In this case, a new approach is defined to propose an alternative to linear and quadratic discriminant analysis. Regularized function aims to solve those problems by regulating two new param-eters and by introducing a bias variance tradeoff that improve estimations of paramparam-eters Σ and µ [14], [6]. RDA is the extension of QDA [13]. The function used for RDA also called discriminant score for the kth class is given by equation2.4.
dk(x)=(X−X¯k)TΣˆ−k1(λ, γ)(X−X¯k)+log|ˆΣk(λ, γ)| −2 logπ(k) (2.4) where λ is the degree of shrinkage, 0 ≤ λ ≤ 1 and γ is the regularization parameter, 0 ≤ γ ≤ 1 [13], X a set of measurements, π(k) unconditional prior probability of ob-serving a class k member. dk(x)+ 2 logπ(k) corresponds to the discriminant function and (X −X¯k)TΣˆ−k1(λ, γ)(X −X¯k) is known as the Mahalanobis distance. Σˆk is the regularized covariance matrices of class k and is defined as shown in equation 2.5.
ˆ
Σk(λ, γ)= (1−γ) ∗ˆΣk(λ)+γ∗
trΣˆk(λ)
p I (2.5)
The expression of ˆΣk(λ) is given in equation 2.6.
ˆ
Σk(λ)=(1−λ)ˆΣk+λˆΣ (2.6) ˆ
Σ is the common class covariance matrix. Equation 2.4 leads to the following classification rule
dˆk(X) = min
1≤k≤Kdk(X) (2.7) As values of λ and γ are not known in advance, we have to estimate them. λ and
γ are positive values between 0 and 1. In this study, 10-fold cross-validation is used to optimize the RDA parameters λ and γ within a range 0.1 to 1 with a step of 0.1 such that the area under the receiver operating characteristic curve is maximized. The precision of 10−1 for the definition of the parameters is precise enough to return high accuracy while it limits computation time of the process. This method is performed for the three binary classifications defined for the motor imagery BCI system. Using the RDA scores of the trials
corresponding to each class, the conditional pdfs are estimated. Rbf kernel is used for KDE and the kernel bandwidth is estimated based on Silverman’s rule of thumb.
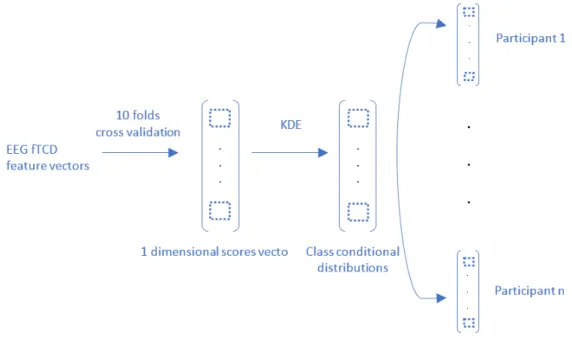
Figure 2.3: Diagram representing the process to obtain the distance between the dataset of one participant and the others.
The similarities between the pdf of the dataset under test and the pdfs of the other datasets are computed. The method is shown in Figure 2.3. To avoid overfitting and to maximize the accuracy, five datasets which are most similar to the dataset under test are chosen for transfer learning and will be used to train the three different classifiers LDA, QDA and SVM. In the results section, we compare the performances obtained from the classifiers and for the different distance measures.
2.1.4 Classification
Three classification tasks per system were formulated as describe above to test the perfor-mance of the hybrid BCI using the suggested transfer learning algorithm. Linear SVM, LDA,
and QDA were used to perform the classification tasks and performance measures obtained from each classifier were compared.
Support Vector Machine (SVM) is a supervised learning method used for classification [16]. Like all supervised learning methods, it needs training data to give accurate predictions and to build a decision model. SVM looks for the function that defines the optimal separating hyperplane also called decision boundary. The decision boundary is an accurate division of classes that maximizes the margin between the data. Different kernels can be utilized to define the SVM function in case the classes are not linearly separable. For BCI applications the basic linear SVM is usually defined as the best choice as BCI is intended to be used for real time applications. Therefore, we specify a linear kernel function as a decision function. Discriminant analysis is performed to assign objects to a specific class by minimizing a discriminant function. Considering that each element comes from a multivariate normal distribution, the discriminant function is derived from the probability for one object to belong to a class also called posterior distribution. LDA is used when only one class covariance matrices Σ is defined and is similar to all classes. LDA finds a one dimensional subspace to find a linear separating plane. QDA is used when one covariance matrix per class is defined and is a generalized use of LDA [14], [13]. This function is more adapted for a great diversity of points. The surface separating the two classes is not linear but can be either parabola or hyperbola [5].
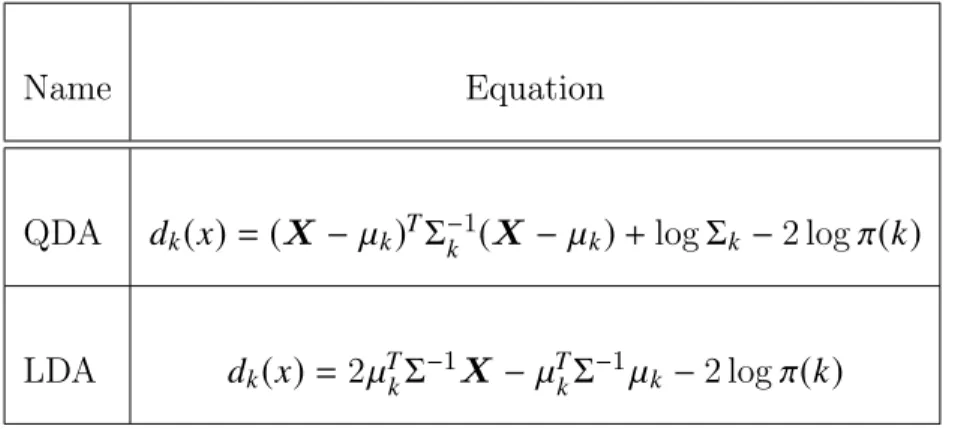
Given a set of observationsX, the equations of discriminant functions of QDA and LDA
classifiers are given in Table 2.1. LDA is obtained by setting Σk = Σ in QDA. The terms logΣk and xTΣ−1x is left out of the equation as Σk is independent from the class. and it does not affect the classification. µk and Σk denote the class k population mean vector and covariance matrix [6].
2.2 TRANSFER LEARNING ALGORITHM
In this paper, we propose to use transfer learning to decrease the training requirements for the MI hybrid BCI and for the SSVEP hybrid BCI system. The pseudocode of the proposed
Table 2.1: Table of classification models
Name Equation
QDA dk(x)= (X− µk)TΣk−1(X −µk)+logΣk−2 logπ(k)
LDA dk(x)= 2µTkΣ−1X −µTkΣ−1µk−2 logπ(k)
Traditional machine learning trains each set of observations independently from each other and returns a classification for the corresponding labels. Transfer learning works differently as it correlates the resulting labels of all sets of observations. Figure 2.4 shows how the acquired information is used and transferred to train other related objects for transfer learning and traditional machine learning algorithm. Indeed, negative transfer of knowledge, which means transferring data that are not related to each other, affects the efficiency of the system and can reduce the performance. Transfer learning algorithm users have to decide what information can be transferred to classify one set of observations. However, the number of dataset used to train another dataset under test is limited to avoid overfitting of the classification system. Therefore, the system only consider useful information and reject data that are not compatible with the classification.
First, we explore the exact quantity of information to transfer from one participant to another. As transfer learning method identify the most related dataset to an individual data, we determined the number of dataset from1to5to use that maximizes the performance. As we want to avoid overfitting data that would affect negatively the accuracy, we have the select only the datasets that present most related information and that would return the minimum distance. Therefore, in this algorithm, for each participant, we identify five datasets from the rest of the participants with the most similar EEG and fTCD characteristics for transfer learning.
Figure 2.4: Process of transfer learning compared to traditional machine learning algorithm adopted from [41].
More specifically, we utilize the KDEs of the class conditional distributions of the scores obtained from the RDA projection of EEG and fTCD features. RDA returns one dimensional vectors of scores per participant. Assuming that N number of trials are collected from each participant, each participant’s data are separated into test set of sizet trials and training set of size N−t trials. Test and training sets are chosen to include approximately equal number of trials for each class. Then, training dataset and corresponding KDE of RDA values are used to identify five datasets (from the rest of the participants) that are most similar in a probabilistic manner to the training set of each participant as specified in Section 2.1.3. Considering different distance measures including Bhattacharyya and Hellinger distances and KL divergence, we compute the similarity between class conditional distributions acquired for one participant and the others'. Based on the results provided by the distance measure, we return five datasets corresponding to the minimum distances. Each participant’s training set is then augmented with these most similar datasets (identified from the rest of the participants) for transfer learning.
In order to analyze the effect of transfer learning for different training test sizes, t is varied to take different values. Note that for the binary classification problems that are defined above, we have N = 100. Accordinglyt is varied from 10to90resulting in minimum training size of 10samples (5 samples for each class).
Algorithm 1Pseudocode for the proposed transfer learning approach. for each binary classification problem do
for each distance measure D do
Accuracy=(); Specificity=(); Sensitivity=(); for T s= 1 : 10 // Segment length (s) do
for n= 1 : 10 // participantsdo
Ni = number of trials from classi,i =1,2; N=N1+N2;
Estimate power spectrum features;
Get RDA scores si =s1, ...,sNi for classi;
Estimate Pn(si|xi) using KDE; end
for n= 1 : 10 do
Get distance between Pn(si|xi) and Pm(si|xi) for m=1, ...,10 -n ; Select top similar 5 datasets to participant n;
T =TEn,TRn,;
TEn: testing trials for participant n; TRn: training trials for participant n; for TEn= 10 : 10 : 90 do
Train the classifier using
TRn,TRl, l ⊂ m contains indexes corresponding to top similar 5 datasets;
Test the model usingTEn;
Compute performance measures; end
end end end end
2.3 RESULTS AND DISCUSSION
In this part of the study, we discuss about the performance achieved for both systems with and without transfer. We first explain our choice to utilize Bhattacharyya as a distance measure instead of Hellinger distance or KL divergence. In the next sections we compare the results given by the different classifiers SVM, LDA, and QDA for the MI hybrid BCI.
For the 3 binary classification problems, we first analyze the reduction in training size requirements provided by three distance measures used for transfer learning (TL) compared to no transfer learning (NT) as shown in Figure2.5. In particular, we statistically compared the accuracy vectors of TL with minimum training size and NT using bigger training set sizes than TL. For TL with 10 trials, we performed one-sided Wilcoxon signed rank test [47] between the accuracy vector of TL with 10 trials and NT accuracy vectors obtained at training set sizes ranging from 20 to 90 trials. Same statistical comparison was applied for the 3 distance measures.
Using Bhattacharyya distance, at training set size of 10, it was found that the perfor-mance of TL is comparable with the perforperfor-mance of NT with 80 trials. In other words, instead of calibrating the system with 80 trials in the NT case, same or higher performance can be achieved when using TL and calibrating the system with 10 from the BCI user. This reflects a reduction in the calibration requirements by %87.50.
Using both Hellinger and KL-divergence, the performance of TL at 10 trials was sta-tistically comparable to the performance of NT with maximum of 50 training trials which reflects a maximum possible reduction in calibration requirements by %80.00. Since Bhat-tacharyya provides the best results for the reduction of training set requirements through TL, in the remaining of this paper we present the classification performances for the three binary classifications provided by this distance measures.
Considering the test set size, t = 90 trials and training size N −t = 10 trials, accuracy, sensitivity and specificity of the classification (averaged across participants) for three different classification methods are presented in Tables2.2,2.3, and2.4for RA vs. LA, RA vs. BL and LA vs. BL classification problems, respectively. During transfer learning, we also optimize the trial length for each participant and the classification results are presented for these
RA vs LA RA vs BL LA vs BL 0 0.1 0.2 0.3 0.4 0.5 0.6 0.7 0.8 Accuracy No Transfer KL divergence Bhattacharyya Hellinger
Figure 2.5: Accuracy (averaged across participants) for MI BCI provided by KL divergence, Bhattacharyya and Hellinger computed for the three binary classification problems through transfer learning.
optimum trial lengths (between 1 and 10 seconds). We observe from Tables 2.2, 2.3 and 2.4 that all classification results achieved using transfer learning (with the augmentation of the top 5 datasets identified as the most similar datasets) provide higher performance than the case without transfer learning. For classification using LDA, accuracy reaches %78.67, %76.11and%77.11for RA vs LA, RA vs BL and LA vs BL, respectively for transfer learning. For QDA,%77.67,%74.89and%76.78and for SVM%79.33,%77.11and %77accuracy were achieved for the same classification problems. It can be noted that SVM achieves higher accuracy compared to QDA and LDA. However, in terms of the accuracy difference between TL and NT, the highest difference is provided by QDA for which the classification is improved by%11.11,%5.56, and%6.11for RA vs LA, RA vs BL, and LA vs BL respectively compared to %6.23,%2.11, and %2.89 for RA vs LA, RA vs BL, and LA vs BL respectively given by LDA and %6.22, %2.44 and %2.11 given by SVM.
Considering Bhattacharyya as the distance measure to identify top 5 datasets for transfer learning, Figure 2.6 presents the accuracy values (averaged across participants) for three
10 20 30 40 50 60 70 80 90
Number of training trials
0.65 0.7 0.75 0.8 0.85 0.9 0.95 Average of accuracy No Transfer RA vs LA TL RA vs LA No Transfer RA vs BL TL RA vs BL No Transfer LA vs BL TL LA vs BL
Figure 2.6: Accuracy for MI BCI as a function of the number of trials in the training set for each binary problem computed with and without transfer.
different classification problems as the training set size changes from10to90trials. Transfer learning results are compared to the no transfer learning results for each binary classification problem. Results are evaluated using QDA. This figure focuses on the influence of the quantity of information available to train a classifier and effect of the training/calibration data size on the classification accuracy with and without transfer learning. Overall the accuracy values obtained by transfer learning are higher than the case without transfer. Using this figure, we observe that when the training size drops even down to20corresponding to t = 80 test data size, transfer learning provides between %5 to %7 improvement in the accuracy.
Table 2.2: Mean of accuracy among all participants and corresponding sensitivity and speci-ficity for RA vs LA.
Performance measures LDA QDA SVM NT TL NT TL NT TL Accuracy 0.7244 0.7867 0.6656 0.7767 0.7311 0.7933 Specificity 0.8395 0.8191 0.8023 0.7723 0.8140 0.8532 Sensitivity 0.6191 0.7512 0.5404 0.7814 0.6553 0.7279
Table 2.3: Mean of accuracy among all participants and corresponding sensitivity and speci-ficity for RA vs BL. Performance measures LDA QDA SVM NT TL NT TL NT TL Accuracy 0.74 0.7611 0.6933 0.7489 0.7467 0.7711 Specificity 0.7725 0.7980 0.7075 0.7560 0.78 0.84 Sensitivity 0.7140 0.7150 0.6820 0.74 0.72 0.6850
Table 2.4: Mean of accuracy among all participants and corresponding sensitivity and speci-ficity for LA vs BL. Performance measures LDA QDA SVM NT TL NT TL NT TL Accuracy 0.7422 0.7711 0.7067 0.7678 0.7489 0.77 Specificity 0.7975 0.8060 0.65 0.7820 0.70 0.7520 Sensitivity 0.6980 0.7275 0.7520 0.75 0.7880 0.7925
2.4 CONCLUSION
In this study, we extend our previous work on hybrid EEG-fTCD BCI employing motor imagery mental tasks. In particular, we developed a transfer learning approach with the aim of reducing the calibration requirements as well as improving the system performance. To achieve such aim, EEG and fTCD data of each trial were projected into a scalar RDA score. The scores corresponding to each class were used to learn class conditional distributions. Several distance measures including Bhattacharyya, Hellinger distances and KL divergence were used to identify similarities between class conditional distributions among the data collected from multiple participants. Performance of the proposed approach was evaluated using LDA, QDA, and SVM classifiers with RDA scores used as input features and compared in the discussion section. Experimental results show that the training set size can be reduced by up to %87.5 while achieving reasonable classification accuracy values. We demonstrate that, for all classification problems, LDA classifier achieves the best performance. Consider-ing improvement of performance usConsider-ing transfer learnConsider-ing, we show that QDA gives the highest difference between no transfer and transfer. This system is designed using specific imagery tasks obtained from motor imagery. As fTCD may not be well adapted for such system, we designed another system based on different mental tasks and we expect this system to achieve higher performance.
3.0 SSVEP HYBRID BCI SYSTEM
As the motor imagery process limited the performance of our MI-based hybrid BCI system, we developed a novel hybrid SSVEP and mental task-based hybrid BCI system [21]. This multimodal system records EEG and fTCD signals in response to flickering visual stimuli which also include instructions for mental rotation (MR) and word generation (WG). More-over there is a fixation cross that represents the baseline. This new system has been developed to extend the previous MI approach for BCI as it has been shown in previous studies that SSVEP has higher BCI performance compared to MI-based paradigms [21]. Also changes in fTCD are more significant when mental tasks are used instead of motor imagery. In this chapter, we introduce a transfer learning approach for the SSVEP and mental task-based hybrid BCI system. The first section provides in detail the process of data collection and the visual stimuli presentation designed for the hybrid system. In the result section, we discuss about global performance and compare accuracies obtained from the different classifiers and distance measures.
3.1 METHOD
For the hybrid BCI based on steady state evoked potentials (SSVEPs), a total of 11 healthy participants with 3 females and 8 males and ages ranging from 23 to 32 years old participated to one experimental session under University of Pittsburgh approved IRB. No participants presented any type of brain injury. In order to keep the participant focus on the experiment the fTCD device was placed outside the participant’s field of view so that he would not be distracted or influenced by the fTCD signals displayed on the device.
As it has been shown in previous study that fTCD can successfully distinguish MR and WG, we design the system based on MR and WG tasks. To design a high performance BCI system, both EEG and fTCD need to differentiate MR and WG. Therefore, we modify the tasks in order to induce SSVEPs in EEG. As shown in Figure 3.1, a flickering checkerboard texture is included to the letter and geometric shape so that MR and WG tasks can be differentiate from EEG. Some studies show that the flickering frequency has to be contained in the range 7 to 60 Hz. It also has to be lower than 20 Hz [44], otherwise the SSVEPs would be elicited with low amplitudes. Considering these observations, we decide to set the flickering frequency to 7 and 17 Hz for WG and MR stimuli. During data collection, we define different types of visual stimuli that are presented to the user including flickering MR, flickering WG and baseline. The left side of the screen displays randomly selected capital letters. This letter instructs the user to silently generate words starting with the same letter. On the right side, different geometric shapes appears. The user is notified to mentally rotates the corresponding pair of geometric shapes and to decide if they are mirrored or identical. These shapes are obtained from a database of 3D cubic shapes [34]. A red vertical arrow randomly selects the task to be performed as shown in Figure3.1 and indicates that task for a trial length of 10 s duration. The participant has to perform the task during the whole 10 s duration of the trial.
Each participant signed a form consent and attended one data collection session of 25-min duration. A total of 150 trials are randomly presented per user. Assuming equal probability, we approximately have 50 trials for each classification problems.
The same method of experimental setup and pre-processing introduced in Method Section 2.1of Chapter2are used to collect the EEG and fTCD data and to obtain the corresponding features. Feature vectors are normalized using min-max normalization. Moreover, an iden-tical method using KDEs on RDA scores return the similar datasets and the N−t training scores are concatenated to the individual under test. Classification performances are com-puted through the three classifiers linear SVM, LDA and QDA and will be compared in the results section of this chapter. Transfer learning algorithm shown in Algorithm 2.2 is used to transfer the knowledge from the five most similar dataset to the dataset under test and to determine the performance measures.
Figure 3.1: Stimulus presentation for our flickering MR/WG hybrid BCI system. The arrow indicates which mental task the user has to perform.
3.2 RESULTS AND DISCUSSION
For each participant, we first utilize KL divergence, and Bhattacharyya and Hellinger dis-tances to identify the datasets to be used for transfer learning for that specific participant. Through transfer learning (TL) we study the reduction in training size requirements com-pared to no transfer learning case (NT) for the above mentioned three binary classification problems and we return the corresponding performance measures. Accuracy averaged among participants is shown in Figure3.2. More specifically, we perform a one sided Wilcoxon rank test [47] between accuracy obtained with TL with a minimum size of N −t = 10 training trials and accuracy obtained with NT with a number a training trials in the range 20 to 90 trials. The same test is repeated for each size of NT. An identical statistical comparison is applied for the different distance measures.
When TL is performed with 10 trials for both systems, the statistical test shows that the performance for TL using Bhattacharyya distance is comparable to the performance for NT
at a size of 80 trials. It means that instead of running the algorithm with 80 training trials without transfer, the system gives higher or at least same performance when using only 10 training trials for TL. This reflects a reduction in the calibration requirements by %87.50.
Similar analysis shows that around 60 trials are needed for TL to obtain identical perfor-mance as NT when KL divergence and Hellinger distance are used for dataset identification for TL.
As Bhattacharyya provides the best results for the reduction of training set requirements through TL, in the remaining of this paper we present the classification performances for the three binary classifications provided through Bhattacharrya distance.
In this section, we first discuss about the performance measures obtained for the three classifiers and for all classification problems in Tables3.1,3.2, and 3.3with and without TL. Considering the best classifier, we also show the improvement achieved by transfer learning when the number of training trials is in a range N −t =10 to N−t =90trials compared to NT. Figure 3.3 presents the accuracy for all three classification problems using The results are presented for an optimal trial length Ts chosen between 1 and 10 s and are averaged among all participants.
Considering a test and a training size of t = 90 and N − t = 10 trials respectively, performance measures including accuracy, specificity, and sensitivity for the three classifiers are given in Tables 3.1, 3.2, and 3.3 with and without transfer learning for MR vs WG, MR vs BL and WG vs BL.
From these tables, we observe that all TL classification results are higher than the NT results for MR vs WG, MR vs BL, and WG vs BL classifications. Improvement achieved is at least %2.66 for MR vs BL using SVm and goes up to %9.34 for MR vs BL using QDA. LDA provides the best classification performance for MR vs BL and WG vs BL classification problems with corresponding accuracies of %82.22 and %75.89 respectively. On the other hand, QDA provides slightly higher performance compared to LDA and SVM for the MR vs WG classification with %86.22against%85.33for LDA and%85.44. Finally, when the difference between the TL and NT cases are considered, QDA provides the highest improvement for all the classification problems with %7.22, %9.34 and %7.89 respectively for MR vs WG, MR vs BL and WG vs BL while difference of performance is %5,%4.44and
RA vs LA RA vs BL LA vs BL 0 0.2 0.4 0.6 0.8 1 Accuracy No Transfer KL divergence Bhattacharyya Hellinger
Figure 3.2: Accuracy (averaged across participants) for SSVEP BCI provided by KL diver-gence, Bhattacharyya and Hellinger computed for the three binary classification problems through transfer learning.
%3.89 using LDA and %3.66, %2.66 and %4 using SVM for the same tasks. Therefore, we compare results obtained from TL and NT when QDA classifier is used as a classifier.
Figure 3.3 shows the accuracy (optimal accuracy averaged across individuals) obtained for a number of training trials from 10 to 90 for MR vs WG, MR vs BL, and WG vs BL for TL and NT cases. The results aim to show the influence of the quantity of information available to train a classifier as well as the effect of the calibration data size on the classification accuracy with and without transfer. For each size of training set, performance obtained with TL is greater than without transfer for all classification problems.
10 20 30 40 50 60 70 80 90
Number of training trials
0.65 0.7 0.75 0.8 0.85 0.9 0.95 1 Average of accuracy No Transfer MR vs WG TL MR vs WG No Transfer MR vs BL TL MR vs BL No Transfer WG vs BL TL WG vs BL
Figure 3.3: Accuracy for the SSVEP BCI as a function of the number of trials in the training set for each binary problem with and without transfer.
Table 3.1: Mean of accuracy among all participants and corresponding sensitivity and speci-ficity for WG vs MR. Performance measures LDA QDA SVM NT TL NT TL NT TL Accuracy 0.8033 0.8533 0.79 0.8622 0.8178 0.8544 Specificity 0.8698 0.8298 0.8419 0.8234 0.8930 0.8362 Sensitivity 0.7426 0.8791 0.7426 0.9047 0.7489 0.8744
Table 3.2: Mean of accuracy among all participants and corresponding sensitivity and speci-ficity for MR vs BL. Performance measures LDA QDA SVM NT TL NT TL NT TL Accuracy 0.7778 0.8222 0.7233 0.8167 0.7856 0.8122 Specificity 0.7750 0.8720 0.74 0.8580 0.7550 0.86 Sensitivity 0.78 0.76 0.71 0.7650 0.81 0.7525
Table 3.3: Mean of accuracy among all participants and corresponding sensitivity and speci-ficity for WG vs BL. Performance measures LDA QDA SVM NT TL NT TL NT TL Accuracy 0.72 0.7589 0.66 0.7389 0.7111 0.7511 Specificity 0.6550 0.8120 0.50 0.7820 0.6175 0.8140 Sensitivity 0.7720 0.6925 0.7880 0.6850 0.7860 0.6725 3.3 CONCLUSION
With the aim of reducing the BCI calibration requirements, we developed a transfer learning algorithm for our novel hybrid BCI system that exploits data acquired from EEG (based on SSVEP) and fTCD (based on WG and MR) modalities simultaneously to infer user intent. To measure similarity across subjects, for every individual, each trial was projected into a scalar RDA score. These scores were used to estimate a class conditional distribution per each mental task. Similarities between class conditional distributions were measured across subjects using 3 different distance measures. It was found that the proposed transfer learning approach not only reduces the calibration requirements but also improves performance of all classifications problems including MR vs WG, MR vs BL, and WG vs BL. In particular, we show that LDA obtained the highest possible performance compared to SVM and QDA. In term of the difference between accuracy achieved using transfer learning and accuracy obtained without transfer learning, the highest difference was provided by QDA. In terms of calibration requirements, experimental results indicate that the size of the training set can be reduced by up to%87.5using Bhattacharyya distance as a similarity measure.
4.0 CONCLUSIONS AND FUTURE DIRECTIONS
We developed a novel transfer learning approach that can be performed for two BCI systems based and trained on different mental tasks with the purpose to reduce the calibration requirements and to overcome the lack of available training data. Both systems are based on two modalities and utilize data recorded from EEG and fTCD simultaneously. The first system uses motor imagery tasks including right arm MI and left arm MI such that the user can imagine performing identical movements and it has been shown that brain regions corresponding to these movements enable and activate during the experiment. Multiple studies have shown the efficiency of SSVEPs to design a BCI system and achieve higher performance than MI based BCI. Therefore, we extend the MI based BCI and formulate two different tasks including mental rotation and word generation. The tasks are modified with adapted flickering frequency and checkerboard pattern so that both EEG and fTCD can successfully distinguish the mental tasks. From our final results, it has been demonstrated that transfer learning reduce calibration requirements by up to %87.5 for the two systems and improves performance for the three classification problems formulated for each system. Distance measure that determine similarity between datasets was selected by Wilcoxon rank test. Using Bhattacharyya as a distance measure for both systems, we have shown that instead of running the algorithm with80training trials without transfer learning, we achieve higher or at least same performance with transfer of knowledge. Considering the choice of classifier, LDA gives higher performance while QDA returns the highest difference between transfer and no transfer for each classification problems. Therefore, to design a successful BCI systems QDA is preferable for systems that present low performance and for which we want to maximize the improvement using our novel algorithm. This work can be extend based on one of our previous study that increased performance by exploring other analysis techniques
for EEG and fTCD signals. The current work identifies the similarities and therefore uses exploitation of the knowledge from the data. Our future work will combine exploitation and exploration to improve the generalization properties of the proposed multimodal hybrid system. We will also focus on three class classification.
BIBLIOGRAPHY
[1] S. Amiri, R. Fazel-Rezai, and V. Asadpour. A review of hybrid brain-computer interface systems. Advances in Human-Computer Interaction, 2013:1, 2013.
[2] K. K. Ang and C. Guan. Eeg-based strategies to detect motor imagery for control and rehabilitation. IEEE Transactions on Neural Systems and Rehabilitation Engineering, 25(4):392–401, 2017.
[3] K. K. Ang, C. Guan, K. S. G. Chua, B. T. Ang, C. Kuah, C. Wang, K. S. Phua, Z. Y. Chin, and H. Zhang. Clinical study of neurorehabilitation in stroke using eeg-based motor imagery brain-computer interface with robotic feedback. In Engineering in Medicine and Biology Society (EMBC), 2010 Annual International Conference of the IEEE, pages 5549–5552. IEEE, 2010.
[4] K. K. Ang, C. Guan, K. S. G. Chua, B. T. Ang, C. W. K. Kuah, C. Wang, K. S. Phua, Z. Y. Chin, and H. Zhang. A large clinical study on the ability of stroke patients to use an eeg-based motor imagery brain-computer interface. Clinical EEG and Neuroscience, 42(4):253–258, 2011.
[5] S. Bhattacharyya, A. Khasnobish, S. Chatterjee, A. Konar, and D. Tibarewala. Perfor-mance analysis of lda, qda and knn algorithms in left-right limb movement classifica-tion from eeg data. In Systems in Medicine and Biology (ICSMB), 2010 Internaclassifica-tional Conference on, pages 126–131. IEEE, 2010.
[6] D. Birkel. Regularized discriminant analysis, 2006.
[7] S.-H. Cha. Comprehensive survey on distance/similarity measures between probability density functions, 2007.
[8] X. Chen, Y. Wang, M. Nakanishi, X. Gao, T.-P. Jung, and S. Gao. High-speed spelling with a noninvasive brain–computer interface. Proceedings of the national academy of sciences, 112(44):E6058–E6067, 2015.
[9] S.-C. Chin. Knowledge transfer: what, how, and why. 2013.
[10] T. Davis, H. Wark, D. Hutchinson, D. Warren, K. OâĂŹNeill, T. Scheinblum, G. Clark, R. Normann, and B. Greger. Restoring motor control and sensory feedback in people
with upper extremity amputations using arrays of 96 microelectrodes implanted in the median and ulnar nerves. Journal of neural engineering, 13(3):036001, 2016.
[11] J. Faller, B. Z. Allison, C. Brunner, R. Scherer, D. Schmalstieg, G. Pfurtscheller, and C. Neuper. A feasibility study on ssvep-based interaction with motivating and immersive virtual and augmented reality. arXiv preprint arXiv:1701.03981, 2017.
[12] S. Fazli, S. DÃďhne, W. Samek, F. Bieçmann, and K. MÃijller. Learning from more than one data source: Data fusion techniques for sensorimotor rhythm-based brainâĂŞ-computer interfaces. Proceedings of the IEEE, 103(6):891–906, June 2015. ISSN 0018-9219. doi: 10.1109/JPROC.2015.2413993.
[13] J. Friedman, T. Hastie, and R. Tibshirani. The elements of statistical learning, volume 1. Springer series in statistics New York, NY, USA:, 2001.
[14] J. H. Friedman. Regularized discriminant analysis. Journal of the American statistical association, 84(405):165–175, 1989.
[15] G. Garcia. High frequency ssveps for bci applications. In Computer-Human Interaction. Citeseer, 2008.
[16] C.-W. Hsu and C.-J. Lin. A comparison of methods for multiclass support vector ma-chines. IEEE transactions on Neural Networks, 13(2):415–425, 2002.
[17] Y. K. Jain and S. K. Bhandare. Min max normalization based data perturbation method for privacy protection. International Journal of Computer & Communication Technology, 2(8):45–50, 2011.
[18] A. Jansen, A. Flöel, M. Deppe, J. van Randenborgh, B. Dräger, M. Kanowski, and S. Knecht. Determining the hemispheric dominance of spatial attention: a comparison between ftcd and fmri. Human Brain Mapping, 23(3):168–180, 2004.
[19] M. Jeannerod. Mental imagery in the motor context. Neuropsychologia, 33(11):1419– 1432, 1995.
[20] A. Khalaf, M. Sybeldon, E. Sejdic, and M. Akcakaya. An eeg and ftcd based bci for control. In Signals, Systems and Computers, 2016 50th Asilomar Conference on, pages 1285–1289. IEEE, 2016.
[21] A. Khalaf, E. Sejdic, and M. Akcakaya. Towards optimal visual presentation design for hybrid eegâĂŤftcd brain–computer interfaces. Journal of neural engineering, 15(5): 056019, 2018.
[22] A. Khalaf, M. Sybeldon, E. Sejdic, and M. Akcakaya. A brain-computer interface based on functional transcranial doppler ultrasound using wavelet transform and support vec-tor machines. Journal of neuroscience methods, 293:174–182, 2018.
[23] R. Leeb, H. Sagha, R. Chavarriaga, et al. Multimodal fusion of muscle and brain signals for a hybrid-bci. In Engineering in Medicine and Biology Society (EMBC), 2010 Annual International Conference of the IEEE, pages 4343–4346. IEEE, 2010.
[24] Z. Lin, C. Zhang, W. Wu, and X. Gao. Frequency recognition based on canonical correlation analysis for ssvep-based bcis. IEEE transactions on biomedical engineering, 53(12):2610–2614, 2006.
[25] B.-K. Min, M. J. Marzelli, and S.-S. Yoo. Neuroimaging-based approaches in the brain– computer interface. Trends in biotechnology, 28(11):552–560, 2010.
[26] L. H. Monsein, A. Y. Razumovsky, S. J. Ackerman, H. J. Nauta, and D. F. Hanley. Val-idation of transcranial doppler ultrasound with a stereotactic neurosurgical technique. Journal of neurosurgery, 82(6):972–975, 1995.
[27] G. Müller-Putz, R. Leeb, M. Tangermann, J. Höhne, A. Kübler, F. Cincotti, D. Mattia, R. Rupp, K.-R. Müller, and J. d. R. Millán. Towards noninvasive hybrid brain–computer interfaces: framework, practice, clinical application, and beyond. Proceedings of the IEEE, 103(6):926–943, 2015.
[28] G. R. Muller-Putz and G. Pfurtscheller. Control of an electrical prosthesis with an ssvep-based bci. IEEE Transactions on Biomedical Engineering, 55(1):361–364, 2008. [29] A. J. Myrden, A. Kushki, E. Sejdić, A.-M. Guerguerian, and T. Chau. A brain-computer
interface based on bilateral transcranial doppler ultrasound. PLoS One, 6(9):e24170, 2011.
[30] M. Nakanishi, Y. Wang, X. Chen, Y.-T. Wang, X. Gao, and T.-P. Jung. Enhancing detection of ssveps for a high-speed brain speller using task-related component analysis. IEEE Transactions on Biomedical Engineering, 65(1):104–112, 2018.
[31] N. Naseer and K.-S. Hong. fnirs-based brain-computer interfaces: a review. Frontiers in human neuroscience, 9:3, 2015.
[32] S. J. Pan, Q. Yang, et al. A survey on transfer learning. IEEE Transactions on knowledge and data engineering, 22(10):1345–1359, 2010.
[33] L. M. Parsons, P. T. Fox, J. H. Downs, T. Glass, T. B. Hirsch, C. C. Martin, P. A. Jer-abek, and J. L. Lancaster. Use of implicit motor imagery for visual shape discrimination as revealed by pet. Nature, 375(6526):54, 1995.
[34] M. Peters and C. Battista. Applications of mental rotation figures of the shepard and metzler type and description of a mental rotation stimulus library. Brain and cognition, 66(3):260–264, 2008.
[35] G. Pfurtscheller and C. Neuper. Motor imagery activates primary sensorimotor area in humans. Neuroscience letters, 239(2-3):65–68, 1997.
[36] C. A. Porro, M. P. Francescato, V. Cettolo, M. E. Diamond, P. Baraldi, C. Zuiani, M. Bazzocchi, and P. E. Di Prampero. Primary motor and sensory cortex activation during motor performance and motor imagery: a functional magnetic resonance imaging study. Journal of Neuroscience, 16(23):7688–7698, 1996.
[37] G. Prasad, P. Herman, D. Coyle, S. McDonough, and J. Crosbie. Applying a brain-computer interface to support motor imagery practice in people with stroke for upper limb recovery: a feasibility study. Journal of neuroengineering and rehabilitation, 7(1): 60, 2010.
[38] S. Qiu, Z. Li, W. He, L. Zhang, C. Yang, and C.-Y. Su. Brain-machine interface and visual compressive sensing-based teleoperation control of an exoskeleton robot. IEEE Trans. Fuzzy Systems, 25(1):58–69, 2017.
[39] A. Schlögl, F. Lee, H. Bischof, and G. Pfurtscheller. Characterization of four-class motor imagery eeg data for the bci-competition 2005. Journal of neural engineering, 2(4):L14, 2005.
[40] N. Stroobant and G. Vingerhoets. Transcranial doppler ultrasonography monitor-ing of cerebral hemodynamics durmonitor-ing performance of cognitive tasks: a review. Neuropsychology review, 10(4):213–231, 2000.
[41] M. Suzuki, H. Sato, S. Oyama, and M. Kurihara. Transfer learning based on the ob-servation probability of each attribute. In Systems, Man and Cybernetics (SMC), 2014 IEEE International Conference on, pages 3627–3631. IEEE, 2014.
[42] L. Torrey and J. Shavlik. Transfer learning. In Handbook of Research on Machine Learning Applications and Trends: Algorithms, Methods, and Techniques, pages 242– 264. IGI Global, 2010.
[43] A. Vallabhaneni, T. Wang, and B. He. BrainâĂŤcomputer interface. In Neural engineering, pages 85–121. Springer, 2005.
[44] M. I. Vanegas, A. Blangero, and S. P. Kelly. Exploiting individual primary visual cortex geometry to boost steady state visual evoked potentials. Journal of neural engineering, 10(3):036003, 2013.
[45] M. Wang, I. Daly, B. Z. Allison, J. Jin, Y. Zhang, L. Chen, and X. Wang. A new hybrid bci paradigm based on p300 and ssvep. Journal of neuroscience methods, 244:16–25, 2015.
[46] P. Welch. The use of fast fourier transform for the estimation of power spectra: a method based on time averaging over short, modified periodograms. IEEE Transactions on audio and electroacoustics, 15(2):70–73, 1967.
[47] R. F. Woolson. Wilcoxon Signed-Rank Test, pages 1–3. American Cancer Society, 2008. ISBN 9780471462422. doi: 10.1002/9780471462422.eoct979. URL https:// onlinelibrary.wiley.com/doi/abs/10.1002/9780471462422.eoct979.
[48] R. Zhang, Y. Li, Y. Yan, H. Zhang, S. Wu, T. Yu, and Z. Gu. Control of a wheelchair in an indoor environment based on a brain–computer interface and automated nav-igation. IEEE transactions on neural systems and rehabilitation engineering, 24(1): 128–139, 2016.
[1] S. Amiri, R. Fazel-Rezai, and V. Asadpour. A review of hybrid brain-computer interface systems. Advances in Human-Computer Interaction, 2013:1, 2013.
[2] K. K. Ang and C. Guan. Eeg-based strategies to detect motor imagery for control and rehabilitation. IEEE Transactions on Neural Systems and Rehabilitation Engineering, 25(4):392–401, 2017.
[3] K. K. Ang, C. Guan, K. S. G. Chua, B. T. Ang, C. Kuah, C. Wang, K. S. Phua, Z. Y. Chin, and H. Zhang. Clinical study of neurorehabilitation in stroke using eeg-based motor imagery brain-computer interface with robotic feedback. In Engineering in Medicine and Biology Society (EMBC), 2010 Annual International Conference of the IEEE, pages 5549–5552. IEEE, 2010.
[4] K. K. Ang, C. Guan, K. S. G. Chua, B. T. Ang, C. W. K. Kuah, C. Wang, K. S. Phua, Z. Y. Chin, and H. Zhang. A large clinical study on the ability of stroke patients to use an eeg-based motor imagery brain-computer interface. Clinical EEG and Neuroscience, 42(4):253–258, 2011.
[5] S. Bhattacharyya, A. Khasnobish, S. Chatterjee, A. Konar, and D. Tibarewala. Perfor-mance analysis of lda, qda and knn algorithms in left-right limb movement classifica-tion from eeg data. In Systems in Medicine and Biology (ICSMB), 2010 Internaclassifica-tional Conference on, pages 126–131. IEEE, 2010.
[6] D. Birkel. Regularized discriminant analysis, 2006.
[7] S.-H. Cha. Comprehensive survey on distance/similarity measures between probability density functions, 2007.
[8] X. Chen, Y. Wang, M. Nakanishi, X. Gao, T.-P. Jung, and S. Gao. High-speed spelling with a noninvasive brain–computer interface. Proceedings of the national academy of sciences, 112(44):E6058–E6067, 2015.
[9] S.-C. Chin. Knowledge transfer: what, how, and why. 2013.
[10] T. Davis, H. Wark, D. Hutchinson, D. Warren, K. OâĂŹNeill, T. Scheinblum, G. Clark, R. Normann, and B. Greger. Restoring motor control and sensory feedback in people with upper extremity amputations using arrays of 96 microelectrodes implanted in the median and ulnar nerves. Journal of neural engineering, 13(3):036001, 2016.
[11] J. Faller, B. Z. Allison, C. Brunner, R. Scherer, D. Schmalstieg, G. Pfurtscheller, and C. Neuper. A feasibility study on ssvep-based interaction with motivating and immersive virtual and augmented reality. arXiv preprint arXiv:1701.03981, 2017.
[12] S. Fazli, S. DÃďhne, W. Samek, F. Bieçmann, and K. MÃijller. Learning from more than one data source: Data fusion techniques for sensorimotor rhythm-based brainâĂŞ-computer interfaces. Proceedings of the IEEE, 103(6):891–906, June 2015. ISSN 0018-9219. doi: 10.1109/JPROC.2015.2413993.
[13] J. Friedman, T. Hastie, and R. Tibshirani. The elements of statistical learning, volume 1. Springer series in statistics New York, NY, USA:, 2001.
[14] J. H. Friedman. Regularized discriminant analysis. Journal of the American statistical association, 84(405):165–175, 1989.
[15] G. Garcia. High frequency ssveps for bci applications. In Computer-Human Interaction. Citeseer, 2008.
[16] C.-W. Hsu and C.-J. Lin. A comparison of methods for multiclass support vector ma-chines. IEEE transactions on Neural Networks, 13(2):415–425, 2002.
[17] Y. K. Jain and S. K. Bhandare. Min max normalization based data perturbation method for privacy protection. International Journal of Computer & Communication Technology, 2(8):45–50, 2011.
[18] A. Jansen, A. Flöel, M. Deppe, J. van Randenborgh, B. Dräger, M. Kanowski, and S. Knecht. Determining the hemispheric dominance of spatial attention: a comparison between ftcd and fmri. Human Brain Mapping, 23(3):168–180, 2004.
[19] M. Jeannerod. Mental imagery in the motor context. Neuropsychologia, 33(11):1419– 1432, 1995.
[20] A. Khalaf, M. Sybeldon, E. Sejdic, and M. Akcakaya. An eeg and ftcd based bci for control. In Signals, Systems and Computers, 2016 50th Asilomar Conference on, pages 1285–1289. IEEE, 2016.
[21] A. Khalaf, E. Sejdic, and M. Akcakaya. Towards optimal visual presentation design for hybrid eegâĂŤftcd brain–computer interfaces. Journal of neural engineering, 15(5): 056019, 2018.
[22] A. Khalaf, M. Sybeldon, E. Sejdic, and M. Akcakaya. A brain-computer interface based on functional transcranial doppler ultrasound using wavelet transform and support vec-tor machines. Journal of neuroscience methods, 293:174–182, 2018.
[23] R. Leeb, H. Sagha, R. Chavarriaga, et al. Multimodal fusion of muscle and brain signals for a hybrid-bci. In Engineering in Medicine and Biology Society (EMBC), 2010 Annual International Conference of the IEEE, pages 4343–4346. IEEE, 2010.
[24] Z. Lin, C. Zhang, W. Wu, and X. Gao. Frequency recognition based on canonical correlation analysis for ssvep-based bcis. IEEE transactions on biomedical engineering, 53(12):2610–2614, 2006.
[25] B.-K. Min, M. J. Marzelli, and S.-S. Yoo. Neuroimaging-based approaches in the brain– computer interface. Trends in biotechnology, 28(11):552–560, 2010.
[26] L. H. Monsein, A. Y. Razumovsky, S. J. Ackerman, H. J. Nauta, and D. F. Hanley. Val-idation of transcranial doppler ultrasound with a stereotactic neurosurgical technique. Journal of neurosurgery, 82(6):972–975, 1995.
[27] G. Müller-Putz, R. Leeb, M. Tangermann, J. Höhne, A. Kübler, F. Cincotti, D. Mattia, R. Rupp, K.-R. Müller, and J. d. R. Millán. Towards noninvasive hybrid brain–computer interfaces: framework, practice, clinical application, and beyond. Proceedings of the IEEE, 103(6):926–943, 2015.
[28] G. R. Muller-Putz and G. Pfurtscheller. Control of an electrical prosthesis with an ssvep-based bci. IEEE Transactions on Biomedical Engineering, 55(1):361–364, 2008. [29] A. J. Myrden, A. Kushki, E. Sejdić, A.-M. Guerguerian, and T. Chau. A brain-computer
interface based on bilateral transcranial doppler ultrasound. PLoS One, 6(9):e24170, 2011.
[30] M. Nakanishi, Y. Wang, X. Chen, Y.-T. Wang, X. Gao, and T.-P. Jung. Enhancing detection of ssveps for a high-speed brain speller using task-related component analysis. IEEE Transactions on Biomedical Engineering, 65(1):104–112, 2018.
[31] N. Naseer and K.-S. Hong. fnirs-based brain-computer interfaces: a review. Frontiers in human neuroscience, 9:3, 2015.
[32] S. J. Pan, Q. Yang, et al. A survey on transfer learning. IEEE Transactions on knowledge and data engineering, 22(10):1345–1359, 2010.
[33] L. M. Parsons, P. T. Fox, J. H. Downs, T. Glass, T. B. Hirsch, C. C. Martin, P. A. Jer-abek, and J. L. Lancaster. Use of implicit motor imagery for visual shape discrimination as revealed by pet. Nature, 375(6526):54, 1995.
[34] M. Peters and C. Battista. Applications of mental rotation figures of the shepard and metzler type and description of a mental rotation stimulus library. Brain and cognition, 66(3):260–264, 2008.
[35] G. Pfurtscheller and C. Neuper. Motor imagery activates primary sensorimotor area in humans. Neuroscience letters, 239(2-3):65–68, 1997.
[36] C. A. Porro, M. P. Francescato, V. Cettolo, M. E. Diamond, P. Baraldi, C. Zuiani, M. Bazzocchi, and P. E. Di Prampero. Primary motor and sensory cortex activation during motor performance and motor imagery: a functional magnetic resonance imaging study. Journal of Neuroscience, 16(23):7688–7698, 1996.
![Figure 2.4: Process of transfer learning compared to traditional machine learning algorithm adopted from [41].](https://thumb-us.123doks.com/thumbv2/123dok_us/532276.2562754/24.918.174.744.139.424/figure-process-transfer-learning-compared-traditional-learning-algorithm.webp)