MULTIPLE-CUTOFF REGRESSION DISCONTINUITY DESIGNS IN PROGRAM EVALUATION: A COMPARISON OF TWO ESTIMATION METHODS
by
HYEONJIN YOON
A DISSERTATION
Presented to the Department of Educational Methodology, Policy, and Leadership and the Graduate School of the University of Oregon
in partial fulfillment of the requirements for the degree of
Doctor of Philosophy September 2018
DISSERTATION APPROVAL PAGE Student: HyeonJin Yoon
Title: Multiple-cutoff Regression Discontinuity Designs in Program Evaluation: A Comparison of Two Estimation Methods
This dissertation has been accepted and approved in partial fulfillment of the requirements for the Doctor of Philosophy degree in the Department of Educational Methodology, Policy, and Leadership by:
Keith Zvoch Chairperson
Gina Biancarosa Core Member
Keith Smolkowski Core Member
John R. Seeley Institutional Representative and
Janet Woodruff-Borden Vice Provost and Dean of the Graduate School
Original approval signatures are on file with the University of Oregon Graduate School. Degree awarded September 2018
© 2018 HyeonJin Yoon
DISSERTATION ABSTRACT HyeonJin Yoon
Doctor of Philosophy
Department of Educational Methodology, Policy, and Leadership September 2018
Title: Multiple-cutoff Regression Discontinuity Designs in Program Evaluation: A Comparison of Two Estimation Methods
In basic regression discontinuity (RD) designs, causal inference is limited to the local area near a single cutoff. To strengthen the generality of the RD treatment estimate, a design with multiple cutoffs along the assignment variable continuum can be applied. The availability of multiple cutoffs allows estimation of a pooled average treatment effect across cutoffs and/or individual estimates at each cutoff location, allowing for the
possibility of heterogeneous treatment effects. The purpose of this study is to (a) demonstrate the application of two treatment effect estimation methods (i.e., a
conventional pooling method and a multilevel pooling method) for the multiple-cutoff RD (MCRD) designs using Tier 2 kindergarten math intervention data (ROOTS), (b) examine the extent to which the two methods yield unbiased and precise estimates comparable to those from the randomized controlled trial (RCT) design, and (c)
investigate the moderating role of a classroom characteristic (i.e., classroom cut-point) on the size of the ROOTS intervention effect.
Math intervention data were collected from 2012 to 2015 to evaluate the impact of a small-group (Tier 2) kindergarten mathematics intervention. The analytic sample included 1,900 kindergarten students from the four school districts in Oregon and from
the two districts in Boston, Massachusetts. The intervention effect was estimated using a conventional pooling method and a multilevel pooling method. The bias and power of the resulting MCRD estimates were compared with an RCT benchmark. In addition,
treatment effect variability was predicted by the cut-point used to screen treated students in each classroom.
Results showed that treatment students scored higher on the posttest outcome than control students at the centered cutoff. All of the MCRD methods produced unbiased treatment effect estimates comparable to a benchmark RCT estimate; however, the power in the MCRD design was lower than in the RCT, regardless of the estimation method. The cut-point used to screen students into the treatment condition moderated the
treatment effect, with a greater treatment effect observed in the classrooms with a larger cutoff value. Implications for program evaluation design theory and practice are
CURRICULUM VITAE NAME OF AUTHOR: HyeonJin Yoon
GRADUATE AND UNDERGRADUATE SCHOOLS ATTENDED: University of Oregon, Eugene, OR
Hanyang University, Seoul, Republic of Korea
Hankuk University of Foreign Studies, Seoul, Republic of Korea DEGREES AWARDED:
Doctor of Philosophy, Educational Leadership, 2018, University of Oregon Specialization: Quantitative Research Methods
Master of Arts, Education, 2012, Hanyang University
Bachelor of Arts, English and American Literature, 2009, Hankuk University of Foreign Studies
AREAS OF SPECIAL INTEREST: Quantitative Research Methods Program Evaluation
Measurement and Assessment
Individual differences in reading compression difficulties PROFESSIONAL EXPERIENCE:
Research Assistant, Center on Teaching and Learning, 2018-Present Graduate Employee, Center on Teaching and Learning, 2014-2018 English Teacher, Gyomun Middle School, 2012-2013
GRANTS, AWARDS, AND HONORS:
College of Education Travel Award, University of Oregon, 2017 1st Place Poster Session Winner, University of Oregon, 2017 EMPL Travel Grant Award, University of Oregon, 2014-2018
Ken A. Erickson Memorial Scholarship, University of Oregon, 2015 BRICS Research Grant, Hankuk University of Foreign Studies, 2006 PUBLICATIONS:
Kucheria, P., Sohlberg., M. M., & Yoon, H., Fickas, S., & Prideaux, J. (in press). Read, Understand, Learn, & Excel (RULE): Development and feasibility of a reading comprehension measure for postsecondary learners. American Journal of Speech-Language Pathology.
Biancarosa, G., Kennedy, P., Carlson, S. E., Yoon, H., Seipel, B., Liu B., & Davison, M. (2018). Constructing subscores that add to validity: A case study of
identifying students at-risk. Educational and Psychological Measurement. doi: 10.1177/0013164418763255
Yoon, H., & Jang, H. (2012). Effects of transformational leadership from principals on elementary school teachers’ organizational citizenship behavior: Mediation effects of faculty trust in colleagues. Korean Journal of Educational
ACKNOWLEDGMENTS
This dissertation would not have been possible without the support of many people. I wish to express sincere appreciation to my advisor Dr. Keith Zvoch for his excellent assistance and guidance in the preparation of this manuscript. My thanks also go to Dr. Gina Biancarosa, who mentored me in applied research settings and provided me with tremendous opportunities, and to my committee members Drs. John Seeley and Keith Smolkowski for their invaluable feedback on my dissertation. I would also like to thank my mentors and colleagues at the Center on Teaching and Learning, particularly Drs. Sarah Carlson and Lina Shanley, who always believed in and encouraged me to keep going. I wish to thank Dr. Ben Clarke for supporting me to use the ROOTS data to
conduct my dissertation study.
In addition, I would like to express my heartfelt gratitude to the Eugene Korean catholic community, particularly Helen and Sean, who have taken care of me like a family member since I moved to Eugene. I would not have come this far without the constant support, encouragement and inspiration of my best friends Jane, Sunhi, and HyeJin; thank you, ladies. I thank my parents Won-Hee and Byung-Gu, who taught me persistence, courage, and love. I am blessed to have them in my life. Finally, I thank God for being and walking with me all the way.
This investigation was supported by the ROOTS Project (Grant R324A120304), funded by the Institute of Education Sciences, U.S. Department of Education.
TABLE OF CONTENTS
Chapter Page
I. INTRODUCTION ... 1
II. LITERATURE REVIEW ... 7
Regression Discontinuity (RD) Designs ... 7
Theoretical Framework of RD Designs ... 8
Methodological Limitations in RD Designs ... 9
Strong Reliance on the Correct Specification of the Regression Function ... 10
Low Statistical Power ... 11
Lack of Generality of Causal Inference ... 12
Comparative RD Designs ... 12
Hybrid RD Designs ... 15
Multiple-cutoff RD (MCRD) Designs ... 17
Kindergarten Math Intervention ... 24
Response to Intervention (RTI) ... 26
ROOTS ... 27
Predictors of Math Intervention Impact Variability... 28
Initial Math Skill ... 29
The Current Study ... 30
III. METHODS ... 33
Data Source ... 33
Analytic Sample ... 35
Chapter Page Classrooms ... 35 Interventionists ... 36 Students ... 36 ROOTS Intervention ... 39 Assignment Criteria ... 40 Research Design... 41 Within-study Comparison ... 43 Measures ... 45
Assessing Student Proficiency in Early Number Sense (ASPENS) ... 46
Number Sense Brief (NSB) ... 46
Stanford Early School Achievement Test 2 (SESAT 2) Mathematics ... 47
Analytic Procedure... 47
Pooled RD Treatment Effect ... 48
Model Assumptions ... 48
Average Treatment Effect at the Centered Cutoff ... 50
Multilevel RD Treatment Effect ... 53
RCT Treatment Effect... 55
Within-study Comparison ... 56
Exploring the Predictors of Treatment Impact Heterogeneity ... 58
IV. RESULTS ... 60
Model Assumptions ... 60
Chapter Page
Covariate Balance at the Centered Cutoff ... 60
Pooled MCRD Models ... 61
Parametric Model ... 61
Nonparametric Model ... 63
Multilevel Pooling MCRD Model ... 66
RCT Estimation ... 68
Within-study Comparison ... 69
Predictors of Treatment Impact Heterogeneity ... 71
Ⅴ. DISCUSSION ... 74
Estimation Methods ... 74
Within-study Comparison ... 76
Predictors of Treatment Impact Heterogeneity ... 79
Advantages of MCRD Design ... 82
Limitations and Future Directions ... 83
Implications and Conclusions ... 84
APPENDIX: COVARIATE BALANCE AT THE CENTERED CUTOFF ... 88
LIST OF FIGURES
Figure Page
1. RD with no treatment effects. ... 2
2. RD with treatment effects. ... 2
3. Average treatment effect at cutoff and average treatment effect on the treated using comparative untreated observations ... 14
4. Treatment effect at the upper cutoff in an HRD ... 15
5. Multiple cutoffs across sites... 18
6. RD estimates in a pooled dataset ... 19
7. Analytic sample breakdown by condition ... 38
8. Analytic sample by year and condition ... 39
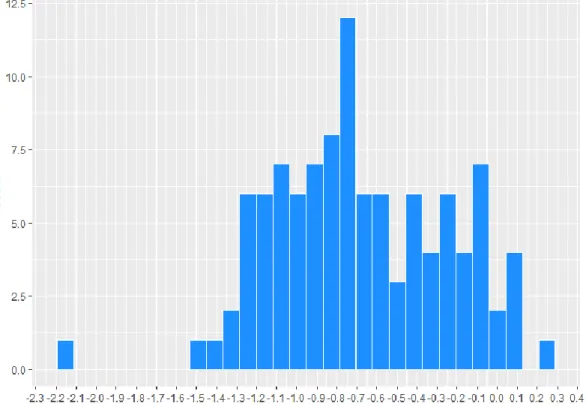
9. Cut-point distribution in the analytic sample ... 43
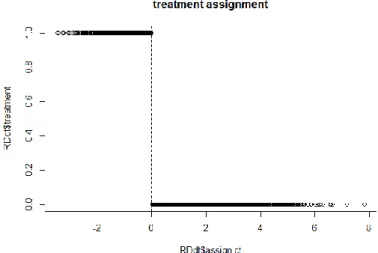
10. Treatment assignment as a function of the assignment variable score ... 60
11. Parametric plot of the assignment-outcome variable relationship by treatment assignment status ... 62
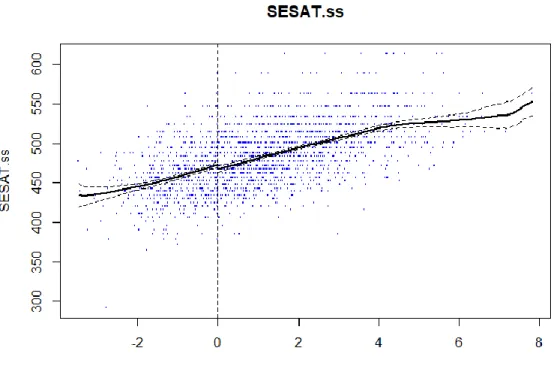
12. Nonparametric plot of the assignment-outcome variable relationship by treatment assignment status ... 66
LIST OF TABLES
Table Page
1. Student enrollment and demographics in percentages by year and school
district ... 34
2. Count of districts, schools, classrooms, interventionists, and students in the analytic sample... 38
3. Student characteristics and mean and standard deviations of assignment scores by treatment assignment condition in the MCRD designs ... 42
4. Student characteristics and mean and standard deviations of assignment scores by treatment assignment condition in the RCT designs... 45
5. Covariate balance statistics ... 61
6. Parametric pooled RD estimates of SESAT Mathematics outcome ... 62
7. Nonparametric pooled RD estimates of SESAT Mathematics outcome ... 65
8. Two-level unconditional SESAT Mathematics outcome model ... 67
9. Two-level conditional SESAT Mathematics outcome model ... 68
10. RCT treatment effect estimates ... 69
11. Results of within-study comparison... 70
12. Multilevel model results predicting SESAT Mathematics outcome from classroom cut-point ... 72
CHAPTER Ⅰ INTRODUCTION
The regression discontinuity (RD) design has been widely recommended as an alternative means to facilitate causal inference (Bloom, 2012). Recently, the Institute of Education Sciences (IES) affirmed the use of RD as a method to evaluate educational intervention programs, claiming that if statistical modeling assumptions are met and the design is properly implemented and analyzed, RD yields an unbiased treatment effect estimate (Jacob, Zhu, Sommers, & Bloom, 2012). In RD designs, individuals or units are assigned to either the treatment or control condition based on a cutoff score on a
preprogram measure. The assignment variable can be any measure taken prior to
treatment, including the pretest scores of the outcome variable. The assignment variable does not have to be highly correlated with the outcome variable, but the design has more statistical power if it does. In many applications, the assignment variable assesses the participants’ need for the treatment or intervention. For example, for a college math remedial program, students’ prior math test scores, such as the SAT mathematics scores, are utilized.
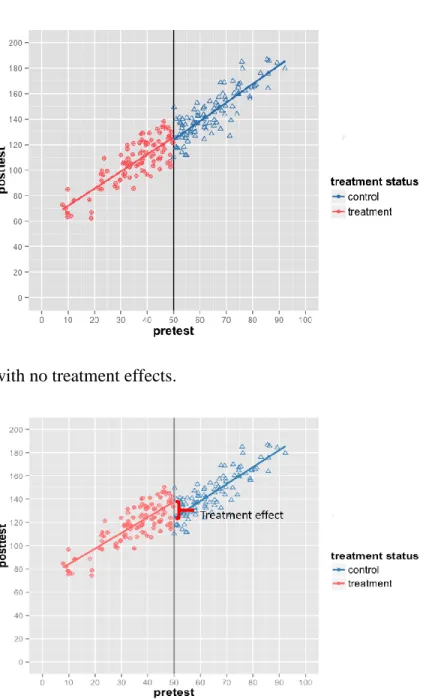
Figures 1 and 2 present the scatter plots of assignment variable scores against posttest scores used in the RD designs. Both scatter plots indicate a cutoff set at 50; subjects who score above the cutoff are assigned to the treatment condition, and those who score below the cutoff are assigned to the control condition. Figure 1 depicts a situation where a treatment has no effect. When the treatment is not effective, no discontinuity in the regression relationship between the assignment variable and posttest scores at the cutoff is observed. In contrast, when the treatment is effective, as shown in
Figure 2, a discontinuity in the regression relationship between the assignment variable and posttest scores occurs at the cutoff as the effect estimate is added to the posttest scores for all treatment participants. The difference in the intercept between the treatment and control regression segments at the cutoff indicates the magnitude of the treatment effect.
Figure 1. RD with no treatment effects.
RD offers three major advantages in a program evaluation context. First, it enables program administrators to target those who are most in need of treatment. As noted earlier a cut-score on the assignment variable is identified and those above or below the cutoff receive the treatment.
Second, RD enables the estimation of an unbiased causal estimate because the selection mechanism is completely known. Specifically, in RD, the use of a cutoff score to assign participants to the treatment and control conditions results in two nonequivalent groups: those with assignment scores below the cutoff and those with assignment scores above the cutoff. However, the source of the nonequivalence (i.e., the assignment score) is statistically modeled. Modeling the assignment scores adjusts for the group differences, thereby producing an unbiased causal estimate at the cut-score (Jacob et al., 2012). In addition, a small area near the cutoff, treatment assignment either to the treatment or control condition can be considered random due to a measurement error in the
assignment variable. The local randomization also provides additional conceptual support for unbiased treatment effect estimation at the cutoff.
For these reasons, several authors have recommended RD as a strong alternative to RCT, especially when the random assignment of individuals most in need of treatment is considered neither ethical nor feasible (Bloom, 2012; Schochet et al., 2010; Smith, 2014). Accordingly, RD has been applied to evaluate educational intervention programs, including Reading First (Gamse, Jacob, Horst, Boulay, & Unlu, 2008) and Head Start (Ludwig & Miller, 2007; Wong, Cook, Barnett, & Jung, 2008), as well as post-secondary remedial education programs (Calcagno & Long, 2008; Jacob & Lefgren, 2004; Moss, Yeaton, & LIoyd, 2014).
Despite the advantages offered by RD, the basic RD design has several
methodological limitations, including the following: (a) lower statistical power than a comparable RCT, (b) strong reliance on correct modeling of the assignment variable-outcome relationship, and (c) the limited generality of causal inference (Tang, Cook, Kisbu-Sakarya, Hock, & Chiang, 2017; Wing & Cook, 2013). To date, some efforts have been made to mitigate these challenges through supplemental analytic methods or by employing RD design variations. For example, to correctly specify the functional form in RD, researchers have recommended using nonparametric methods in addition to
parametric methods (Bloom, 2012; Hahn, Todd, & Van der Klaauw, 2002; Imbens & Lemieux, 2008; Lee & Lemieux, 2010; Sack & Ylvisaker, 1978). Nonparametric methods do not require the pre-specification of the functional form of the estimated relationship between the assignment variable and the outcome and enable the functional form to be determined by the data. Similarly, adding an untreated pretest function or another untreated comparison group has been suggested to improve the precision of RD because these approaches increase the sample size of the study and partial the correlation between the treatment status and the assignment variable (Tang et al., 2017; Wing & Cook, 2013).
An important aspect of these efforts has been the increased attention paid to improving the generality of RD estimates beyond the cutoff. One approach is to extend the area of causal inference in RD designs by using multiple cutoffs across the
assignment variable continuum (Black, Galdo, & Smith, 2007; Cattaneo, Titiunik, Vazquez-Bare, & Keele, 2016; Gamse et al., 2008), which is the focus of this study. Multiple-cutoff RD (MCRD) designs arise from variations in the cutoff used to assign
individuals or units to conditions (e.g., the school, district, and state). For example, colleges may have different GPA cutoffs to select merit-based scholarship recipients. Similarly, school districts may use different state assessment score cutoffs as the eligibility criteria for summer literacy programs. The availability of multiple cutoffs spread over an assignment variable continuum extends the area of causal inference in RD designs beyond the vicinity of a single cutoff. Thus, in MCRD designs, researchers can estimate an average RD treatment effect by pooling treatment effect estimates across cutoffs, or they can estimate the local RD treatment effects at each cutoff separately. Although MCRD is a promising approach for generalizing the RD treatment effect estimate, the current literature lacks a thorough examination of the estimation methods used in the application of this design. A common approach to identify treatment effects in the MCRD designs is to estimate a pooled RD treatment effect across cutoffs (Cattaneo et al., 2016). However, the statistical conclusion validity of this approach and the resulting implications for causal inference have not been well established. Similarly, there is also a relative dearth of research on the alternative MCRD method (i.e.,
multilevel pooling RD) that that allows for the estimation of and modeling of
heterogeneity in treatment effects across cutoffs. As a result of the unanswered questions surrounding the MCRD design and estimation, the primary goals of this study are as follows:
1. Demonstrate two treatment effect estimation methods for MCRD designs 2. Evaluate the two estimation methods with respect to the validity, efficiency,
and generalization of the causal inference
The findings of this study are expected to contribute to the growing body of literature on RD design variations intended to improve the generality of causal effect estimates. The results of this study may also help program providers and policy makers identify a valid, efficient, and informative program evaluation model when treatment assignment cutoffs vary by sites or units in practice.
In the following, I provide an overview of the theoretical framework and previous studies on RD. I specifically discuss the research literature pertaining to early
mathematics intervention programs, which constitutes the applied context for the current study. In addition, I review the previous research on MCRD designs and treatment effect heterogeneity. Then, I discuss the limitations in the current literature on MCRD and early mathematics intervention programs before presenting the research questions for this study.
CHAPTER Ⅱ LITERATURE REVIEW Regression Discontinuity (RD) Designs
In the RD design, subjects on one side of a cutoff score are assigned to the treatment group and those on the other side are assigned to the control group (Bloom, 2012; Shadish, Cook, & Campbell, 2002). For example, applying the RD framework to individuals selected for a Medicaid benefit (i.e., a health coverage program jointly funded by the federal and state governments), the program assigns those who score below an income cutoff in a base period to the treatment group and those who score above the cutoff to the control group. The RD design approach involves a comparison between the two groups with respect to the assignment-outcome variable relationship (e.g., income-medical expenditure). A discontinuity at the cut in the assignment-outcome regression line yields a local causal inference of the treatment effect on the outcome measure (i.e., the effect of Medicaid funds on medical expenditure).
In addition to causal inference, another compelling feature of RD design is associated with the ethical advantage it may offer in real-world, practical settings. Although the RCT provides the most straightforward means of identifying a treatment effect (Odom et al., 2005; What Works Clearinghouse, 2017), it places a burden on program administrators with respect to the randomization of subjects who are most in need of treatment. For example, when implementing a college remedial math program, program administrators may find it unethical to randomize students who score the lowest into either the treatment or control condition. In such scenarios, the use of RD enables program administrators to offer the program to those most in need. In the following
paragraphs, I provide a detailed description of the theoretical mechanism facilitating causal inference from RD designs.
Theoretical Framework of RD Designs
Thistlethwaite and Campbell (1960) first proposed and demonstrated RD as an approach for drawing causal inferences in an educational research context where participants were not randomly assigned to experimental and control groups. In this study, students received scholarships based on their score on a scholarship qualifying test, and the authors estimated the effect of student scholarships on career aspirations at the cutoff score for the award. Until 1970s, a major focus of the research was on the theorization of causal inference in RD designs along with the limitations (Campbell, 1969; Goldberger, 1972; Riecken et al., 1974). The identification of the limitations in RD designs led to significant methodological advances, particularly in econometrics (e.g., Angrist, Imbens, & Rubin, 1999; Imbens & Angrist, 1994). Although there were a couple of decades in which RD designs received less attention, since its initial introduction in the 1960s, RD designs have been well-established in both theory and methodology by the concerted efforts of researchers across different disciplines, including education, psychology, econometrics, and mathematics (Cook, 2008).
The primary rationale for RD as a methodology of estimating causal inference is that a completely known assignment rule is used to address the selection bias that is otherwise inherent in the design (Campbell & Stanley, 1963). Goldberger (1972) proved that incorporating the assignment variable in the estimation of the treatment effect could remove the confounding due to selection bias. In other words, he corroborated the notion that the treatment status indicator loses any “explanatory power with respect to an
outcome (y)” (Goldberger, 1972, p. 16) when including the assignment variable (x) in the regression because the assignment variable (x) completely determines treatment status (z). This means that when incorporating the assignment variable (x) in the regression model, the partial correlation between the treatment status (z) and the outcome becomes zero. Hence, when the RD model includes the assignment variable, the selection
procedure does not result in a spurious effect, thereby yielding an unbiased treatment effect estimate.
Similarly, Campbell and Stanley (1963) suggested that in RD designs, the chance of individuals around the cutoff being assigned either into treatment or control condition is random due to measurement error. Given the assumption of “local randomization,” individuals immediately above and below the cutoff are assumed to be identical, except in terms of the treatment assignment status. Therefore, any difference in mean outcomes between these two groups near the cutoff should only be attributed to the treatment (Jacob et al., 2012), which supports unbiased causal inference in RD designs (Lee & Lemieux, 2010).
Methodological Limitations in RD Designs
Once the theoretical framework of RD had been established, researchers started identifying the methodological limitations, including (a) a strong reliance on correct specification of the regression function, (b) low statistical power, and (c) a lack of generality of causal inference (Bloom, 2012; Wing & Cook, 2013; Tang et al., 2017). In response, the researchers made efforts to mitigate these challenges by using supplemental analytic methods (Angrist & Pischke, 2009; Hang et al., 2001; Imbens & Lemieux, 2008; Sack & Ylvisaker, 1978; Schochet, 2009) or by experimenting with alternative RD
designs, such as the comparative RD (CRD) design (Wing & Cook, 2013, Tang et al., 2017) and the hybrid RD design (Shadish et al., 2002; Trochim, 1984).
Strong reliance on the correct specification of the regression function. In RD, the validity of the causal estimate relies heavily on correct specification of the regression function linking the assignment and the outcome variable. For example, if researchers modeled a linear function when the true function for the hypothesized relationship is not linear (e.g., curvilinear), an artifactual discontinuity at the cutoff could be observed (Lee & Lemieux, 2010).
In light of this strong reliance on identifying the correct functional form,
researchers have suggested using supplemental analytic methods in addition to parametric methods. Sack and Ylvisaker (1978) introduced local nonparametric methods in
analyzing RD data. In this approach, a separate linear slope is estimated for ranges of local values of the assignment variable, and greater weights are assigned to observations near the cutoff. Since their introduction into RD analysis, nonparametric methods have widely been used (Angrist & Pischke, 2009; Bloom, 2012; Hahn et al., 2001; Imbens & Lemieux, 2008; Lee & Lemieux, 2010). In nonparametric methods, a particular
functional relationship between the predictor and the outcome variable is not predetermined as in parametric methods but is rather constructed according to information from the data. Therefore, nonparametric methods allow for flexibility in modeling functional form across the assignment variable continuum (Bloom, 2012; Whitley & Ball, 2002). In many RD analyses, nonparametric methods have been used to supplement the treatment effect estimates from parametric methods, thereby allowing researchers to assess the potential misspecification of parametric functional forms (Moss
et al., 2014; Shadish, Galindo, Wong, Steiner, & Cook, 2011; Wing & Cook, 2013; Wong et al., 2008). The expectation is that consistent results found across parametric and
nonparametric methods strengthen the validity of the treatment effect estimate (Lee & Lemieux, 2010).
Low statistical power. Low statistical power due to the correlation between the treatment status indicator and the assignment variable is another area that researchers have attempted to address in RD designs (Goldberger, 1972; Schochet, 2009; Tang & Cook, 2014). Goldberger (1972) demonstrated that RD has a lower statistical power than an RCT, as it requires a sample size between 2.75 and 4 times greater than that of a comparable RCT to detect the same treatment effect. Lower statistical power would be a secondary concern in RD studies with large-scale datasets. However, it would be a major issue in small-scale RD studies, in which individual researchers or small school districts collect their own data (Wing & Cook, 2013). Therefore, to improve power, researchers have suggested adding covariates, pretest scores, or untreated comparison group
observations to the model (Calonico, Cattaneo, Farrell, & Titiunik, 2016; Schochet, 2009; Tang & Cook, 2014; Wing & Cook, 2013).
Specifically, covariates are often included in the basic RD design to increase precision, as is common in the analysis of randomized experiments (Calonico et al., 2016). The expectation is that the covariates in the RD regression will reduce
unexplained outcome variance. Recent work by Calconico and colleagues (2016) proved that including covariates in RD estimation can lead to an improvement in precision, without substantially altering the RD estimate.
basic RD design also improves efficiency by increasing the sample size for the analysis and reducing the correlation between the treatment status variable and the assignment (Schochet, 2009; Wing & Cook, 2013). Wing and Cook (2013) revealed that the
inclusion of pretest scores produced RD estimates that were more precise than those from the basic RD design, and it yielded standard errors close to those of a comparable RCT.
Lack of generality of causal inference. As noted earlier, one key limitation of basic RD is the limited generality of the treatment effect (Tang et al., 2017; Wing & Cook, 2013; Zvoch, Yoon, & Cook, 2016). In the basic RD design, knowing the shape of the treatment regression function in the untreated part or of the control group function in the treated part of the assignment variable continuum is not possible. As a result, causal inference in basic RD is limited to the small area surrounding the cutoff where local randomization occurs.
To strengthen the generality of the RD treatment effect, researchers have recently experimented with several RD design variants, including the use of comparative design elements (Tang et al., 2017; Wing & Cook, 2013; Wing & Bello-Gomez, 2018), the incorporation of a randomization interval in the basic RD design (Black et al., 2007; Cappelleri & Trochim, 1994, 1995; Moss et al., 2014; Trochim & Cappelleri, 1992; Zvoch et al., 2016), and the use of multiple cutoffs (Black et al., 2007; Cattaneo et al., 2016; Gamse et al., 2008).
Comparative RD Designs
CRD is a design in which observations on pretest outcomes (CRD-pre) or
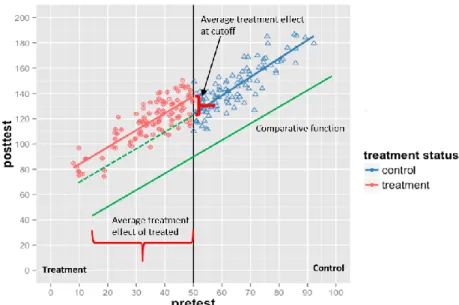
comparison groups (CRD-CG) are added to the basic RD design (Tang et al., 2017; Wing & Cook, 2013). As can be seen in Figure 3, CRD comprises the following three
regression segments: (a) an RD treated segment (light-pink line), (b) an RD control segment (blue line), and (c) a comparative segment (green line). The comparison observations are from pretest scores or the untreated comparison group (e.g., posttest scores from the previous cohort, which was not exposed to treatment). The key
assumption in the CRD is that the comparative regression function is parallel with the RD control function, and the gap between the two functions is invariant across (above the cutoff in this example) (Tang et al., 2017; Wing & Bello-Gomez, 2018). If the parallel assumption is met, the RD control regression function is extrapolated toward the treated part of the assignment variable continuum (dotted green line in Figure 3), under the assumption that the fixed difference between the RD control function and the
comparative function in the control part of the assignment variable continuum (above the cutoff in Figure 3) continues to exist in the treated part (Wing & Bello-Gomez, 2018). The hypothetical counterfactual function created in the treated part of the assignment variable continuum allows the estimation of the average treatment effect on the treated (ATT), thereby supporting the extrapolation of the causal inference of treatment effects beyond the cutoff.
Figure 3. Average treatment effect at cutoff and average treatment effect on the treated using comparative untreated observations.
In a CRD application, Tang et al. (2017) found that adding pretest scores and comparative group observations to the basic RD produced unbiased causal estimates above the cutoff as efficient as RCT and more efficient than the basic RD design did. Specifically, in Tang et al.’s study (2017), as the regression functional form of the comparative untreated observations was parallel with that from actual untreated
observations in the basic RD, the treatment effect estimates yielded at the cutoff could be correctly extrapolated above the cutoff. The inclusion of additional comparative cases also improved the precision of the resulting treatment effect estimates. The addition of pretest scores increased the sample size and also reduced the correlation between the treatment status variable and the assignment variable, which increased precision by reducing the standard error of the treatment estimate (Schochet, 2009; Wing & Cook, 2013). Given the advantages that CRD offers with respect to increasing the generality of causal inference and improving precision, researchers have strongly recommended that
program evaluators and policy makers use CRD instead of the basic RD whenever possible (Tang & Cook, 2014; Tang et al., 2017).
Hybrid RD Designs
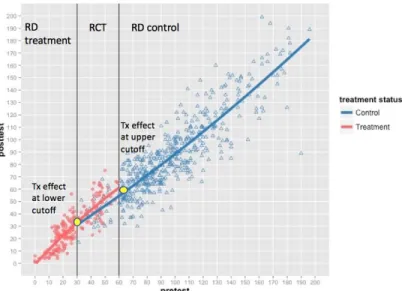
Hybrid RD (HRD; Shadish et al., 2002; Trochim, 1984), another variant of basic RD that was developed to increase the generality of RD estimates, combines the basic RD design with an RCT. To implement an HRD, a randomized interval along the assignment variable continuum is first identified. Second, participants falling into that interval are randomly assigned either to the treatment or control group. Third, participants below or above the cutoffs are assigned to either the RD treatment or the RD control condition (see Figure 4).
Figure 4. Treatment effect at the upper cutoff in an HRD.
In the HRD design modeled in Figure 4, for example, all participants scoring below the lower cutoff are assigned to the RD treatment condition, while those scoring above the upper cutoff are assigned to the RD control condition (Shadish et al., 2002). Participants whose assignment score falls between cutoffs (randomization interval) are randomly assigned to either the RCT treatment or the RCT control group. In an HRD
framework, RD estimates at the lower and upper cutoffs, as well as the average treatment effect within the randomization interval, can be estimated if the regression functions relating the assignment variables to the outcomes for the treatment and control groups are parallel across the randomized interval. If the regression functions are not parallel (i.e., an interaction between an assignment variable and outcome variable is observed),
differential treatment effects can be estimated depending on the value of the assignment variable (Zvoch et al., 2016).
HRD improves causal generalization by embedding a randomization interval into the basic RD design. The availability of treatment and control cases in the randomization interval has the advantage of allowing the estimation of actual assignment–outcome regression functions for both treatment and control cases over a common part of the assignment variable continuum. The estimation of the average treatment effects (ATE) within the randomization interval then supports the causal generalization within the randomization interval. In addition, inclusion of the randomization interval also increases precision by reducing the correlation between treatment status and the assignment
variable.
Both CRD and HRD improve the fundamental limitations of the basic RD: (a) limited causal generalization and (b) lower statistical power. However, a key difference between HRD and CRD is that the causal generalization in HRD is still limited within the randomization interval, whereas in CRD the causal generalization can be made along the entire assignment variable continuum. The advantage that HRD provides over CRD is that it relaxes a stringent statistical assumption that is required in the latter approach. In a CRD design, the regression functional form for the comparative controls has to be
parallel to the regression function for the observed control cases. In an HRD design, again, the availability of actual treatment and control cases within the randomization interval enables the estimation of the treatment effect within the interval. Therefore, HRD does not necessitate that the RD control function be extrapolated within the
randomization interval, as it is directly observed. Multiple-cutoff RD (MCRD) Designs
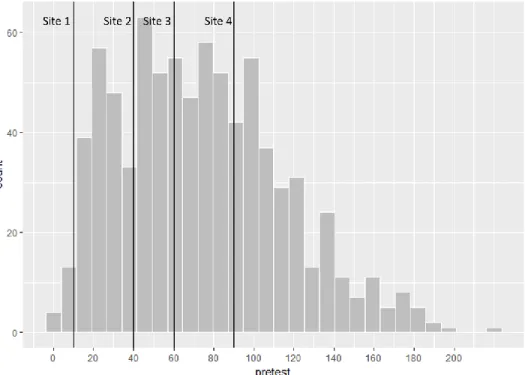
Another method to increase the generality of RD estimates uses multiple cutoffs along the assignment variable (Angrist & Lavy, 1999; Berk & de Leeuw, 1999; Black et al., 2007; Canton & Blom, 2004; Chay, McEwan, & Urquiola, 2005; der Klaauw, 2002, 2008; Dobkin & Ferreira, 2010; Eggers et al., 2015; Goodman, 2008; Hjalmarsson, 2009; Klasnja & Titiunik, 2017). In such designs, cutoffs generally vary by sites (e.g., school) or times (e.g., year). For instance, a college scholarship can be awarded to students based on their state test scores, but the cutoff score can vary by school district or state (see Figure 5). Multiple-cutoff RD (MCRD) designs support causal generalization by allowing the estimation of a weighted, average RD treatment effect across multiple cutoffs in the assignment variable continuum. In addition, the MCRD approach can also be used to estimate a local RD treatment effect at each cutoff, possibly revealing
Figure 5. Multiple cutoffs across sites
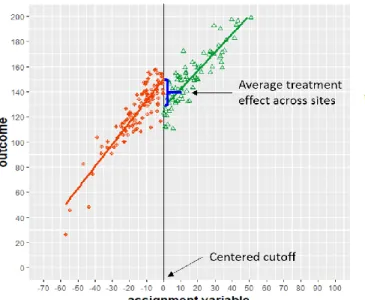
To date, most studies have used the centering-and-pooling approach to estimate average RD treatment effects across cutoffs in an MCRD design (Cattaneo et al., 2016). Only a few studies have separately estimated a local RD treatment effect at each cutoff in addition to the pooled RD estimate (Canton & Blom, 2004; Cattaneo et al., 2016; der Klaauw, 2002, 2008). The centering-and-pooling approach is implemented by first centering the assignment variable at each cutoff (i.e., normalizing the cutoff) so that all units have a zero cutoff value. Second, observations from all cutoff groups are pooled into a single dataset, and a standard RD is implemented using the pooled dataset
consisting of a single cutoff centered at zero (see Figures 5–6). The idea is that the pooled estimates for RD treatment effect can serve as the overall average of the local treatment effects at each cutoff (see Figure 6). Therefore, the pooled RD treatment effect can be considered the average treatment effect across the range of assignment variable continuum where distinct cutpoints are located (Cattaneo et al., 2016).
Figure 6. RD estimates in a pooled dataset.
The MCRD approach has been applied in a variety of contexts, including
education and public policy, but the most common applications occur in political science (Albouy, 2013; Cattaneo et al., 2016; Eggers et al., 2009; Folke & Snyder, 2012; Hall & Snyder, 2015; Klasnja & Titiunik, 2017; Pettersson-Lidbom, 2008; Uppal, 2009). This is particularly the case in studies where the assignment variable was the impact of winning one election (i.e., becoming an incumbent party) on winning the subsequent election, examined using vote share (i.e., the percentage of total votes a party has secured in an election), and the cutoff was the vote share of the winning party (Butler, 2009; Eggers et al., 2015; Klašnja & Titiunik, 2017; Lee, 2008; Lee, Moretti, & Butler, 2004; Uppal, 2009). The MCRD approach was well-suited for such studies because the vote share of the winning party often varied by electoral constituency (Cattaneo et al., 2016). In light of such variations in cutoffs, almost all political scientists (e.g., Klasnja & Titiunik, 2017) have employed the centering-and-pooling approach by using a margin of victory for the party of interest (i.e., vote share obtained by the party of interest minus the vote share
obtained by its strongest opponent) as the assignment variable (e.g., Klasnja & Titiunik, 2017). When using the margin of victory to normalize cutoffs across the electoral constituency, the vote share of the party of interest is converted to relative standing against its strongest opponent. The normalized assignment-variable distribution has a cutoff at zero, at which the party of interest has the same vote share as its strongest opponent. Therefore, by using the margin-of-victory scores (i.e., assignment variable), researchers can then pool all their observations, implement a standard RD analysis with a single cutoff, and estimate a single average treatment effect across cutoffs.
In public-policy research, Black et al. (2007) examined the impact of
reemployment services on earnings using cutoffs that varied by time (e.g., weeks) and geography (e.g., local offices). Based on a profiling variable (i.e., expected duration of benefit receipt computed as a function of the individual’s characteristics and the state of the local economy), participants were assigned to either the treatment or control
condition: Those with higher profiling scores were assigned to treatment, those with lower profiling scores were assigned to the control condition, and those with moderate profiling scores were randomly assigned to either the treatment or control condition. To analyze RD estimates across time and geography (i.e., sites), Black et al. (2007) adopted a two-dimensional RD approach—estimating treatment effects in each dimension separately—as well as the normalizing-and-pooling approach. For example, for the geography dimension, the authors first centered the assignment score (i.e., profiling score) at each site cutoff, then pooled the cases from the cutoff groups into a single dataset and estimated the average treatment effect across the entire assignment variable continuum. Their findings show an unbiased treatment effect estimated in both
dimensions, supporting the validity of the MCRD design.
To date, a handful of studies in education research have applied MCRD designs (Angrist & Lavy, 1999; Canton & Blom, 2004; Chay & McEwan, & Urquiola, 2005; Dobkin & Ferreira, 2010; Goodman, 2008; Hoxby, 2000; Kane, 2003; Urquiola, 2006; Urquiola & Verhoogen, 2009; Van der Klaauw, 2002, 2008). For example, Chay,
McEwan, and Urquiola (2005) examined the effects of school aid funds (i.e., Chile’s 900 School Program) on 4th grade students’ gain scores in language and math. The school aid funds were assigned to schools based on their combined mean scores for math and language on a national achievement test. Because the school aid cutoffs varied across Chile’s 13 regions, the authors also estimated the pooled RD treatment effect: an average treatment effect across cutoffs. Specifically, they centered the assignment variable—the average mean score for math and language—at each cutoff by creating an average score relative to the cutoff at each region (i.e., subtracting the cutoff score from each school’s 1998 average score). Then, they pooled all observations from different regions (i.e., cutoff groups) in a single dataset to run an RD analysis with a single cutoff and estimated an average effect of school aid on student achievement across the 13 regions. Similarly, Dobkin and Ferreira (2010) used an MCRD design to study the effects of school entry law on adult education attainment and job market outcomes (e.g., wages, probability of employment). The treatment in this study was the enforcement of a school entry law, and the assignment variable was age. The cutoff was the date when the school entry law was in effect when the participants were five years old, which varied by research site (i.e., California and Texas) because each state had a different age cutoff for school entry. The authors centered the assignment variable using the number of days from the individual’s
birthday to the age cutoff date of each state and ran a standard RD analysis with a centered single cutoff to estimate an average single RD treatment effect across the two states.
A small number of studies across disciplines, however, have estimated local RD treatment effects at each cutoff in addition to average RD treatment effects. These studies have used the normalizing and pooling approach to examine heterogeneity in treatment effects depending on cutoff locations on the assignment variable continuum (Canton & Blom, 2004; Cattaneo et al., 2016; Van der Claauw, 2002, 2008). For example, Cattaneo et al. (2016) demonstrated the estimation of both pooled and local RD treatment effects using three empirical examples from political science and education. For the education example, the authors used data from the previously mentioned study evaluating the effects of a Chilean school improvement intervention (P-900) on schools’ mean language and mathematics achievement score gains (Chay et al., 2005). In this example, the
authors estimated both a single average RD treatment effect and RD effects at six cutoffs determined by region. The results revealed moderate heterogeneity in the effects of P-900 on school mean language gains across cutoffs. Despite the positive average effect of P-900 on language outcomes, the authors also found negative effects at two local cutoffs. These findings suggest that the estimation of the average RD treatment effect using the normalizing and pooling method may “miss the opportunity to uncover key observable heterogeneity in RD design” (Cattaneo et al., 2016, p. 1230). In a study on the effects on college enrollment of merit-based financial aid offered to high school students based on their high school GPAs, Van der Klaauw (2002) also identified differences between local
RD estimates at three different GPA cutoffs and the pooled RD estimate at a centered cutoff.
Taken together, in previous MCRD designs, researchers have mostly estimated a single pooled RD treatment effect. This approach is useful in that it summarizes the weighted average treatment effect across cutoffs, thereby increasing the generality of RD treatment effect estimates beyond a single cutoff point. However, the use of the pooling method alone may ignore potential heterogeneity in treatment effects, given the location of the cutoff on the assignment variable continuum (Cattaneo et al., 2016). The
identification of heterogeneous treatment effects could reveal rich information about the treatment effects that may be obscured when averaged across units. For example,
information on heterogeneous treatment effects could help identify subgroups of students along the assignment variable continuum for whom an intervention is particularly
effective. It should be cautioned, however, that the estimation of local RD treatment effects at each cutoff may not be always feasible or plausible given a particular dataset or research context. A small number of cases around each cutoff, for example, will make it challenging for researchers to detect local RD treatment effects due to low statistical power. In such cases, estimating an average RD treatment effect may be the better option.
In this regard, it is notable that there has been little investigation of estimation approaches for MCRD. Many past studies have applied MCRD designs using the normalizing and pooling approach without explaining the rationale for choosing this analytic method. Given this gap in the current MCRD literature, the validity of the causal inferences in past MCRD designs and the contexts in which these methods could make credible causal inferences remain unknown. Furthermore, there has been a lack of effort
to investigate other analytic approaches for MCRD designs or to explore different strategies in terms of either the internal and external validity of causal estimates or the resulting policy implications.
Kindergarten Math Intervention
Kindergarten mathematics has received increased attention given its critical impact on the development of mathematics understanding in subsequent grades (Clarke et al., 2016; Gersten, Jordan, Flojo, 2005; Jordan & Dyson, 2016; Kohli, Sullivan, Sadeh, Zopluoglu, 2015; Locuniak & Jordan, 2008; Morgan, Farkas, Hillemeier, & Maczuga, 2016; Morgan, Farkas, & Wu, 2009). Data from the Early Childhood Longitudinal Study—Kindergarten Cohort (ECLS-K) revealed that students with mathematics
difficulties in kindergarten displayed consistently lower growth rates than their not-at-risk peers in grades 1 through 5 (Morgan, Farkas, & Wu, 2011). The consistently low math gains observed over time for students with math learning disabilities (MLD) in
kindergarten widened the fifth grade math achievement gap between these students and students who did not display MLD in kindergarten (Morgan et al., 2011). This study also showed that students who experienced MLD at the end of kindergarten were far more likely than their not-at-risk peers to persistently display MLD throughout elementary and middle school and that kindergarten mathematics achievement is a stronger predictor of MLD than such variables as cognitive delays. In response to the findings of the ECLS-K, there have been focused efforts to screen students with MLD early on and prevent MLD by strengthening the core kindergarten math curriculum and providing additional small-group interventions through multi-tier systems of support (MTSS), such as response to intervention (RTI).
Although there are variations across early math interventions, many focus on the development of number sense (Berch, 2005; Clarke, Baker, & Fien, 2008; Dyson, Jordan, & Glutting, 2013; Gersten & Chard, 1999; National Mathematics Advisory Panel, 2008) using evidence-based instructional practices that have been shown to be effective for at-risk learners (Archer & Hughes, 2011; Baker, Gersten, & Lee, 2002; Coyne, Kame’enui, & Carnine, 2011; Gersten et al., 2009; Kroesbergen & Van Luit, 2003).
Number sense is the ability to connect mathematical concepts to numerical relationships (Gersten & Chad, 1999), which allows students to count, discriminate and coordinate quantities, estimate quantities, discern number patterns, and perform simple number transformations through addition and subtraction (Jordan et al., 2006). Research has showed that most children develop number sense before beginning elementary education (Ginsburg & Golbeck, 2004; Ginsburg & Russell, 1981; Huttenlocher, Jordan, & Levine, 1994; Jordan, Huttenlocher, & Levine, 1994) and that a failure to develop this foundational number concept prior to formal education is associated with difficulties in accessing more advanced mathematics taught in later grades (Jordan et al., 2013; Wu, 1999).
Emerging evidence supports the efficacy of kindergarten math interventions focusing on number sense development. For example, Dyson and Jordan (2011) and Jordan and colleagues (2012) provided 30-minute-long number sense interventions three times a week for eight weeks in a small-group setting that focused on developing the whole number concept in relation to counting, comparing, and manipulating sets to low-income kindergarteners at risk for mathematics difficulties. An evaluation of both
delayed post-test number sense relative to the business-as-usual (BAU) group (Jordan, Glutting, Dyson, Hassinger-Das, & Irwin, 2012). These results suggest that the continued effects of number sense intervention in kindergarten could help narrow the math
achievement gap between students with MLD and students without MLD as they progress in school.
Response to Intervention (RTI)
Many of the research-based kindergarten math interventions are provided through a multi-tier system of support (MTSS) or response to intervention (RTI) (Fuchs &
Vaughn, 2012) frameworks. RTI is a multi-tiered approach for the early identification of students at risk for learning difficulties or disabilities, and provides increasingly intensive and focused academic intervention based on student need. In the RTI framework,
students’ response to intervention and their rate of learning are assessed and monitored through universal screening and progress-monitoring tools several times a year. Although multiple RTI models (Fuchs & Fuchs, 2006) exist, a three-tier model is most commonly used (Fuchs & Vaughn, 2012); in this model, students who do not show an adequate level of learning progress receive a more intensive intervention. Within Tier 1, all students receive scientifically validated instruction in a general classroom setting to ensure that their difficulties are not due to insufficient classroom instruction (Fuchs & Fuchs, 2017). Then, those students who do not adequately respond to the core instruction are provided with supplemental small-group instruction (Tier 2). Within Tier 2, small groups of students (fewer than 6) with similar learning needs receive explicit and systematic instruction three to five times a week for at least 20 minutes per day. If the students in Tier 2 do not meet grade-level expectations, as measured by a progress-monitoring
assessment, they are provided individualized instruction that targets their skill deficits (Tier 3). Those students who continue to demonstrate inadequate response to the Tier 3 intervention are then considered for eligibility for special education services (IDEA, 2004). As a prevention system, RTI serves to identify early stage learning difficulties and reduce special education referrals based on the assumption that struggling students are identified early enough so that supplemental intensive instruction can improve student learning outcomes. In what follows, I introduce one of the Tier-2 kindergarten math interventions—ROOTS—to provide the context of this study.
ROOTS
ROOTS is one of the evidence-based Tier-2 kindergarten interventions focused on the development of number sense and whole number concepts, including (a) counting and cardinality, (b) number operations, and (c) base 10/place value (Clarke, Doabler, Fien, Baker & Smolkowski, 2012). ROOTS provides 50 lessons to small groups of 5 students struggling with developing proficiency with whole number concepts and skills for 20 minutes a day, 5 days per week for approximately 10 weeks. In addition to the focused whole number content, ROOTS features the use of the following four validated explicit and systematic mathematics instructional practices: (a) teacher modeling, (b) deliberate practice, (c) visual representations of mathematics, and (d) academic feedback. The ROOTS intervention also facilitates structured opportunities for students to deeply engage in important whole number concepts and skills by having students verbalize their mathematical thinking and discuss their problem-solving methods (Clarke et al., 2016). The efficacy of ROOTS was evaluated using a randomized controlled trial (RCT) design (Clarke et al., 2016; Doabler et al., 2017). Specifically, the 10 lowest children on a
screening measure in each of 120 classrooms were randomly assigned to either the treatment or the control condition, meaning that each participating classroom had a different cutoff for screening students into the treatment condition.
The use of ROOTS data in this study is appropriate for the following reasons. First, the multiple cutoffs used to determine ROOTS-eligible students across classrooms enables the application of the MCRD design, in which an average treatment effect across cutoffs is estimated and potential heterogeneity in treatment effect across classrooms can be explored. Second, the use of the RCT design in the original ROOTS study allows the evaluation of the performance of the MCRD design compared to the RCT design. Specifically, the bias and precision of the MCRD design relative to the RCT can be assessed by comparing the treatment effect and power estimates from MCRD with those from RCT.
Predictors of Math Intervention Impact Variability
While research on the development and validation of early mathematics intervention programs is rapidly expanding, there is a growing recognition that not all students respond to these interventions equally (Fuchs et al., 2006; Fuchs & Vaughn, 2012; Starkey & Klein, 2008). The identification of persistently low-achieving students who are not responsive to interventions has motivated research on the factors that predict this non-responsiveness (Miller, Vaughn, & Freund, 2014). Although empirical evidence is emerging and the findings are mixed, these studies have focused on initial math skill (Clarke et al., 2017, in press; Fien et al., 2016; Fuchs, Sterba, Fuchs, & Malone, 2016; Toll & Van Luit, 2013).
Initial math skill. A growing number of studies have investigated initial math skill as a key predictor of the variability of math intervention impact (Clarke et al., 2017, in press; Fien et al., 2016; Fuchs, Sterba, Fuchs, & Malone, 2016; Toll & Van Luit, 2013). Fien et al. (2016) tested the efficacy of an evidence-based math game intervention that focuses on the development of whole number concepts with 250 first-grade students by using an RCT design. The researchers found a statistically significant main effect of treatment on some of their outcome measures, but they did not identify a moderation effect of student initial math skill level on treatment impact. Toll and Van Luit (2013) provided a math intervention focused on basic numerical concepts and math-related language to kindergarteners with low numeracy skills and evaluated if the effect of the intervention was different for students with moderately low skills and those with low initial numeracy skills. The results showed that the intervention was only effective for students with moderately low initial numeracy skills. Fuchs, Sterba, Fuchs, and Malone (2016) found that pre-intervention calculation skill was not predictive of differential responsiveness to a fraction intervention delivered to fourth-grade students displaying low math achievement. However, Fuchs et al. (2016) found that fraction word-problem intervention was more effective for students with greater initial reasoning ability. In addition, Clarke et al. (in press), in their preliminary evaluation study of a small-group kindergarten math intervention program focused on developing whole number concepts and skills, found greater intervention effects for students with lower initial math skills. Taken together, the current literature on the moderating effect of initial math skills on treatment effect has been mixed in terms of the presence of the effect and the direction of
impact—whether the intervention is more effective for students with greater or lower initial math skills.
The Current Study
The review of previous research on the MCRD design shows the gaps in the existing MCRD analytic approaches used to estimate RD treatment effects. The current literature also suggests that researchers could effectively investigate the heterogeneity of treatment effect by utilizing the multilevel modeling approach for the MCRD design, not solely relying on a pooling approach. In addition, the emerging literature on
heterogeneity in the impact of math interventions warrants additional studies, which could help clarify the source of mixed findings in the literature.
The current study builds on the existing MCRD design in an attempt to increase causal inference beyond the cutoff. In particular, this study is closely aligned with a study by Cattaneo et al. (2016) in that both studies intend to demonstrate and evaluate the optional estimation methods for the MCRD design. This study also extends extant literature on the predictors of heterogeneity in the impact of early math intervention by investigating the moderating role of initial math skill.
The purpose of this study, therefore, is to (a) demonstrate the application of two treatment effect estimation methods (i.e., a conventional pooling method and a multilevel pooling method) for the MCRD designs using Tier 2 kindergarten math intervention data, (b) examine the extent to which the two methods yield unbiased and precise estimates comparable to those from the RCT design, and (c) investigate the moderating role of a classroom characteristic (i.e., classroom cut-point) on the size of the ROOTS intervention effect.
If correctly modeled and properly implemented, the current demonstration will add to recent literature on improving the generality of RD estimates beyond the cutoff by demonstrating and evaluating the applications of different MCRD analytic approaches. Theoretically, both pooled average RD treatment effect and multilevel pooled RD treatment effect estimated at the centered cutoff will help extend the area of causal
inference in RD designs beyond a single cutoff. In addition, the findings of this study will add to the growing literature on heterogeneity in math intervention impact, which will help disentangle the mixed findings in the current literature.
Practically, the current study will help program evaluators and policy makers identify a valid and informative program evaluation model when treatment assignment cutoffs vary by sites or times. In particular, the potential identification of heterogeneous treatment effects across cutoffs will provide more specific information about program effectiveness (e.g., how a math intervention may work differently depending on the students’ initial math skill). This understanding will further help researchers, program evaluators, and policy makers design, revise, and evaluate interventions that work for students with differential need. Given this backdrop, the research questions are as follows:
1. On average, do the students assigned to the ROOTS intervention outperform those assigned to the control condition across cutoffs?
2. To what extent do treatment effects vary across cutoffs?
3. To what extent does the pooled average RD estimates and the multilevel pooled RD estimates obtained across cutoffs yield unbiased and precise causal estimates relative to the ROOTS RCT benchmark?
4. To what extent is treatment effect variability predicted by classroom characteristics, such as the cut-point used to screen treated students in each classroom?
CHAPTER Ⅲ METHODS
In this section, I describe the methodological procedures used in the present study. A variety of graphical, parametric, and nonparametric analyses were implemented for the MCRD using the ROOTS intervention dataset.
Data Source
The ROOTS math intervention data were collected from 2012 to 2015 in conjunction with a university–school district collaboration designed to evaluate the impact of a small-group (Tier 2) kindergarten mathematics intervention. In Years 1 and 2, the participants comprised four school districts in Oregon: one school district located in the Portland metropolitan area and three located in suburban and rural areas of western Oregon. In Years 2 through 3, two school districts from the metropolitan area of Boston, Massachusetts, participated. Table 1 presents the student demographics in percentage by district.
Note. aStatistics are reported for students in grades K-3; bStatistics are reported for student K-12.
From 2012 to 2013, across the four districts in Oregon, student enrollment ranged from 2,736 to 38,557 students. The student bodies were approximately 46 to 92% White, 0 to –74% Hispanic, 0–9% African American, 0–16% Asian American, 0–12% American Indian or Native Alaskan, and 0–15% more than one race, respectively. From 2012–2013, approximately 17–86% of district students received a free or reduced-price lunch, 8–23% Table 1
Student Enrollment and Demographics in Percentages by Year and School District
2012-2013 2013-2014 Oregona Massachusettsb Student characteristics 1 2 3 4 5 6 Student enrollment (N) 5,725 2,736 10,808 38,557 6,118 6,843 Race (%) White 69 83 69 48 7.8 80.5 Hispanic 18 11 20 26 82.1 6.7 African American 2 1 2 3 7.1 5.4 Asian 2 2 1 14 1.9 4 Native American <1 <1 2 1 0 0.1 Native Hawaiian/Pacific Islander 1 - <1 1 0.3 0.3
More than one race 2 1 7 8 0.8 3
Economically disadvantaged (%) 58 64 69 43 83.4 29.8
English language learners (%) 9 5 10 26 18.9 3.1
of students received special education services, and 5–68% of district students were English language learners.
From 2013–2014, the two districts in Boston had total enrollments of 6,118 and 6,843 students, respectively. In these districts, the student characteristics were 7.8% and 80.5% White, 82.1% and 6.7% Hispanic, 7.1% and 5.4% African American, 1.9% and 4% Asian American, 0.3% and 0.1% American Indian or Native Alaskan, and 0.8 % and 3.0% more than one race, respectively. Approximately 83.4% and 29.8% of each district received a free or reduced-price lunch, 12.7% and 17.2% of students received special education services, and 18.9% and 17.2% of students were identified as English language learners, respectively.
Analytic Sample
Schools. Table 2 presents the count of districts, schools, classrooms,
interventionists, and students in the analytic sample. The analytic sample included 14 schools from four school districts in Oregon and 9 schools from two school districts in the metropolitan area of Boston, Massachusetts. In Oregon, six schools were located in one school district in the Portland metropolitan area, and the remaining schools were located in three suburban or rural school districts. In one of the school districts in Boston, all the participants attended the same school. In the other Boston district, the participants attended eight different schools.
Classrooms. The analytic sample consisted of 51 classrooms from Oregon and 55 classrooms from Boston. On average, the classrooms comprised 21.4 students each (SD = 5.14) and provided general kindergarten mathematics instruction five days per week. When classrooms had insufficient numbers of students to form intervention and control
groups on their own, “intervention classrooms” were formed by combining two or three classrooms. Across four years of project, a total of 11 combined ROOTS classrooms were created using 24 classrooms.
Interventionists. The analytic sample included 71 interventionists. The
interventionists included district-employed instructional assistants, interventionists hired for the ROOTS math intervention study, and certified kindergarten teachers. In the original sample, the majority of the interventionists self-identified as female (94%) and White (76%), with 12% identifying as Hispanic and 12% identifying as another
race/ethnicity or declining to respond. Almost all the interventionists (92%) had previous experience providing small-group instruction, and 61% had a bachelor’s degree or higher. About half of the interventionists (57%) had taken an algebra course at the college or graduate level. On average, the interventionists had 10.4 years of teaching experience (SD = 8.6), and 22% had a current teaching license or certification. The interventionists underwent two additional five-hour professional development workshops. Furthermore, during the implementation period, all interventionists received instructional support from two to five former educators each year through one to four in-class coaching visits varying by the interventionists’ implementation needs (Clarke et al., 2016; Doabler et al., 2016).
Students. The analytic sample used in this study was drawn from the original ROOTS study, which was conducted using a randomized controlled trial design (Clarke et al., 2012). Specifically, in the original ROOTS study, the 10 lowest performing
(2:1) group, (b) a ROOTS–large (5:1) group, or (c) the no-treatment business-as-usual (BAU) control condition.
The initial sample for this study comprised 3,454 kindergarten children, including (a) those who were eligible for random assignment to either the treatment or the control condition (n = 1,253) and (b) those who were ineligible for the random assignment but were assessed on the screening and post-test assessments (n = 2,201). The following observations were excluded from the analytic sample: (a) those whose screenings, post-test assessments, and assigned conditions were unavailable (n = 691) were omitted because an RD analysis could not be implemented without such information; (b) those who were ineligible for the intervention as a result of their performance on the screening measure (above the cut-off rank order), but who received the intervention (n = 108), and those who met the eligibility criteria, but were categorized as the non-eligible sample (n = 115), were deleted because these non-compliant observations were expected to bias the RD treatment effect estimate; (c) those from the combined classroom for the ROOTS intervention (n = 282) were excluded so as to model and estimate the classroom-level variance using multilevel RD design; (d) those whose demographic information (i.e., age and gender) was not available (n = 22) were excluded because the covariate balance could not be tested with these observations; and (e) those in the BAU control condition (n
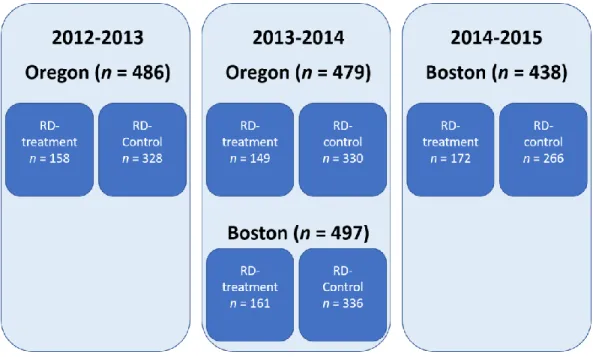
= 336) were excluded from the RCT sample so as to create an RD treatment sample. As a result, the analytic sample for this study comprised 1,900 kindergarten students for the 2012–2013 (n = 486), 2013–2014 (n = 976), and 2014–2015 (n = 438) academic years (see Figures 7 and 8). The sample included 963 (50.7%) females, 224 (11.8%) ethnic
minority students, 252 (13.3%) English language learners, and 85 (4.5%) students receiving special education services. The average age of the sample was 5.36 years. Table 2
Count of Districts, Schools, Classrooms, Interventionists, and Students in the Analytic Sample
District School Classroom Interventionists Student
Oregon (N) 4 14 51 29 965
Boston (N) 2 9 55 42 935
Total (N) 6 23 106 71 1,900
Figure 8. Analytic sample by year and condition. ROOTS Intervention
ROOTS is a 50-lesson Tier 2 kindergarten intervention program developed to employ evidence-based mathematics instruction to support the development of number sense and whole-number concepts (Clarke et al., 2012). From 2012 to 2015, the
intervention was delivered to students randomly selected from the 10 students with the lowest performance on a composite standard score in each participating classroom through a pre-intervention screening.
The composite standard score was formed by combining students’ performance on two mathematics proficiency measures: Assessing Student Proficiency in Early Number Sense (ASPENS; Clarke, Rolfhus, Dimino, & Gersten, 2012) and the Number Sense Brief (NSB; Jordan, Glutting, & Ramineni, 2008)1. Direct math instruction was delivered to participating students in small groups with either a 2:1
1 The creation and use of the composite standard score for treatment assignment will be detailed in the next section.
interventionist ratio (i.e., the high-intensity ROOTS group) or a 5:1 student–
interventioni