Facilitators and barriers to participation in
Lower Secondary Education in Mexico
E
LIAL
ORENAL
OPEZR
AMIREZPhD
D
EPARTMENT OF
E
DUCATION
2
Abstract
This research aimed to explore the factors affecting students‟ educational participation in lower secondary education in Oaxaca, Mexico, for which the identification of factors leading to students‟ educational disengagement became fundamental. Given the stress commentators have given to the influence of socio-economic background on students‟ academic achievement, it became necessary for this study to explore whether students‟ performance would vary if coming from advantaged or disadvantaged backgrounds.
Through the use of semi-structured in-depth interviews, 81 participants (students, parents and teachers), selected through specific criteria, were interviewed in 9 schools from both advantaged and disadvantaged areas. The elements investigated included family, school and community aspects, as well as students‟ attitudinal characteristics, all of which the literatures have identified as influential on educational performance.
Socio-economic background proved to be one of the strongest influential factors, in so far as the educational provision and educational support that coming from a socio-economically advantaged family may offer. Additionally, other aspects of family values influence students‟ individual preferences and aspirations, for example, the environmental stability at home, regardless of family background. School presents two strong determinants that, if adjusted, could ameliorate students‟ educational disengagement; homework and school policies. Positive and negative practices carried out by teachers which influence students‟ educational participation are also outlined.
These findings provide the basis for the development of a strategy to improve the public educational system and to enhance students‟ academic achievement so that they are able to finalise their compulsory education.
3
Contents
FACILITATORS AND BARRIERS TO PARTICIPATION IN LOWER SECONDARY
EDUCATION IN MEXICO ... 1 ABSTRACT ... 2 CONTENTS ... 3 LIST OF TABLES ... 8 LIST OF FIGURES ... 10 ACKNOWLEDGEMENTS ... 11 AUTHOR‟S DECLARATION ... 12 1 INTRODUCTION ... 13
1.1 THE SCOPE OF THIS STUDY ... 14
1.2 OBJECTIVES OF THE STUDY ... 15
1.3 CONTRIBUTION TO KNOWLEDGE ... 15
1.4 STRUCTURE OF THE THESIS ... 16
2 FACILITATORS AND BARRIERS IN SECONDARY EDUCATION ... 18
2.1 EDUCATION AND HUMAN CAPITAL ... 19
2.1.1 Individual and national advantages ... 20
2.1.2 Measurement of human capital ... 20
2.2 THE RIGHTS TO EDUCATION FOR ALL ... 22
2.3 DEFINING COMPULSORY EDUCATION ... 23
2.3.1 Number of years for compulsory education... 25
2.4 PARTICIPATION TRENDS IN COMPULSORY EDUCATION ... 28
2.4.1 Enrolment and educational achievement... 28
2.4.2 Pre-school education ... 30
2.4.3 Primary Education ... 33
2.4.4 Secondary Education ... 37
2.4.5 Inequalities in education ... 43
2.5 DEFINING EDUCATIONAL FAILURE... 49
2.5.1 Underachievement and low achievement ... 49
2.5.2 Dropping out ... 51
2.5.3 School exclusion ... 53
2.6 APPROACHES TO UNDERSTANDING EDUCATIONAL FAILURE ... 55
2.6.1 Ethnicity, class and gender ... 55
2.6.2 The interrelation of family, school and geographical factors ... 64
2.7 CONCLUDING REMARKS ... 83
3 SITUATION OF EDUCATIONAL PROVISION IN MEXICO ... 89
4
3.2 ORGANISATION OF THE MEXICAN EDUCATION SYSTEM ... 90
3.2.1 Brief introduction to Levels of Education ... 92
3.2.2 National Agreement for the Modernisation of Basic Education ... 92
3.2.3 The National Union of Education Workers (SNTE) ... 93
3.2.4 Oportunidades anti-poverty program ... 94
3.3 EDUCATIONAL TRENDS IN MEXICO ... 94
3.3.1 Low performance in PISA ... 95
3.3.2 The problems of year repetition and dropping out ... 96
3.3.3 Advantaged areas versus disadvantaged areas ... 97
3.3.4 Oaxaca: one of the states left behind in Mexico ... 98
3.3.5 Lower secondary school dropout rates are higher in disadvantaged regions .. 100
3.4 CONCLUDING REMARKS ... 104
4 EXPLORING THE DETERMINANTS THAT INFLUENCE STUDENTS‟ DECISION TO DROP OUT FROM SECONDARY SCHOOL IN OAXACA, MEXICO ... 105
4.1 PURPOSE OF THE STUDY AND RESEARCH QUESTIONS ... 105
4.2 THE RESEARCH DESIGN ... 106
4.2.1 Research methods ... 107
4.2.2 Ethical considerations ... 109
4.2.3 The sample ... 110
4.2.4 Ethnicity and socio-economic status ... 112
4.2.5 The site: Oaxaca State ... 113
4.2.6 Criteria for the selection of advantaged and disadvantaged areas ... 114
4.2.7 The selection of schools ... 115
4.2.8 Categories explored ... 115
4.3 PILOT STUDY ... 115
4.3.1 Accessing schools ... 116
4.3.2 Selecting and interviewing participants ... 117
4.3.3 Lessons of the pilot study ... 120
4.4 THE FIELDWORK ... 122
4.4.1 Accessing the schools ... 122
4.4.2 Selecting and interviewing participants ... 123
4.4.3 Challenges to the interviews ... 124
4.5 DATA ANALYSIS PROCEDURES ... 125
4.6 CONCLUDING REMARKS ... 126
5 THE INFLUENCE OF HOME-RELATED FACTORS ON SCHOOL PARTICIPATION AND ACHIEVEMENT... 128
5.1 HOME SOCIO-ECONOMIC STATUS... 128
5.1.1 Parental educational backgrounds ... 129
5.1.2 Parental occupational status ... 130
5.1.3 Cultural capital in the home ... 133
5
5.2.1 Disposition of students towards the completion of homework... 135
5.2.2 The value of a knowledgeable person at home ... 140
5.2.3 Parents‟ inability to help ... 141
5.3 PARENTAL INVOLVEMENT IN THE SCHOOL ... 143
5.4 PARENTS AND THE VALUE OF EDUCATION ... 144
5.4.1 Parents want their children to have better opportunities ... 144
5.4.2 Parental reactions at children‟s willingness to stop school ... 146
5.5 SOCIAL ENVIRONMENT IN THE HOME ... 152
5.5.1 Involvement in housework ... 153
5.5.2 Discipline and parental supervision ... 153
5.5.3 Communication at home: the value of family cohesiveness ... 156
5.5.4 The effect of religion on school involvement ... 160
5.6 HOME INFLUENCED BY COMMUNITY ... 166
5.6.1 Public services ... 166
5.6.2 The culture as a determinant ... 167
5.7 CONCLUDING REMARKS ... 176
6 SCHOOL FACTORS ... 183
6.1 PREAMBLE: TIMETABLES AND SCHOOL CHARACTERISTICS ... 183
6.2 SCHOOL INFRASTRUCTURE ... 184
6.2.1 Poor infrastructure in schools ... 186
6.2.2 Lack of classrooms ... 187
6.2.3 Lack of equipment or material ... 188
6.2.4 Resources not used and lack of maintenance ... 192
6.3 CONTEXTUAL BACKGROUND: TEACHERS OF THE STUDY ... 200
6.3.1 Teachers and school sizes ... 200
6.3.2 Teachers‟ qualifications ... 201
6.3.3 Teachers‟ years of work experience ... 201
6.3.4 Teacher training ... 202
6.3.5 Teachers‟ salaries ... 203
6.4 TEACHING: THE NEGATIVE PRACTICES ... 203
6.4.1 Students and parents‟ perceptions of teachers‟ knowledge ... 203
6.4.2 English as a second language: the „hardest‟ module ... 206
6.4.3 An overloaded lower secondary school curriculum ... 207
6.4.4 School and homework overload ... 208
6.4.5 Workload after the SNTE‟s strike in 2006 ... 209
6.4.6 Teachers‟ pets... 212
6.4.7 The practice of removing a child from class ... 215
6.4.8 School corporal punishment and verbal violence from teachers ... 216
6.4.9 Sexual harassment from male teachers ... 218
6.4.10 Lack of opportunities for teacher‟s training ... 223
6
6.4.12 Low salaries and lack of dedication ... 227
6.5 THE POSITIVE TEACHING PRACTICES ... 229
6.5.1 Committed teachers and strategies to tackle students in academic need ... 229
6.6 EXCLUSIONARY SCHOOL POLICIES ... 231
6.6.1 Suspensions for incorrect dress codes ... 232
6.6.2 Expulsion for anti-social behaviour, marriage and pregnancies ... 233
6.7 OPORTUNIDADES ENHANCES PARTICIPATION ... 236
6.8 A NOTE ON SCHOOL EXPERIENCES ... 238
6.8.1 Relationship with peers and teachers ... 238
6.8.2 Students‟ “best” and “worst” moments in school... 239
6.9 CONCLUDING REMARKS ... 243
7 INDIVIDUAL FACTORS ... 250
7.1 STUDENTS‟ DEMOGRAPHIC CHARACTERISTICS ... 250
7.1.1 Tendencies by age ... 250
7.1.2 Tendencies by languages spoken ... 251
7.2 STUDENTS‟ ATTITUDINAL CHARACTERISTICS ... 252
7.2.1 Patterns of school engagement over the years ... 253
7.2.2 Academic motivation and future aspirations ... 256
7.2.3 The influence of positive role models ... 258
7.2.4 Priorities in life ... 258
7.2.5 Activities outside school ... 259
7.2.6 Paid work ... 259
7.2.7 Involvement with anti-social behaviour... 260
7.2.8 Dating ... 261
7.3 CONCLUDING REMARKS ... 262
8 CONCLUSIONS ... 266
8.1 RESEARCH QUESTIONS AND MAIN FINDINGS ... 266
8.1.1 The interrelation of family, school and geographic factors ... 267
8.1.2 Summary of positive and risk factors ... 270
8.1.3 Generalisability of findings ... 272
8.2 CONTRIBUTIONS TO KNOWLEDGE ... 274
8.2.1 Revision of concepts ... 274
8.3 IMPLICATIONS FOR PRACTICE ... 276
8.3.1 Implications for practice for the schools ... 277
8.3.2 Implications for practice in the communities ... 278
8.4 IMPLICATIONS FOR POLICY MAKERS ... 279
8.5 CRITIQUE OF THE STUDY ... 279
8.6 AVENUES FOR FURTHER RESEARCH ... 280
LIST OF ABBREVIATIONS AND DEFINITIONS ... 282
7
LIST OF REFERENCES ... 285
APPENDIX 1. INTERVIEW GUIDES FOR THE PILOT STUDY ... 297
APPENDIX 2. INTERVIEW GUIDES FOR THE FIELDWORK ... 301
APPENDIX 3. SCHOOLS‟ PROFILE ... 306
APPENDIX 4. REASONS REGISTERED BY SCHOOLS WHY STUDENTS LEFT SCHOOL BY MAY/JUNE OF THE ACADEMIC YEAR 2006-2007 ... 308
8
List of tables
Table 1. Countries constitutional guarantees of free and compulsory education for all
children, 2001. ... 25
Table 2. Official duration of full-time compulsory education of some OECD countries. ... 27
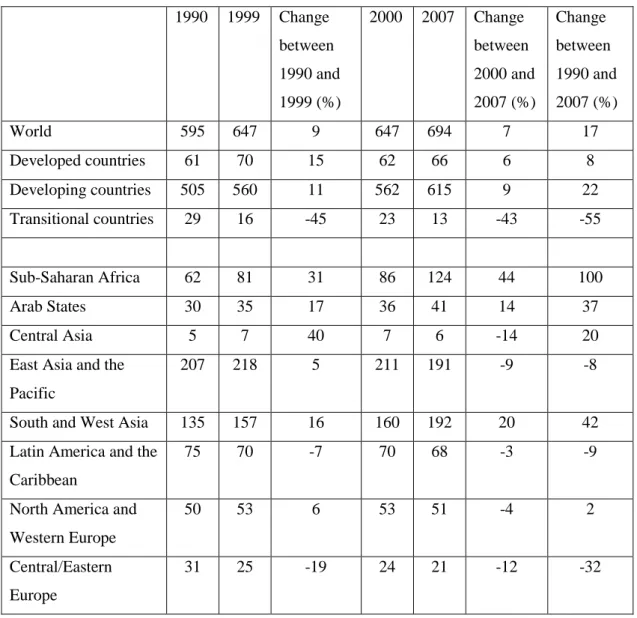
Table 3. Total primary school enrolments (millions) by region, for school years ending in 1990, 1999, 2000 and 2007. ... 34
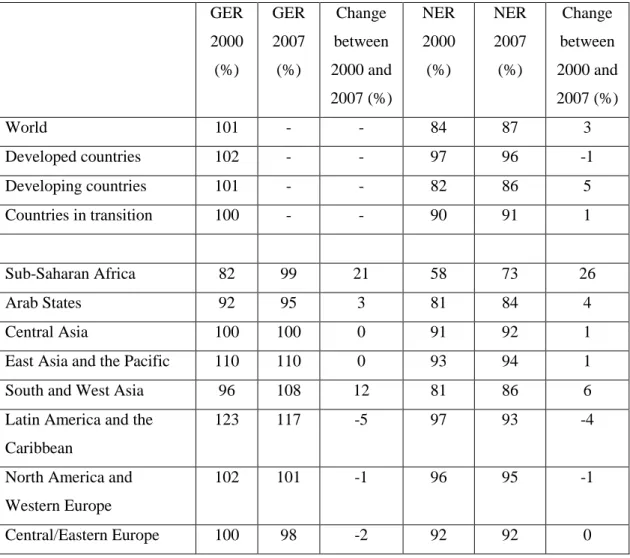
Table 4. Primary gross and net enrolment ratios by region, for school years ending in 2000 and 2007. ... 35
Table 5. Primary gender parity index (GPIs) of net enrolment ratios (NERs) ... 37
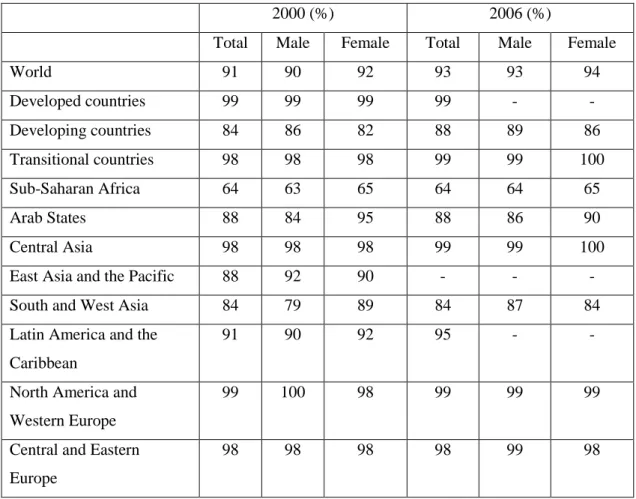
Table 6. Transition rates from primary to secondary education 2000 and 2006... 39
Table 7. Total secondary school enrolments (millions) by region, 1999 and 2007. .. 39
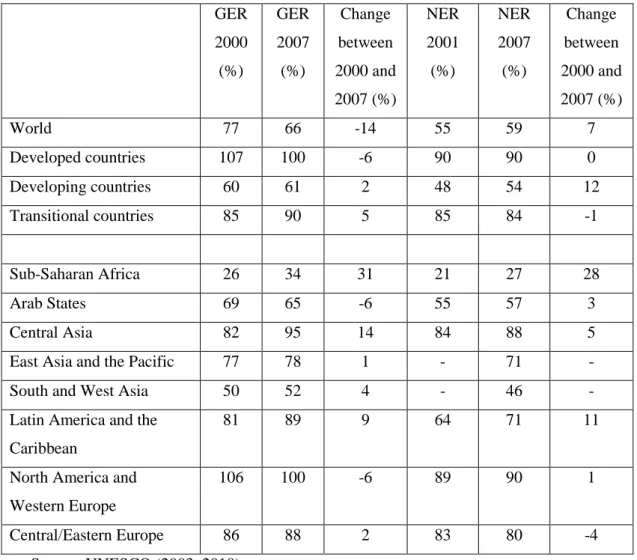
Table 8. Secondary education gross and net enrolment ratios by region, for school years ending in 2004 and 2007... 40
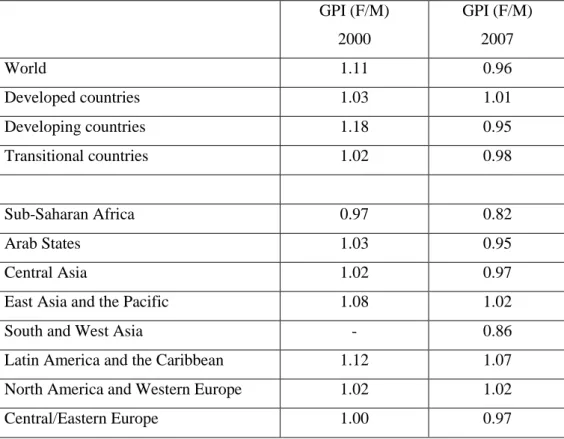
Table 9. Gender parity index (GPIs) of net enrolment ratios (NERs). ... 42
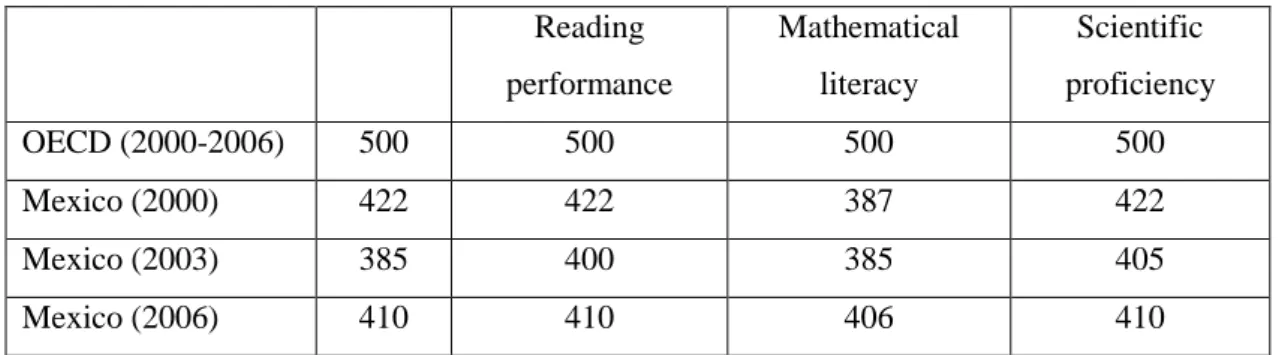
Table 10. Mexico‟s mean scores of student performance in PISA 2000, 2003 and 2006. ... 96
Table 11. PISA 2006, Science mean scores in most advantaged and least advantaged entities in Mexico. ... 98
Table 12. Net Enrolment Rates (NER) for primary and lower secondary education disaggregated by gender for three academic cycles. ... 100
Table 13. Trends in dropout rate (a) in Mexico for 2004/2005, 2005/2006 and 2006/2007 disaggregated by gender... 102
Table 14. Trends in dropout rate (b) in Mexico for 2005/2006 and 2006/2007 disaggregated by gender. ... 103
Table 15. Initial sample design of schools and participants to be targeted per school. ... 112
Table 16. Pilot study participants. ... 119
Table 17. Summary of pilot and fieldwork participants. ... 123
Table 18. Educational levels of parents in the study. ... 129
Table 19. Parental educational background by area... 130
Table 20. Parental occupations. ... 131
Table 21. Occupations by area ... 132
Table 22. Percentages of interviewees‟ professed religions. ... 161
9
Table 24. Religion per family of interviewees. ... 162
Table 25. Schedules by type of lower secondary schools. ... 183
Table 26. Percentage of lower secondary schools (by type) that have a Computer Room, Library and Physics/Chemistry/Biology Laboratory. ... 185
Table 27. School facilities reported as in lacking, bad condition and lack of maintenance... 186
Table 28. Number of teachers working in each participating school. ... 201
Table 29. Years of experience of teachers interviewed. ... 202
Table 30. Students‟ perceptions on teachers‟ knowledge. ... 203
Table 31. Students‟ ages in relation to their school year. ... 251
Table 32. Students‟ ages in relation to their school year by area. ... 251
Table 33. Languages spoken by students. ... 252
Table 34. Participants who responded the question of module failure and year repetition. ... 253
Table 35. Students who “have” or “have not” failed a module or who have been held back a year in school at some point in their lives, disaggregated by area... 254
Table 36. Students who “have” or “have not” failed a module or who have been held back a year in school at some point in their lives, disaggregated by gender. ... 255
Table 37. Students with role models and students without role models. ... 258
Table 38. Students with a paid job and without paid jobs disaggregated by gender (Male (M), Female (F)) and area (Advantaged Areas (AA), Disadvantaged Areas (DA)). ... 260
Table 39. Students who were involved in romantic relationships. ... 262
Table 40. Facilitators and risk factors to educational performance in lower secondary schools in Oaxaca, Mexico. ... 271
10
List of figures
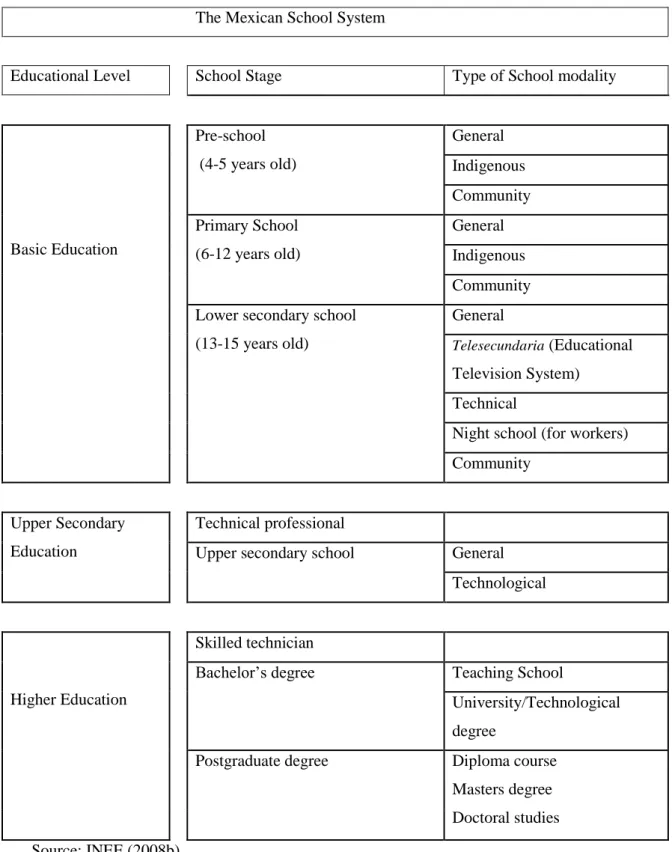
Figure 1. Illustration of the Mexican School System by educational levels. ... 91 Figure 2. Parental occupations by gender in advantaged areas (AA) ... 132 Figure 3. Parental occupations by gender in disadvantaged areas (DA) ... 132
11
Acknowledgements
This research was possible thanks to the financial support provided by the Mexican Council for Science and Technology (CONACyT).
First of all, I would like to thank Dr .Francisco Cos-Montiel for his support in my aspiration for a PhD.
Special acknowledgments go to Professor Gary Orfield, UNESCO and UNESCO-UIS for providing me with relevant books and publications for my research.
I particularly wish to thank my academic supervisor, Professor Judith Bennett. This thesis would not have been possible without her academic guidance and personal support. She has encouraged me with a balance of discipline and guidance and there was no question that she did not respond helpfully.
Thank you to Dr Vanita Sundaram, whose academic contributions were invaluable. I also appreciate her being almost a personal mentor who always listened, advised and helped.
I would also like to show my gratitude to the always supportive staff of the Department of Education at the University of York.
I wish to thank my initial supervisors, Professor Stephen Gorard and Dr Emma Smith, who encouraged me to go for a project this ambitious.
I am extremely grateful to the heads of schools in Mexico for welcoming my project and for allowing me access to their facilities. Most of all, I thank all the participants of this study (students, parents, teachers) for sharing their time and every day experiences with me.
I wish to thank my best friends in the United Kingdom, for helping me through difficult times, and for all the emotional support, camaraderie and the caring they provided.
I would like to thank my husband, Michael Dobson, for his love and support over the past four years - and for the years to come -, and who patiently proof-read this entire thesis.
Finally, I dedicate this work to my family; to my late father, Enrique López, my brothers Enrique and Manuel, especially to my mother Margarita Ramírez, and my grandmother, Bertha López.
12
Author‟s declaration
I hereby declare that I am the sole author of this thesis. This is a true copy of the thesis, including any required final revisions, as accepted by my examiners.
13
1
Introduction
The Universal Declaration of Human Rights of 1948 stated that basic education should be free and mandatory, at least at the elementary and fundamental stages. Therefore, achieving universal provision of compulsory education is a top priority for most developing countries. Over the past two decades, the length of basic education has been extended and lower secondary education has been increasingly positioned as the immediate prolongation of primary education (UNESCO-UIS, 2004 in UNESCO, 2005), as in the case of Mexico since 1993.
Educational statistics in Mexico reveal that children in socioeconomically disadvantaged areas struggle to conclude lower secondary education. Although the country has moved forward with figures of enrolment in primary and secondary education increasing over past decades, overall national averages may not reflect regional variations. By 2005, for example, 82 percent of children of eligible age (3-15) to attend lower secondary school were enrolled at this level, however, disadvantaged states such as Oaxaca and Chiapas showed attendances of 81 and 76 percent respectively. These outcomes seem to reflect international patterns where transition rates into secondary education are usually always above 95% in industrialised and developing economies, and almost always above 50% in other regions (UNESCO, 2003:66). Additionally, national statistics show that this level of education is the stage at which different determinants appear to hinder educational performance.
The main purpose of this study is to investigate the reasons behind the non completion of lower secondary education in Mexico when both the Universal Declaration of Human Rights and Article 3 of The Political Constitution of the United Mexican States declare that basic education is compulsory.
This research is particularly important in the context of the situation in Mexico, for three main reasons. Firstly, because its focus was on lower secondary education, a level which not only international literature reports as one in which problems of school participation become apparent, but a level that the Mexican education system recognises as one of its current challenges. Secondly, because this level of education has not been studied by educational researchers in Mexico to the extent other levels of education have (Sandoval, 2002). Finally, the findings suggest that not only do essential adjustments need to be made in the systems in which children perform (in terms of family, school and community), but they also flag the urgency of redefining
14
educational concepts such as homework, teaching practices and school policies since their current conception hinder children‟s school performance.
1.1
The scope of this study
Because the literature on school failure is very broad and because educational failure at the basic levels has not been studied in depth in Mexico, it was necessary to evaluate different sources to decide which aspects were the most relevant to set out the grounds of this research. Thus, researching the reasons why children struggle to conclude their basic education meant starting a study with limited advantage. One of this study‟s main attributes therefore is its scoping nature, which at the same time entails that the findings not only establish the foundation for further research but it also represents a breakthrough in research on factors affecting educational failure at the basic levels of education in Mexico.
The literature on school failure is very broad and it can be said that the three main aspects that have been investigated throughout the years are associated with low academic achievement, dropping out, and more recently, school exclusion. The first two have mainly been approached by both so-called quantitative and qualitative approaches, while the last one, mainly through the latter approach.
The literature commonly suggested that the problem of school failure derives from more than one source. Although the initial idea entailed investigating factors that hinder lower secondary school students‟ completion of this level of education, the literature shed light on the act of “dropping out” as being the culmination of a cumulative process of disengagement from school. Therefore, it became impractical to look only at “dropping out” whilst disregarding the disengagement processes involved. Moreover, it also represented an opportunity to explore the positive factors influencing educational performance.
Authors such as Gillborn and Mirza (2000); Halsey, Heath and Ridge (1980); Epstein, Elwood, Hey, and Maw (1998), through more preordinate methodologies, have studied the influence of demographic characteristics such as socio-economic background, ethnicity and gender and have identified them as being significant in explaining differences between educational outcomes. On the other hand, authors such as Ekstrom, Goertz, Pollack, & Rock (1986); Finn (1993); Orfield (2004); Rumberger (1983, 1987, 2004); Osler and Vincent (2003); Osler (2006), through more contextual and comprehensive approaches, have analysed the influences of family, school, geographical and behavioural factors to explain educational failure.
15
Thus, the two main spheres that the literature pins as being influential on school accomplishment, irrespective of the methodological approaches undertaken, are demographical characteristics, and contextual characteristics, including how individuals function in such contexts.
Different elements of family, school, individual and geographical characteristics, suggested by international literature, were to be explored in Mexican secondary schools. Given the important effect that socio-economic conditions have on students‟ educational participation, it was considered pertinent to control for disparities in both advantaged and disadvantaged contexts.
1.2
Objectives of the study
This study was conducted in the State of Oaxaca, where statistics for academic reprobation and dropping out at all levels of education are amongst the highest in Mexico, figures that become increasingly apparent at the lower secondary education level. Thus, through semi-structured interviews with students, parents, teachers and social workers, elements of demographic (socio-economic status, gender, age, etc.) and contextual characteristics (including school and family dynamics) were explored in advantaged and disadvantaged locations of the State. Given the scoping nature of the study, the objectives were also of a broad nature and are listed below:
Identifying the factors leading to students‟ disengagement from lower secondary schools;
Identifying the factors facilitating students‟ educational performance in lower secondary schools; and
Examining the extent to which such factors varied depending of socio-economic background
1.3
Contribution to knowledge
As envisaged, this study disclosed that educational failure can have diverse lines of reasoning. It also unveiled which of the factors signalled by the literature, influence educational failure in the context of Mexico and how. Also, these factors were linked to the three main areas explored (schools, family and geographical location). Nevertheless, this study offers two main contributions to knowledge. The first sheds light on key concepts identified in each of the areas explored and that need urgent revision and redefinition; the conception of „homework‟, „family‟ „school support‟ in
16
the collective conscious of teachers, parents and students proved to represent a patent limitation to the learning processes of children. The second contribution provides insights into the power that school practices and policies have on children‟s educational outcomes.
It is important to mention that, although major aspects influencing educational failure in the Mexican context were disclosed in this study, its broad scope and consequently the extensive nature of its findings require future work to explore such influential factors in greater depth.
1.4
Structure of the thesis
The thesis is divided into eight chapters, with the first chapter being the introduction. Chapter two describes what the literature review has said in relation to educational performance and its relevance to human capital, and to the legal texts describing „compulsory education‟ as being mandatory. The definition of educational participation for the study is presented, as well as the trends for participation in developed and developing nations at basic educational levels. The section also presents the definition of educational failure for this study, and the main theories through which other authors have strived to explain it.
Chapter three focuses on educational provision in Mexico, illustrating the organisation of its education system, followed by describing of important constitutional reforms that the system has undergone following the National Agreement for the Modernisation of Basic Education in 1992. The education system‟s challenges and aspirations relating to international commitments regarding basic education are also outlined. The final part of this chapter provides an overview of the educational challenges faced by children attending basic education in developed and disadvantaged regions of the country.
Chapter four outlines the research strategy and methods used to explore the factors affecting students‟ performance at lower secondary level in Mexico, describing the purpose of the study and the rationale behind the research design. A further section gives account of the conduct of the pilot study and fieldwork, followed by the tools employed for analysing the collected data. The final section discusses the main challenges and strengths of the research design.
Chapter five presents the family factors identified as being influential on students‟ school performance, outlining those factors that either facilitate or hinder participation and achievement in school, along with the definition of „family‟ used in
17
the study. Subsequently, the role that homework plays in the lives of lower secondary students is analysed, and the influence cultural capital has at home, and how it impacts students‟ school work. Also described are the relationships found between parental involvement in schools, their views on education, and their children‟s educational attainments. Aspects of household dynamics are also examined, as well as the influence of the communities‟ socio-economic and cultural traditions. The final section presents a summary and discussion of findings and implications for policy and practice.
Chapter six covers school factors found as being influential on students‟ educational outcomes. Firstly, it accounts for the ways in which school infrastructures affect students‟ achievement and attendance. Subsequently, the characteristics of teachers in the study are presented along with the teaching practices that have positive and negative effects on students‟ performance. This chapter also presents the way in which school policies affect students‟ permanency in school. The last section of this chapter summarises and discusses the findings as well as potential practice and policy implications.
Chapter seven classifies students‟ personal attributes; the demographic characteristics and personality traits shared by “successful” and “less successful” students. The following section describes students‟ level of academic attainment over the years, and their short and long-term aspirations. Students‟ after-school activities, their involvement in employment, anti-social behaviour and dating, are also accounted for. The final section provides a summary and analysis of students‟ academic and behavioural traits identified as influential in the way they approach education and implications for families and schools.
Chapter eight concludes the study by reviewing the initial objective and research questions, followed by an analysis of the main findings and the extent of the grounds for generalisation and transferability. This chapter also presents a discussion of the contributions and implications drawn from the study to the area of participation in lower secondary education in Mexico, as well as an outline of advice suggested to policy makers. The final aspects comprise a consideration of advantages and limitations of the study, and an illustration of important avenues for future exploration.
18
2
Facilitators and barriers in secondary education
The purpose of this chapter is to describe what the literature review has said regarding educational performance, namely what facilitates it and what diminishes it. The chapter starts by explaining the relationship between education and human capital; the benefits that human capital brings to nations; how it is normally measured and how it is being measured at the international level. The second part recounts the historic and legal platform of the rights to free and compulsory education for all, on which this research is founded, and how the provision and enjoyment of such rights nowadays are chief commitments of national governments. The third part of this chapter defines compulsory education; the way it has historically and legally become a fundamental responsibility of all nations; the way it has evolved in other nations‟ educational systems, illustrating trends of compulsory education participation in different countries. The fourth part defines educational participation as comprising enrolment and academic achievement and it also illustrates general trends in developed and developing nations from pre-school education throughout secondary education. Patterns of gender parity are also considered. The section concludes with the description of the more prevalent types of educational inequalities: gender disparities, poverty and disabilities. Furthermore, education quality is presented as the way of measuring equality or inequality in education. The fifth part describes the aspects comprising educational failure: low achievement, school exclusion, and the issue of „dropping out‟, and how such aspects are measured in education. The final part of the chapter presents an analysis of the different approaches that aim to explain the factors responsible for educational failure. Two main approaches are put forward; firstly, the frequent approach used in quantitative educational methodologies: by associating (1) ethnicity; (2) social class; and (3) gender, with aspects of student achievement. For this, different studies are described and the associations identified will be outlined. The second approach covers four main spheres; (1) the family; (2) the school; (3) the community; and (4) the individual, as well as sub-aspects of these elements. At the same time, the family and school are argued to be part of a larger (a) „institutional‟ dimension which includes the geographical location of the community; and (b) an „individual‟ dimension comprising the behaviours and attitudes of students. Such factors and sub-factors (i.e., family composition, school resources, student ambition, etc.) are believed to influence students‟ academic performance. This approach also considers ethnicity, socioeconomic status (SES) and gender elements; however, given the
19
complex number of factors involved, it applies more with qualitative studies. The end of the chapter summarises and reflects on the main facilitators and barriers identified as being influential in students‟ educational outcomes.
2.1
Education and human capital
It has been demonstrated that access to education prepares individuals with substantial knowledge and abilities to perform rationally and function judiciously in any social nucleus, and so contributing to the development of the wider society. Education per se entails meaning and worth to every person, without exceptions according to UNESCO (2002). It also recognises education as the necessary tool that helps to unravel and secure other human rights such as “the rights to good health, liberty, security, economic wellbeing and participation in social and political activity.” (p.30). Becker (1993) and Keeley (2007) provide important examples: educated people smoke less and exercise more; also, they become more involved in community projects. It is without doubt a tool which certainly decreases mortality and crime rates, pollution, to mention a few; one which increases political involvement and consequently, one which promotes a more democratic state.
It is well known that Adam Smith defined three factors of production: land, labour and capital goods (Smith, 1999). Later, and based on Smith‟s approach, a fourth factor was added: entrepreneurship, which is the motivational aspect that enables projects to become a reality. Over fifty years ago, based on Theodore Schultz‟s approach regarding the value of people, human capital was also considered a crucial factor of production (Keeley, 2007).
The OECD (2001) defines human capital as “the knowledge, skills, competencies and attributes embodied in individuals that facilitate the creation of personal, social and economic well-being” (p. 18). Education (knowledge and skills) is therefore a crucial part of human capital; human capital brings economic growth which is one of the ultimate goals that nations aspire to. In a nutshell, “education is investment in human capital” (Halsey et al., 1980:2). In addition, it could be argued that the accumulation of knowledge and skills commences at birth and ends at death (OECD, 2001). Consequently, nations aim to ensure that children and adults can access a wide variety of educational opportunities (OECD, 2009a); representative developed governments such as Australia, New Zealand and the United Kingdom for instance, regulate their educational policies based on the criterion that national growth relies
20
on high levels of knowledge and skills (Mahony P. in Epstein et al. 1998; Rumberger (2001).
2.1.1 Individual and national advantages
It has been said that human capital provides economic and social benefits; at the individual level it is expected that those more educated, or with at least, basic education, will not only have greater opportunities to find better paid jobs but will also have the opportunity to increment their levels of human capital through further formal or informal „on-the-job‟ training. In comparison, those with low academic proficiencies, especially adults, will be at greater risks of facing unemployment and social exclusion (Steedman, 1996 in OECD, 2001; Orfield, 2004).
Not only does formal education, such as completing compulsory schooling or attending university, bring immediate economic benefits such as higher salaries, it also brings cultural capital (family habits and cultural assets) to their homes; and thus, habits and cultural practices are reproduced within the family and in the society, even practices such as “the appreciation of classical music, literature and even tennis” (Becker, 1993: 21).
Another reason why education is a concern for governments is that people who do not have adequate skills to find employment result in greater national expenses; as pointed out in the previous paragraph, they become less likely to be part of a qualified work force and therefore, less likely to hold well paid jobs, more prone to unemployment, and consequently, costing the government money such as benefits and unemployment allowances (Rumberger, 2001; Rumberger, 2004). Therefore, free and compulsory education can decrease the levels of child labour and consequently improve school attendance rates (UNESCO, 2007). It can also help people benefit from considerable earning gains the higher the educational levels they attain (OECD, 2009b) and therefore decrease youth unemployment rates, one of the most common problems that governments face worldwide (UNESCO, 2010).
2.1.2 Measurement of human capital
Knowledge, skills, and competencies of individuals are usually measured by educational attainment, such as diplomas or certificates. These three attributes could also be built through experience or informal training, which also represent human capital. A difficulty emerges when, as OECD (2001) observed, educational credentials vary from country to country, thus leaving little proxies for comparison.
21
The most common methods used are international evaluations such as the Programme for International Student Assessment (PISA), the Trends in International Mathematics and Science Study (TIMSS) or the International Adult Literacy Survey (IALS). Although they merely measure a number of skills and competences, OECD (2001) indicates aspects of their limitations: the sample sizes, the variables inspected and the number of countries participating (OECD, 2001). Despite these limitations, it should be noted that through these methods of measuring attainment, the improvement of human capital and the economic growth rates can therefore be estimated (UNESCO, 2004; OECD, 2009b).
An example of this can be given by OECD (2009a) with regards to global upper secondary education rates; the proportion of the adult population below that level of education went from 37 percent in 1997 to 30 percent in 2009. On the other hand, the figures for the Czech Republic, Finland, Hungary and Poland demonstrated that the levels of their population that were below upper secondary education decreased by around 5 percent over the last decade. Generally, populations who have not completed upper secondary education have decreased by an average of 2 percent per year between 1998 and 2006, and nations whose labour markets contained populations below the level of secondary education decreased considerably over the same period, except for countries including Germany, the United States, Japan, Mexico, Poland and Turkey (OECD, 2009a). Another example is Mexico‟s human capital by 2007, which was the lowest in the OECD and which has had, according to OECD (2007), a slow improvement over the recent decades, if compared to nations such as Korea, Spain and Greece.
Another problem with this approach addressed by UNESCO (2004) is that measuring knowledge and skills through the number of years in school is a very harsh measure principally in a global context, given the significant differences in the resources allocated to the educational systems and the different levels of poverty.
Finally, it is reasonable to say that despite human capital being a crucial factor of economic growth, there are other factors that nations depend on for this, factors including demography, technological modernisation, market-trade policies, and crucially, political and legal systems (Keeley, 2007). However, it is undeniable that a highly educated society can bring innovation for industry, boost productivity and a rapid introduction of state of the art technologies (UNESCO, 2004). Given that nations‟ most essential assets are not their natural resources or geographical location, but people‟s human capital, creating the means to battle the inequalities of access to
22
schooling can help to create the means to economic and social progress (UNESCO, 2010). Moreover, the empowering of disadvantaged groups such as women, the disabled, indigenous peoples and the poor also comes along with the augmentation of human capital.
2.2
The rights to education for all
As mentioned previously, education has been declared a universal right in the Universal Declaration of Human Rights (1948), a document through which respective national representatives established that elementary stages of education should be free and compulsory. Both international treaties such as the International Covenant of Economic, Social and Cultural Rights (ICESCR), the Convention on the Rights of the Child (CRC), or the Convention on the Elimination of all Forms of Discrimination against Women (CEDAW) and international agreements such as the Vienna Declaration and Programme of Action (1993) or the Beijing Declaration and Platform for Action (1995) are instruments that encourage access and equality in education.
More recently, the 'World Declaration on Education for All' and a 'Framework for Action' was adopted in Jomtien, Thailand in 1990, and thereby the target of attaining universal primary education (UPE) by 2000 was agreed on. Later, in 2000, representatives of 164 countries, including heads of state, teachers, non-governmental and international organisations, congregated in Dakar, Senegal, for the World Education Forum, where the Education for All (EFA) goals were set. These goals focused on access to education, literacy, gender equality in the search of development of capabilities for young and adults. The same year, at the United Nations‟ headquarters, New York, world leaders, through the eight Millennium Development Goals (MDGs), asserted the efforts to eradicate extreme poverty, to alleviate health and educational deficiencies, to mention some, by 2015.
Based on the existence of these international instruments, the second and fifth EFA Dakar goals, but mainly on Article 26, section 1 of the Universal Declaration for Human Rights are taken as a departure point for this study:
EFA Goal 2. Ensuring that by 2015 all children, particularly girls, children in difficult circumstances and those belonging to ethnic minorities, have access to and complete free and compulsory primary education of good quality.
23
EFA Goal 5. Eliminating gender disparities in primary and secondary education by 2005, and achieving gender equality in education by 2015, with a focus on ensuring girls‟ full and equal access to and achievement in basic education of good quality.
Universal Declaration for Human Rights, article 26, section 1. Everyone has the right to education. Education shall be free, at least in the elementary and fundamental stages. Elementary education shall be compulsory. […]
Given that providing access to education to all is a commitment of national governments, such governments therefore become accountable to the objectives of national and international human rights agreements by translating them into national legislations in favour of their citizens (UNESCO, 2002)
The Education for All (EFA) global initiative has boosted national efforts significantly. However, the fact that more than 60 years later these goals have not yet been achieved are a clear indicator that extraordinary efforts need to be made, especially in the less developed nations. Therefore, it is imperative that the instruments and policies implemented to achieve these goals are constantly observed and evaluated against the Dakar objectives and other international treaties and agreements.
2.3
Defining compulsory education
Compulsory education refers to the number of years that the population of a given country are legally required to attend school. Ideally, all people in the world would be able to exercise their right to complete at least pre-school, primary and secondary education. Justifying a given number of years in education dates back to 1962; international treaties re-asserted article 26 of the Universal Declaration of Human Rights with regards to the right to free and compulsory education; the UNESCO Convention against Discrimination in Education that year, is recorded as one of the earliest international treaties guaranteeing free and compulsory education. In 1966, the International Covenant on Economic, Social and Cultural Rights (ICESCR) introduced the concept of “progressive introduction of free education” in secondary and higher education. Other treaties followed in Europe, North America and Africa, enabling their economic, social, civic, and cultural rights to be included in their legislations. The Convention on the Rights of the Child (CRC) in 1989 incorporated such rights, including political rights, and this special convention emerged because of
24
the extra care and special protection that children, as a vulnerable group, require. This convention was ratified by the highest number of nations (191) in 1999. These official treaties establish the international legal framework of the fundamental requirements and obligations to guarantee free and compulsory education for all children (Tomaševski, 2001).
By 2001, 15 countries including Finland, France, Norway, Sweden, Australia, Chile, Ecuador, and Algeria, had set up new regulations to comply with international procedures to promote economic, social and cultural rights, particularly the guarantee of free and compulsory education. Although the majority of nations (106) such as Austria, Canada, Brazil, Mexico, Barbados, Egypt, the United Kingdom, had complied with “some” international procedures and allowed citizens with full access to the aforementioned rights. In contrast, 52 countries including Bangladesh, Belize, China, Cuba, Japan, the United States, etc. were not implementing specific courses of action to alleviate such human rights violations (Tomaševski, 2001).
Since the right to free and compulsory education has been legislated by a large number of countries, it is generally expected that the obligations stay counterbalanced between parents and schools. From the Report on the Regional Conference on Free and Compulsory Education in Latin, in (Tomaševski, 2001:13) it is established that:
“Just as school legislation imposes upon the parent the duty of sending his children to school, States should accept the obligation of providing enough schools to educate all children.”
Tomaševski (2001) also acknowledges that no one can be obliged to do “the impossible” (p.13); and thus, if parents are not able to afford the economic expenses derived from sending their children to school, they cannot be coerced to accomplish such legal entitlements. Stromquist (2001), in her discussion of poverty and girls‟ education in Latin America, points out that although slow educational progress has been made, education cannot be portrayed as universally free and compulsory worldwide. She argues that the latter statement is rather chimerical, given that parents are expected to supply their children with uniforms, books and school materials, which represent considerable costs for the economically disadvantaged. Another important point that Stromquist (2001) makes is that school attendance is not actually obligatory in developing countries.
25
2.3.1 Number of years for compulsory education
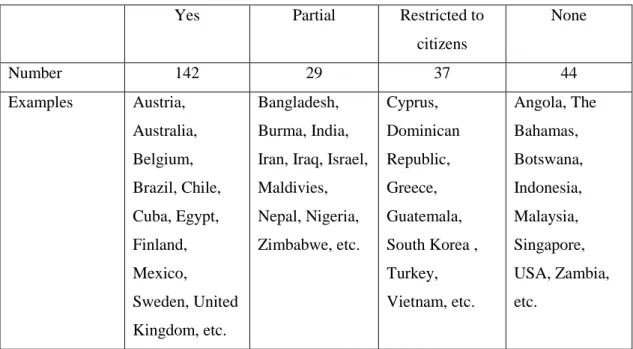
Compulsory education differs in terms of ages in different countries; it ends at age 14 in South Korea, Portugal, Turkey and Brazil, for example, yet it ends at age 18 in Belgium, Germany, Hungary, the Netherlands and even Chile (OECD, 2009a). Given that education shall be free and compulsory and provided by governments, one main limitation is that not all governments have implemented formal procedures to eliminate basic human rights violations like non-access to education. Some nations have modified their legislations to implement solutions within the framework of the international agreements to promote access and permanency in education. Tomaševski (2001) provides details of the countries‟ constitutional agreements and which are organised in Table 1, which shows that a significant number of countries have committed, at least on paper, to the provision of free and compulsory education. However, a significant number of countries are either in the process of complying with such guarantees or have such guarantees limited to their citizens or residents only. Such situations increase inequality of access given that immigration and giving refuge to asylum seekers are phenomena that happen in virtually every nation.
Table 1. Countries constitutional guarantees of free and compulsory education for all children, 2001.
Yes Partial Restricted to
citizens None Number 142 29 37 44 Examples Austria, Australia, Belgium, Brazil, Chile, Cuba, Egypt, Finland, Mexico, Sweden, United Kingdom, etc. Bangladesh, Burma, India, Iran, Iraq, Israel, Maldivies, Nepal, Nigeria, Zimbabwe, etc. Cyprus, Dominican Republic, Greece, Guatemala, South Korea , Turkey, Vietnam, etc. Angola, The Bahamas, Botswana, Indonesia, Malaysia, Singapore, USA, Zambia, etc.
Extending compulsory education
The majority of international agreements on free and compulsory education, starting from the Universal Declaration of Human Rights in 1948, specified primary education as basic and therefore, as the compulsory phase of education. However, in
26
countries such as the United States and France, secondary education has been part of compulsory education since the 1600s and the beginning of the 1900s respectively. In the United States, however, Massachusetts was the first state to legally implement school attendance laws, which included secondary school, in 1853. The International Review of Curriculum and Assessment Frameworks Internet Archive‟s (INCA) database provides a few examples of the dates when countries extended the years of compulsory education; France, for example, lengthened it from age 14 to 16 in 1967; Germany, to 9th grade (ages 6 to 12) in 1970, yet students attending the Gymnasium school are expected to finish at age 18, since 1982; Italy extended it to age 16 in 2009; the Netherlands to age 17 in 2007; the United States varies between its 50 States, from age 16 in Kansas (since 1852) or age 18 in Connecticut (in 1872). Examples from Latin America include Mexico and Chile extending compulsory education to lower secondary school (from ages 11 to 14) in 1993 and 2003 respectively.
More recently, the Council of Europe, through the European Social Charter of 1966 (Revised) instituted primary and secondary education as free of charge and compulsory, calling for the reduction of non-attendance in school and dropout rates in the same levels of education. Gradually, the length of basic education has been extended to lower or upper secondary school. Secondary education is increasingly being positioned as the immediate prolongation of primary education. Due to the different categorisation of compulsory education as in “basic” or “fundamental”, countries are currently grouped as those with primary school as compulsory education, and those with compulsory education further than primary school, i.e., lower or upper secondary school (Tomaševski, 2001). As expected, compulsory education in countries from the developing world have an equal length of primary schooling. Examples of a small number of OECD countries and their official durations of compulsory education are presented in Table 2.
Generally, participation rates have a propensity to be high at the latter stages of compulsory education in the majority of OECD countries. However, participation rates reach below 90 percent towards the end of compulsory education in countries like Belgium, Germany, Hungary, Turkey, the United States, Mexico and Chile (OECD, 2009a). One of the possible explanations for why, in such nations, more than 20 percent of the population aged 15 to 19 is out of school (OECD, 2009a) could be explained by the age at which they end their fundamental education. Nevertheless, from a similar standpoint, such as that of Stromquist (2001), it could
27
be argued that poverty and educational policies (i.e., not enforcing compulsory education lawfully), may be decisive factors in determining school participation.
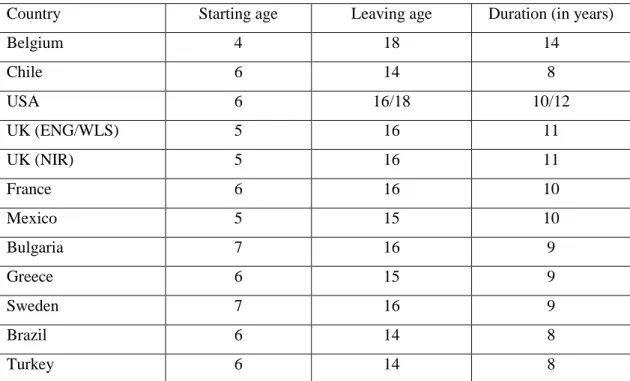
Table 2. Official duration of full-time compulsory education of some OECD countries.
Country Starting age Leaving age Duration (in years)
Belgium 4 18 14 Chile 6 14 8 USA 6 16/18 10/12 UK (ENG/WLS) 5 16 11 UK (NIR) 5 16 11 France 6 16 10 Mexico 5 15 10 Bulgaria 7 16 9 Greece 6 15 9 Sweden 7 16 9 Brazil 6 14 8 Turkey 6 14 8
Compulsory school stages
A brief description of the importance of the stages of education largely considered as compulsory education was considered supplementary in this section. Pre-school education is considered a critical stage to prepare children physically and mentally, and one which provides children with the prospects to improve and develop their learning experiences at home, and at the same time, to help decrease illiteracy and poverty (OECD, 2009b).
Primary and secondary education, on the other hand, comprises the grounds of the development of innumerable competencies and skills that prepare children to lifelong learning and to be highly productive citizens (OECD, 2009b). Needless to say that these levels of education also prepare students to acquire further advanced knowledge and skills in tertiary education. For this study, the objective is to report on lower secondary education, as the majority of nations still consider it as being legally compulsory (UNESCO, 2004) and, in the majority of nations worldwide, which account for almost 80 percent of children of secondary school age, lower secondary education is the last stage of compulsory education (UNESCO-UNEVOC/UIS, 2006 in UNESCO, 2007).
28
2.4
Participation trends in compulsory education
The goal of making educational opportunities accessible to all can become tangible when youths and adults have free and full access to education. Based on the EFA goals, participation comprises enrolment, academic attainment and completion in all educational levels: pre-school education, primary school, secondary and tertiary education.
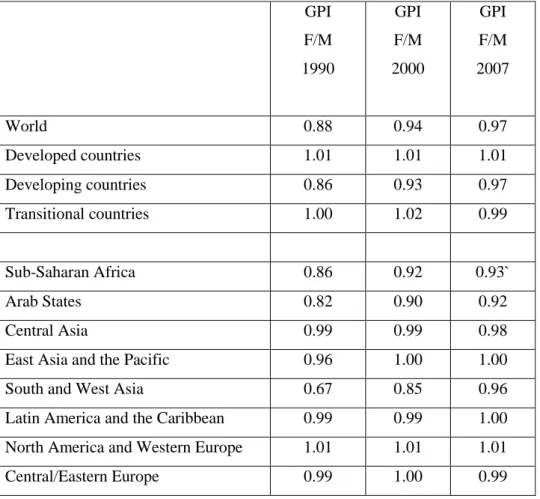
The first Dakar goal includes the expansion and improvement of comprehensive early child care and education with special attention given to the more vulnerable and disadvantaged children. An important relationship exists between children‟s early years and their physical and psychological development (UNESCO, 2008). The second Dakar goal focuses mainly on girls‟ access and permanency to a free and compulsory education of good quality, by 2015. Universal Primary Education (UPE) is expected to be achieved when all children of eligible age enrol and complete six years of this level of education (UNESCO, 2004). As for the third goal, it focused on eliminating gender disparities in both primary and secondary education by 2005, a goal that the majority on countries are still counting on to achieve. This goal also aspires to achieve gender equality in education by 2015, with particular attention on favouring girls‟ access to and achievement in basic education. In this sense, gender parity promotes that the same number of girls and boys, relative to their respective age groups, participate in the education system. Gender equality, on the other hand, means that girls as much as boys, will have equal opportunities to access education and for achievement, and to experience equal treatment (UNESCO, 2003).
2.4.1 Enrolment and educational achievement
In response to the international commitments to boost educational participation, nations have increased efforts to gather enrolment and achievement data and to make them more accessible to the domestic and global community. Both enrolment and achievement are clear indicators of the status of educational participation, as well as dropping out rates. However, as not all governments are able to provide accurate data on the number of children who leave school before completion, this section of the literature review will contain data on enrolment and academic achievement, and dropping out rates will be described in the section of educational failure.
29
Enrolment rates
Enrolment, according to UNESCO (2004), is the most critical aspect of school participation and “the most easily measurable indicator of progress towards UPE” (p.90). To measure enrolment in the education sector, two statistical measures are used: the Gross Enrolment Ratio (GER) and the Net Enrolment Ratio (NER). Their definitions, according to UNESCO EFA reports are:
GER: Total enrolment in a specific level of education, regardless of age, expressed as a percentage of the population in the official age group corresponding to this level of education. The GER can exceed 100% due to late entry or/and repetition.
NER: Enrolment of the official age group for a given level of education, expressed as a percentage of the population in that age group.
Academic achievement
The most available resource to measure achievement are international surveys such as the Organisation for Economic Co-operation and Development (OECD) Programme for International Student Assessment (PISA 2000, 2003, 2006), and the Trends in International Mathematics and Science Study (TIMSS 1995, 1999, 2003 and 2007) by the International Association of the Evaluation of Educational Achievement (IEA). PISA evaluates reading, mathematical and scientific literacy of 15-year-old students and TIMSS evaluates performance in mathematics and science of 13-year-old students. Given that this study focuses on Mexico, and despite Mexico‟s initial participation in TIMSS, the nation decided to withdraw before the publication of results. For this reason, attention will be concentrated on PISA results. Despite the fact that TIMSS includes a significant mixture of participating nations (around 28 percent of industrialised countries, the remainder being transitional and developing nations), an accurate comparison between outcomes of these two tests would not be practical. Equally important, PISA has, by 2006, achieved an integral assessment of literacy, numerical and scientific aspects, which allow estimating students‟ knowledge and skills towards the end of their compulsory education. OECD (2006) mentions that the requirements for this test to allow students to perform consistently are that: students are aged between 15 years 3 months and 16 years 2 months; they must have had completed at least 6 years in school; they can
30
either be attending publicly or privately funded schools, and in either a full-time or part-time curriculum.
2.4.2 Pre-school education
The definition of pre-primary education by the International Standard Classification of Education (ISCED) is one of level zero; for children aged at least 3 years, offering planned learning activities away from the home environment (UNESCO, 1997 in UNESCO, 2004).
Previous studies show that when children who have received pre-school formation and those who have not, are compared, the cognitive and participative outcomes have been better for the former, even if the programmes functioned with limited resources (UNESCO, 2004). Other studies have also reported that when children attend pre-school, they develop not only their logical responses but they acquire better social skills (Raine et al., 2003 in UNESCO, 2004), and this level of education also helps to reduce levels of hunger and malnutrition, given that close to 10 million children aged under 5 die yearly, mostly in developing countries (UNESCO, 2006).
Early child care has been included in the basic educational set and participation is higher in developed and transitional nations (UNESCO, 2006); however, several countries do not yet count on an established system of measurement. Formal examinations, assessments or completion certificates are, for the most part, not customary at this level and therefore, comparison between countries would not show accurate outcomes (UNESCO, 2004).
Pre-primary education programmes and entrance age
To date, all nations have implemented pre-primary level programs, normally called pre-school education (93); kindergarten (66); pre-primary education (50); early childhood education (34); and finally, nursery education and a variety of combinations of the aforementioned mentioned designations (28) (UNESCO, 2006). The duration of these programmes vary between countries; in almost half of the world‟s nations pre-primary lasts around three years, yet in most of the OECD nations, children attend pre-primary programmes that last between one to four years and which comprises ages 4 to 6 (UNESCO, 2010). The majority of European Union nations make available two years of free early childhood programmes. In places such as Central and Eastern Europe, and Central Asia, pre-primary school programmes last four years, and in places such as Latin America and the Caribbean, the Arab
31
States, East Asia and the Pacific, pre-primary school programmes last one or two years (UNESCO, 2006).
Although age three has been considered as the customary entrance age since 1998, a unified agreement has not been established between nations to define the entrance age for pre-primary education, being, for example, ages 3 to 5 in eighty six countries; 4 to 5 years in thirty one countries; and 3 to 4 in twenty four countries (UNESCO, 2006). Clear differences can be noticed between regions in which an official entry age to attend pre-primary education has been instituted; to illustrate some examples, all countries from Central Asia have age 3 as the official entry age; in North America and Western Europe, the majority (85 percent) of countries have this stipulation, followed by a significant number of countries from Latin America and the Caribbean and in sub-Saharan Africa (with 68 and 64 percents respectively) (UNESCO, 2008).
With regards to its obligatory nature, pre-primary education is not obligatory per se in about 85 percent countries (UNESCO, 2006) and therefore it can be assumed that children could either enter this level of education when they turn 3, 4, or 5, or not enrol at all. Most noteworthy, thirty nations have amended their constitutions to make pre-primary education, compulsory, with pioneer nations being Israel (1949) and Luxembourg (1963), and with some of the most recent ones being FYR Macedonia (2005), followed by the Iran, Peru, and Poland (2004). Other countries such as Denmark, Latvia, Burma, the Netherlands, Moldova and ten nations from Latin America and the Caribbean, one year of pre-primary education is compulsory (Umayahara, 2005, and UNESCO-OREALC, 2004 in UNESCO, 2006).
Participation in pre-school education
A steady increase of pre-primary participation has been registered worldwide in the last three decades; from 43.7 million children enrolled in 1975 to 139 million by 2006 (UNESCO, 2006). In a period of 31 years this represents:
a) an increase of 95.3 million more children enrolled;
b) an increase in enrolment of 218 percent, and
c) a threefold increase in pre-primary enrolment.
Worldwide pre-primary education total enrolments increased about 183 percent from 1975 to 2004, but by only 24 percent from 1999 to 2006. From the former period of time, developed and transition countries had a 9 percent increase, and
32
developing countries presented a 565 percent increase (UNESCO, 2006). Regionally, South and West Asia had shown the largest increase of 3,800 percent, followed by sub-Saharan Africa with 3,600 percent increase. Although the Arab States and Latin America and the Caribbean had had more stable increases in pre-primary enrolment between 1975 and 2004, at the end of this period, total enrolments mainly increased in South and West Asia and sub-Saharan Africa by 22 and 15 times. Latin America and the Caribbean followed by a sevenfold increase in total enrolments.
The largest increases of pre-primary enrolment have therefore occurred in developing regions, particularly in East Asia and the Pacific and South and West Asia. From 1999 to 2006, a similar pattern followed, developed countries‟ enrolments went up 3 percent whereas developing countries achieved an increase of 32 percent. One of the reasons why enrolment rates in developed countries has become more steady in the last end of the last decade is because of the low birth rates at the end of the 1990s (UNESCO, 2006). Furthermore, the population of children aged 0 to 5 has stabilised in Latin America and the Caribbean and, relatively, in South and West Asia. On the other hand, in sub-Saharan Africa and the Arab States, the number of young children has not reached a stable point. With regards to Latin America, Torres and Puiggros‟ (1997) study of public education in Latin America claimed that pre-schooling was generally out of the reach of the impoverished. UNESCO (2008) provides substantial data confirming this statement, reporting that attendance rates for children from poor homes is significantly lower than that of children from wealthy homes and that the reasons vary from the lack of local facilities, cost or parents‟ distrust towards the facilities and authorities. Latin America, however, has had a significant improvement in pre-school education; in terms of gross enrolment ratios (GER) it increased from 55 percent in 1999 to 64 percent in 2006. In particular, Mexico, as a country in Latin America, had a GER of 80 percent, and a net enrolment ratio (NER) of less than 70 percent (UNESCO, 2005).
A curious case is that of the United States; despite early childhood programmes not being lawfully enforced for children of ages below 5, at least 60 percent of children of such ages attended a pre-primary educational programme in 2007 (UNESCO, 2010). Such development has significant relation with the fact that women, to whom the rearing of children is traditionally assigned to, have increased participation in the formal economy since the 1950s, and equally important, the number of mono-parental families (particularly with women being in charge) have
33
increased over the last decade in both developed and developing countries (UNESCO, 2006).
In relation to gender differences, in the majority of nations with available data, enrolment favours boys overall by less than 10 percent. Examples of this include Bahrain, Colombia, Equatorial Guinea and Suriname. On the other hand, examples of nations with enrolment rates favouring girls include Bolivia, the Philippines, and Trinidad and Tobago (UNESCO, 2006). The same report also observed that participation also favours, for the most part, children from urban areas.
Little has been demonstrated regarding the quality of early childhood programmes, however, UNICEF (2008b) states, as cited by UNESCO (2008) that for a programme to be considered of good quality, four elements must be present: firstly, that children enrol early, secondly, that courses take place in suitable facilities, thirdly, that parents participate in the process and, finally, a substantial factor, not only that the number of teachers is sufficient but that they possess relevant qualifications. Unfortunately, the international community has not uniformly defined the educational contents that this educational level shall comprise, or an age of entry, nor the programme duration in terms of hours and years. As a consequence, the estimation of the real progress of this educational level is notably difficult.
2.4.3 Primary Education
As mentioned earlier in this chapter, both primary and secondary education provide children with ground knowledge and skills that will prepare them for the future. Since the World Education Forum in Dakar, Senegal in 2000, it is undeniable that figures for primary education enrolment have risen. World figures of primary school total enrolments rose from 646 to 694 million between 1999 and 2007. Even net enrolment ratios (NER) went up from 82 to 87 percents for the same period. Although a 7 percent increase in 8 years might not seem dramatic, these figures confirm that the world is progressing towards the reach of universal primary education.
Developed and developing countries have clearly denoted different patterns; developed countries had a decrease in their total enrolments of 6 percent, whereas developing countries increased their total enrolments by 10 percent within the same period. Developed countries have decreased the number of enrolments for this level of education, in great part because their birth rates have been de