In
te
rn
et
S
ec
ur
it
F
irewalls are the cornerstone of corporate intranet security. As such, a company must config-ure and manage its firewall to realize an appropriate security policy for its own particular needs. As Aviel Rubin and his colleagues noted, “The single most important factor of your firewall’s security is how you configure it.”1Network security experts gener-ally agree that corporate firewalls are poorly configured. Anecdotal evidence of this sentiment can be found in such mailing lists as the Firewall Wizards list (see https://listserv.icsalabs.com/ pipermail/firewall-wizards). Furthermore, the success of worms and viruses such as Blaster2 and Sapphire3 illustrate the poor state of firewall configuration. My 2004 study — the first quantitative
evaluation of the quality of corporate firewall configurations — validated this state of affairs.4
However, firewall vendors regularly release new software versions of their products. In addition, more attention is now being paid to firewall rule-set quality, due to regulations such as the Sarbanes-Oxley Act5 and the CobiT framework (www.isaca.org/cobit), the Payment-Card Industry Data Security Standard (www.pcisecuritystandards. org), and the US National Institute of Standards and Technology standard 800-41.6 All these regulations include specific sections dealing with firewall configuration, management, and audit. Thus, we might hypothesize — or hope — that the quality of corporate firewall configurations has improved over time.
Security experts generally agree that corporate firewalls often enforce poorly written rule sets. This article revisits a 2004 survey of corporate firewall configurations that quantified the extent of this issue. In addition to being much larger, the current study includes configurations from two major vendors. It also introduces a new firewall complexity measure that applies to both types of firewalls. The study’s findings validate the 2004 study’s main observations: firewalls are (still) poorly configured, and a rule set’s complexity is (still) positively correlated with the number of detected configuration errors. However, unlike the 2004 study, the current study doesn’t suggest that later software versions have fewer errors.
Avishai Wool
Tel Aviv University
Trends in Firewall
Configuration Errors
Here, I aim to test this hypothesis and check whether the findings of my earlier study are still valid.
Methodology
I collected the data for the 2004 study in 2001. Clearly, much has happened in the network security arena since then. Therefore, you might challenge that study’s validity, claiming (or hoping) that the situation has improved. More-over, the 2004 study was fairly small in scope, covering only 37 rule sets, all from Check Point firewalls, and considering only 12 possible errors, eight of which were specific to Check Point Firewall-1.4 You could argue that the sam-ple in that study wasn’t indicative and that the detected problems were specific to that vendor.
To address these possible critiques, the cur-rent study has the following features:
• It’s based on newer configuration data, col-lected from firewalls running later software versions.
• It’s significantly larger, covering more than twice as many rule sets as the first study. • It includes rule sets from two leading
fire-wall vendors: Check Point Firefire-wall-17 and Cisco PIX.8
• It considers three times as many configuration errors, consisting of 36 vendor-neutral items. I obtained the rule sets for the current study from various corporations that used the AlgoSec Firewall Analyzer (www.algosec.com) between 2003 and 2005.9 Note that corporate firewall rule sets are considered highly sensitive and were provided under nondisclosure agreements that limit or delay my ability to discuss them publicly. Hence, publishing quantified statistics about these rule sets is a contribution in itself. Check Point Firewalls
The data for this work includes 54 Check Point Firewall-1 rule sets collected between 2003 and 2005. The rule sets came from organizations in the telecommunications, financial, energy, media, automotive, and healthcare markets. Table 1 lists some basic statistics of the rule sets. The collected rule sets came from three Check Point major software releases: 4.0, 4.1, and NG, with the NG rule sets spanning several minor releases. For this study, I grouped all NG rule sets up to field pack 3 in one category called
“NG/NG-FP3,” and all later rule sets in a sepa-rate category called “NG R55.” Table 2 shows the distribution of rule sets by software version. Cisco PIX Firewalls
The data for this work also includes 30 Cisco PIX rule sets collected between 2003 and 2005. Table 3 lists some basic statistics of the col-lected Cisco PIX rule sets.
The collected rule sets include files from Cisco PIX versions 4.4 to 7.0. Because there were few rule sets from version 7.0, I grouped the rule sets into four categories: 4.4, 5.0–5.2, 6.0–6.2, and 6.3–7.0. Table 4 shows the distribu-tion of rule sets by software version.
Table 1. Basic statistics of the Check Point Firewall-1 rule sets.
Statistic Minimum Median Maximum
Number of rules 2 79 617
Number of network objects defined in the database supporting the rules
19 572 5,443
Number of network interface cards on the firewall
2 4 18
Table 2. Check Point Firewall-1 rule sets by software version.
Version Number of rule sets %
4.0 4 7.4
4.1 30 55.6
NG/NG-FP3 17 31.5
NG R55 3 5.5
Table 3. Basic statistics of the Cisco PIX rule sets.
Statistic Minimum Median Maximum
Number of lines in the configuration file
71 365 3,259
Number of network interface cards on the firewall
2 4 8
Table 4. Cisco PIX rule sets by software version.
Version Number of rule sets %
4.4 3 10
5.0–5.2 7 23.3
6.0–6.2 11 36.7
Caveats
The current study includes 84 rule sets. This is more than double the sample of the earlier study, but it’s still very small. The number of operational firewalls in the world is estimated to be hundreds of thousands. Furthermore, I didn’t select these rule sets randomly. Rather, they were provided by organizations that wanted to audit their firewall rule sets and were willing to purchase software for this purpose. Therefore, the sample might be biased toward complex and badly configured firewalls.
In defense, I claim that the findings agree with the experience of many colleagues in the network security industry. Moreover, as noted earlier, the poor state of firewall configuration is evidenced by the huge proliferation of net-work worms such as Blaster2 and Sapphire,3 which a well-configured firewall could easily have blocked.
Finally, obtaining and reporting on any number of real rule sets from operational fire-walls is extremely rare. These rule sets are considered highly sensitive files. So, there is significant value in analyzing the data that can be obtained from them.
A New Measure of Firewall
Complexity
The 2004 study found that more complex rule sets have more errors. To make such statements precise, I introduced a rule-set complexity (RC)
measure,4 defined as
RC = #Rules + #Objects +
2 #Interfaces
,
where #Rules is the raw number of rules in the rule set, #Objects is the number of net-work objects, and #Interfaces is the number of interfaces on the firewall. The RC measure successfully captured the essence of rule-set complexity for Check Point firewalls. However, to compare the complexities of Cisco PIX fire-walls to those of Check Point firefire-walls, I needed a measure that produced comparable values for the two vendors. The RC measure can’t be applied to Cisco PIX, because Cisco PIX and Check Point Firewall-1 are configured differ-ently.10 For measuring complexity, the most important differences are that
• a Cisco PIX configuration includes a sepa-rate rule set (an access-list) for each
inter-face, whereas a Check Point Firewall-1 has a single rule set that applies to all the inter-faces, making #Rules incomparable.
• Cisco PIX configurations don’t have a sepa-rate object database, and, up to version 6.0, they didn’t even allow the definition of non-trivial objects, such as objects containing anything other than a single subnet. Thus, #Objects is ill-defined for Cisco PIX firewalls. Beyond the immediate need for a measure that’s suitable for Cisco PIX firewalls, I felt that RC measure didn’t give enough weight to the num-ber of interfaces. As Table 1 shows, none of the surveyed Check Point firewalls has more than 18 interfaces (the median number is four), yet it’s not uncommon to find Check Point firewalls with hundreds of rules and thousands of objects. Because #Interfaces is added only to the rule-set complexity measure, albeit quadratically, its contribution is often dwarfed by the two other terms. For instance, I felt that a firewall with 12 interfaces is much more complex than one with three interfaces with the same numbers of rules and objects. The old RC measure doesn’t capture this intuition well because the growth in the number of interfaces only contributes an extra (66 – 3) = 63 points to the more complex fire-wall’s rule-set complexity measure.
For these reasons, I designed the firewall complexity (FC) measure. Of course, this new measure must still be objective, intuitive, and simple to compute.
For Cisco PIX firewalls, the simplest mea-sure of complexity is the number of lines in the configuration file. However, the raw number of lines is slightly misleading, especially for very small configurations. This is because even the smallest Cisco PIX configuration file includes a few tens of boilerplate lines that have little to do with traffic filtering. To compensate for these lines’ presence. I used the following definition.
Definition 1. Let #Lines denote the number of lines in the ASCII file containing the complete Cisco PIX configuration file. Then, the firewall complexity of a Cisco PIX firewall is FCp =
#Lines – 50.
To define a comparable measure for Check Point firewalls, I tried to capture the results of an imaginary oversimplified Check Point-to-PIX converter. Such a converter would need to replicate the single Check Point Firewall-1 rule
set and place a copy on each Cisco PIX inter-face. Therefore, for the FC measure, I multiplied the number of rules by the number of inter-faces. However, object definitions in Cisco PIX are global (not per-interface), so the FC measure must only add the number of Check Point Fire-wall-1 objects once. These choices have the nice side effect of giving much more weight to the number of interfaces than the old RC measure did, thereby addressing a shortcoming of that measure. This leads to the next definition.
Definition 2. Let #Rules denote the raw num-ber of rules in the Check Point Firewall-1 rule set; let #Objects denote the number of network objects; and let #Interfaces denote the number of interfaces on the firewall. Then, the firewall complexity of a Check Point Firewall-1 firewall is FCc = (#Rules × #Interfaces) + #Objects.
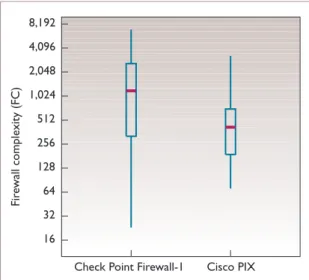
Figure 1 shows the distribution of the rule-set complexity as measured by FC over the surveyed Check Point Firewall-1 and Cisco PIX firewalls. The figure shows that the range of values is the same for both firewall brands: 10–10,000.
The figure also shows that Check Point Fire-wall-1 firewalls typically have a higher com-plexity. The median FC value for Check Point firewalls is 1,117 versus 315 for Cisco PIX (note that the y-axis is log scaled). My interpreta-tion is that this is a real finding rather than an artifact of the firewall complexity metric. From inspecting the configuration data directly, it seems to me that indeed Check Point Firewall-1 configurations tend to be more complex.
Selecting Configuration Errors
My 2004 study considered 12 configuration errors.4 However, eight of those errors were specific to Check Point firewalls, which makes them unsuitable in a multivendor study. There-fore, in this study I used a different list, con-sisting of 36 vendor-neutral errors, all of which create a risk to the network behind the firewall. As in the earlier study, I took the stance of an external auditor. Thus, the errors I counted are all violations of well-established practices and guidelines that are independent of each organization’s specific requirements and poli-cies.6,11 As such, the findings should be viewed as a rough baseline. The protection offered by the surveyed firewalls might be worse than this work suggests.
Selection Criteria
A single badly written rule can trigger multiple counted errors, given that some errors contain other, more specific errors. For instance, allow-ing Telnet (TCP on port 23) is a special case of allowing “all TCP ports,” which in turn is a special case of allowing “any service.” To avoid inflating the error counts because of this con-tainment phenomenon, I counted a more spe-cific error only if it was triggered by some rule that didn’t trigger a more general error. Con-tinuing the previous example, a rule set can trigger both the “any service” and the “all TCP errors,” but only if the configuration includes two separate rules: one allowing any service, and the other allowing all TCP ports.
You could argue that not all the configura-tion errors in the list are equally severe. For instance, some services have a poorer security history than others. Also, having all 65,536 TCP ports open is probably more risky than having just the Telnet port open. However, to arrive at a single, easy-to-understand number, I didn’t account for such fine-grained considerations. The simplicity of counting each error type once let me avoid introducing severity levels and side-step the question, “How many medium-risk errors is one high-risk error worth?”
Furthermore, you could also argue that a 16 32 64 128 256 512 1,024 2,048 4,096 8,192 Cisco PIX Check Point Firewall-1
Fir
ewall complexity (FC)
Figure 1. Firewall complexity distribution (log scale) for Check Point Firewall-1 and Cisco PIX. For each vendor, a “bar and whiskers” column shows the distribution of errors. The bottom and top of the whiskers mark the minimum and maximum values, the bottom and top of the bar mark the first and third quartiles, and the magenta line within the bar marks the median.
configuration with 10 rules allowing any ser-vice is riskier than a configuration with just one such rule. My opinion is that the num-ber of erroneous rules is a good measure of the effort level that the firewall administrator would need to spend fixing the configuration, but less indicative of the amount of risk. If an attacker can enter the network, the network is at risk, and whether there are one or 10 firewall rules that let an attacker in is less important. So, again in the interest of simplicity, I ignored the number of rules contributing to each error and opted for Boolean indicators for each error. Error Categories
I organized the counted configuration errors into four categories and assigned each an iden-tifying code with a leading letter indicating the category:
• inbound traffic (identified by “i”),
• outbound traffic (identified by “o”), • internal traffic (identified by “d”), and • inherently risky rules (identified by “r”). A comprehensive list of all the errors and their meanings is available in a technical report.12
Most configuration errors (21 of the 36) are inbound traffic errors (“i” errors). These errors cover things such as allowing any traffic inbound or allowing services such as NetBIOS, Telnet, RPC, Simple Network-Management Pro-tocol, and several other known risky services through the firewall in the inbound direction.
Beyond services that are known to be risky, I wanted to count errors that are related to popular services such as HTTP, the Domain Name System (DNS), and FTP. These services are often neces-sary to running a business, so allowing them inbound shouldn’t be counted as an error per se. For instance, HTTP must be allowed to reach an organization’s Web servers. However, allowing
0 10 20 30 40 50
%
60 70 80 90 100
Outbound SMTP from 256+ IPs (o02) Outbound P2P (o08) "To Any allow Any service" rules (r01) Internal Microsoft services (d04) Internal X11 (d05) Outbound "Any" service (o04) Inbound HTTP to 256+ IPs (i08) Outbound TCP on 2000+ ports (o07) Inbound DNS/UDP to 256+ IPs (i10) Internal "Any" service (d01) Inbound FTP to 256+ IPs (i11) Inbound SMTP to 256+ IPs (i09) Inbound SNMP (i06) Inbound Telnet (i04) Inbound P2P (i18) Inbound Microsoft services (i07) Inbound DNS/TCP to 256+ IPs (i16) Inbound RPC (i05) Inbound ICMP to 256+ IPs (i12) Outbound POP3 (o01) Outbound Instant-Messaging (o09) Inbound TFTP (i15) Internal UDP on all ports (d03) Outbound UDP on all ports (o06) Inbound MSSQL (i17) Inbound "Any" service (i01) Inbound database access (i20) Inbound TCP on 2000+ ports (i14) Outbound IRC (o03) Inbound X11 (i13) Inbound Instant-Messaging (i19) Inbound UDP on all ports (i03) Inbound version control (i21) Internal TCP on all ports (d02) Inbound TCP on all ports (i02) Outbound TCP on all ports (o05)
Figure 2. Distribution of configuration errors. The width of the horizontal bars is proportional to the percent of firewalls on which the configuration errors were detected.
HTTP to reach machines that aren’t hardened Web servers is risky. Many sensitive machines (such as email servers, phone switches, routers, and firewalls) provide a Web interface.
Without interviewing the firewall adminis-trators, we might not know which IP addresses belong to the relevant servers and which don’t. To get around this challenge, I used thresholds. The idea behind this is that it’s rare to find hundreds of different Web servers on one net-work, so, if HTTP can reach more than 256 IP addresses (more than a full class-C subnet), it’s almost always the result of badly written rules. Several of the inbound traffic configuration errors (i08–i12 and i16) include such thresholds. Configuration errors for outbound traffic (“o” errors) contribute nine of the 36 items. Most of these deal with services that are considered risky in all directions. In addition, I counted errors for indiscriminate outbound email traf-fic (o02), again using the notion of thresholds, and for Internet Relay Chat (IRC) (o03), which is notorious for carrying the command-and- control channel of botnets.
Internal traffic through the firewall (between separate internal network segments) contributes five of the 36 items (“d” errors). These items all deal with services that are considered risky in all directions. Finally, I also counted a special “r” error for the presence of rules that are inher-ently problematic. An “r” error is counted if the rule set has “to any allow any service” rules.
Results and Analysis
Now that we have a firewall complexity mea-sure that’s suitable to both firewall vendors, and a vendor-neutral set of configuration errors, we can analyze the collected rule sets and compare the findings to the 2004 study.
Firewalls Are Still Badly Configured
Figure 2 shows the raw distribution of configu-ration errors discovered in the data. The results are perhaps unsurprising in view of the 2004 study.4 Generally speaking, serious errors are still alarmingly frequent in the collected data.
In the inbound direction, more than 45 percent of the firewalls allowed DNS, FTP, or Simple Mail-Transfer Protocol (SMTP) to reach more than 256 addresses (items i10, i11, and i09, respectively). Possibly more worrisome is that 42 percent of firewalls allowed the infamous Microsoft NetBIOS services, which are a vector
to numerous Internet worms,2 in the inbound direction (item i07).
In the outbound direction, the situation looks worse. More than 80 percent of firewalls allow broad outbound SMTP access (item o02), and more than 60 percent allow outbound peer-to-peer (o08) services, which rarely have any business use. Finally, more than 60 percent of firewalls have rules of the form “from some-where to any allow any service” (r01) — very lax rules, which constitute gross mistakes by any account.
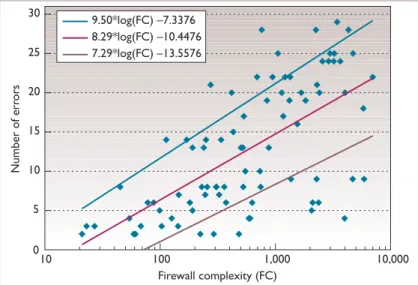
Complexity Matters: Small Is Still Beautiful One of the main findings of the 2004 study was that high rule-set complexity was positively correlated with the number of detected configu-ration errors.4 Figure 3 shows a scatter plot of the number of errors as a function of FC, dem-onstrating the same phenomenon in the current survey. Very few high-complexity rule sets are well configured (the lower-right quadrant of the figure is sparse). Furthermore, the figure clearly shows a correlation between the rule-set com-plexity, as measured by FC, and the number of detected errors.
The firewall complexity measure gives us a crude but fairly accurate prediction of the num-ber of configuration errors. A linear regression (the central line in Figure 3) shows that the number of errors in a rule set of complexity
FC is roughly captured by the formula #Errors 0 5 10 15 20 25 30 10 100 1,000 10,000 Number of err ors Firewall complexity (FC) 9.50*log(FC) –7.3376 8.29*log(FC) –10.4476 7.29*log(FC) –13.5576
Figure 3. Number of errors as a function of the rule-set’s complexity FC (log scale). The magenta line represents the least-squares linear regression fit, and the teal and brown lines represent one standard deviation above and one below the least-squares fit.
≈ 8 log10(FC) – 10. That is, a rule set with FC = 1,000 is expected to have 14 errors, while a rule set with FC = 10,000 is expected to have 22 errors (out of the 36).
We see that the current survey validates the earlier findings: it’s generally safer to limit the complexity of a firewall rule set. Instead of connecting yet another subnet to the main fire-wall, and adding another interface with more rules and more objects, it seems preferable to install a new, dedicated firewall to protect only that new subnet. Complex firewall rule sets are apparently too complex for their administrators to manage effectively.
Does the Firewall’s Version Matter?
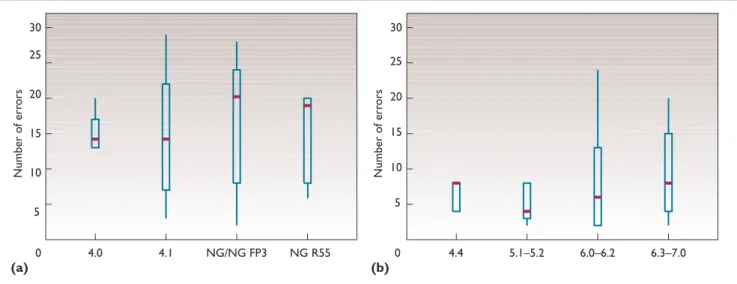
The 2004 study found that Check Point fire-walls using versions 4.1 or later had slightly fewer configuration errors than those using earlier software versions.4 The current study tested whether this trend continues.
Figure 4a shows the distribution of errors across the different versions of Check Point Firewall-1; Figure 4b shows the same for Cisco PIX versions. Both graphs show that the effect of the software version on the number of con-figuration errors is insignificant. The distri-bution of the number of errors is essentially independent of the firewall software version. The data doesn’t support the hypothesis that later software versions are correlated with fewer errors (for both vendors).
I believe that the 2004 study detected such a trend because eight of the configuration errors were controlled by global options in the Check
Point Firewall-1 user interface (rather than by explicit user-defined rules). The default settings for those global options were improved in ver-sion 4.1, producing the detected effect. How-ever, all the configuration errors considered in this study are vendor neutral and controlled by explicit user-defined rules — that is, by the firewalls’ basic filtering functionality. This functionality hasn’t changed syntactically or semantically in either vendor’s products during the period that data was collected. Therefore, later software versions don’t help users write better filtering rules.
I
n summary, the findings do validate the ear-lier study’s main observations:4 firewalls are (still) poorly configured, and a rule set’s com-plexity is (still) positively correlated with the number of detected configuration errors. How-ever, it seems that later software versions don’t help administrators make fewer mistakes. These findings hold for rule sets from both vendors. Thus, for well-configured firewalls, “small is (still) beautiful.”References
1. A. Rubin, D. Geer, and M. Ranum, Web Security
Source-book, Wiley Computer Publishing, 1997.
2. CERT Advisory CA-2003-20: W32/Blaster Worm, CERT/ CC, 11 Aug. 2003; www.cert.org/advisories/CA-2003-20. html.
3. D. Moore et al., “The Spread of the Sapphire/Slammer Worm,” 2003; www.caida.org/outreach/papers/2003/ sapphire/sapphire.html. (a) 0 (b) 0 5 10 15 20 25 30 NG R55 NG/NG FP3 4.1 4.0 Number of err ors 5 10 15 20 25 30 6.3–7.0 6.0–6.2 5.1–5.2 4.4 Number of err ors
Figure 4. Comparing the distribution of errors of successive software versions for (a) Check Point Firewall-1 and (b) Cisco PIX. The software version used has no significant effect on the number of errors.
4. A. Wool, “A Quantitative Study of Firewall Confi
gura-tion Errors,” Computer, vol. 37, no. 6, 2004, pp. 62–67.
5. Public Company Accounting Reform and Investor Pro-tection Act of 2002 (Sarbanes-Oxley Act), Public Law
107-204, US Statutes at Large, vol. 116, 2002, p. 745.
6. Guidelines on Firewalls and Firewall Policy, US Nat’l Inst. Standards and Technology Special Publication 800-41, 2002; http://csrc.nist.gov/publications/nistpubs/ 800-41/sp800-41.pdf.
7. D.D. Welch-Abernathy, Essential Checkpoint
Fire-wall-1: An Installation, Confi guration, and Trouble-shooting Guide, Addison-Wesley, 2002.
8. D.W. Chapman and A. Fox, Cisco Secure PIX Firewalls,
Cisco Press, 2001.
9. A. Mayer, A. Wool, and E. Ziskind, “Offl ine Firewall
Analysis,” Int’l J. Information Security, vol. 5, no. 3,
2005, pp. 125–144.
10. A. Wool, “The Use and Usability of Direction-Based
Filtering in Firewalls,” Computers & Security, vol. 23,
no. 6, 2004, pp. 459–468.
11. SANS Institute, “The Twenty Most Critical Internet Security Vulnerabilities,” version 4.0, 2007; www. sans.org/top20/.
12. A. Wool, Firewall Confi guration Errors Revisited,
tech. report arXiv:0911.1240, 2009; http://arxiv.org/ abs/09 11.1240.
Avishai Wool is an associate professor at the School of Electrical Engineering at Tel Aviv University. His research interests include fi rewall technology, com-puter, network, and wireless security, smartcard and RFID systems, and side-channel cryptanalysis. Wool has a PhD in computer science from the Weizmann Institute of Science, Israel. He’s a senior member of IEEE and a member of the ACM. He is also cofounder and CTO of AlgoSec Systems. Contact him at yash@ eng.tau.ac.il.
Selected CS articles and columns are also available for free at http://ComputingNow.computer.org.
Silver Bullet Security Podcast
Listen in as your host Gar y McGraw inter views Richard Clarke, former US cyber securit y czar, about balancing cyber securit y against individual liber t y.w w w.computer.org /securit y /podcasts
S p o n s o r e d b y