The University of Akron
IdeaExchange@UAkron
Williams Honors College, Honors Research ProjectsThe Dr. Gary B. and Pamela S. Williams Honors College
Spring 2019
U.S. Census Explorer: A GUI and Visualization
Tool for the U.S. Census Data API
Timothy Snyder
Please take a moment to share how this work helps youthrough this survey. Your feedback will be important as we plan further development of our repository.
Follow this and additional works at:https://ideaexchange.uakron.edu/honors_research_projects Part of theDatabases and Information Systems Commons,Graphics and Human Computer Interfaces Commons,Policy Design, Analysis, and Evaluation Commons,Software Engineering Commons, and theSystems Architecture Commons
This Honors Research Project is brought to you for free and open access by The Dr. Gary B. and Pamela S. Williams Honors College at IdeaExchange@UAkron, the institutional repository of The University of Akron in Akron, Ohio, USA. It has been accepted for inclusion in Williams Honors College, Honors Research Projects by an authorized administrator of IdeaExchange@UAkron. For more information, please [email protected],
[email protected]. Recommended Citation
Snyder, Timothy, "U.S. Census Explorer: A GUI and Visualization Tool for the U.S. Census Data API" (2019).
Williams Honors College, Honors Research Projects. 858.
Abstract— U.S. Census Explorer is a software application that is designed to provide tools for intuitive exploration and analysis of United States census data for non-technical users. The application serves as an interface into the U.S. Census Bureau’s data API that enables a complete workflow from data acquisition to data visualization without the need for technical intervention from the user. The suite of tools provided include a graphical user interface for dynamically querying U.S. census data, geographic visualizations, and the ability to download your work to common spreadsheet and image formats for inclusion in external works.
I. INTRODUCTION
The utilization of pictures to enhance an individual's understanding of the world around them has been a widely used concept since the early days of society. [1] Dating back to 600 BC, the Greek philosopher Anaximander drafted the first known map of the world. [2] This map aided in coordinating navigation and trade throughout ancient Europe and Asia. Today, visualizations are a vital component in a variety of fields, including Medicine, Chemistry, and Business. [1] They are leveraged to increase comprehension of large and complex datasets, helping to inform critical-decision making that has the potential to impact millions of lives.
One data source that is often leveraged for informing decision-making is that which is maintained by the United States Census Bureau. The census bureau maintains a diverse group of datasets generated by a number of surveys and programs including the American Community Survey, Economic Census, and Statistics of Business Owners. [4] These surveys and programs range in frequency with some occuring once a year, every five years, and every decade. The data collected from these surveys has a rich set of applications; drawing interest from community
leaders, businesses, and all levels of government. Data collected by the census bureau has been leveraged by local communities to develop policy for schools, social housing, transport,
healthcare, and job training. [4] Businesses will often analyze census data to develop a greater understanding of the demographics of areas that they wish to expand into. The potential applications of census data are innumerable, however, the tooling for leveraging this data is lacking today. The inability to easily access, download, analyze, and visualize census data prevents individuals, communities, and organizations who may benefit from this data the most from being able to utilize it. In response to this problem, we’ve developed the U.S. Census Explorer application to allow any user to unlock the applications of census data.
II. APPLICATION OVERVIEW A. DATA ACQUISITION
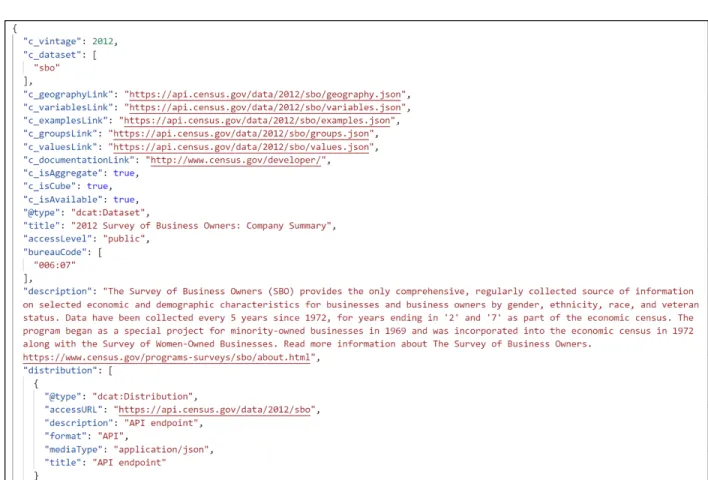
The United States Census Bureau offers a robust, machine-readable dataset discovery service, the Census Data API Discovery Tool, that grants developers access to the bureau’s data resources via HTTP. The API is accessible in three different formats, HTML, JSON, and XML. Within each of these documents is metadata describing each dataset offered by the API. This metadata includes textual descriptions of each dataset and further endpoints that can be used to query census data. Working with these endpoints, you are able access descriptions of the variables used in queries, geographic descriptions of the dataset, and complete examples of queries for the dataset. Depending on which format of the API you access, HTML, XML, or JSON, your queries return a dataset in the respective format. Within our application, we utilize
the JSON endpoints of the bureau’s API.
Figure 1: “2012 Survey of Business Owners” JSON entry in the Census Data API Discovery Tool As seen in Figure 1, datasets are presented as JSON entries in the Census Data API Discovery Tool. Executing a request to the API over HTTP will yield a textual JSON response from the census API. Once received, the response is parsed and converted to a native Python data structure.
B. QUERY CONSTRUCTION
Constructing a query for the census API is a trivial task for an experienced software engineer, however, the process may be confusing and unintuitive for non-technical personnel.
For example, to query migration flow data for all 50 U.S. states from the 2014 American Community Survey, one would have to manually construct the following query:
https://api.census.gov/data/ 2014/acs/flows ?get=MOVEDOUT,POP1YR&for=state:*
In order to construct this query, the user is required to search through the JSON document presented in Figure 1 to gather all of the required query components. Instead of forcing non-technical users to learn how to construct HTTP queries, we created an intuitive graphical user interface that streamlines the querying process.
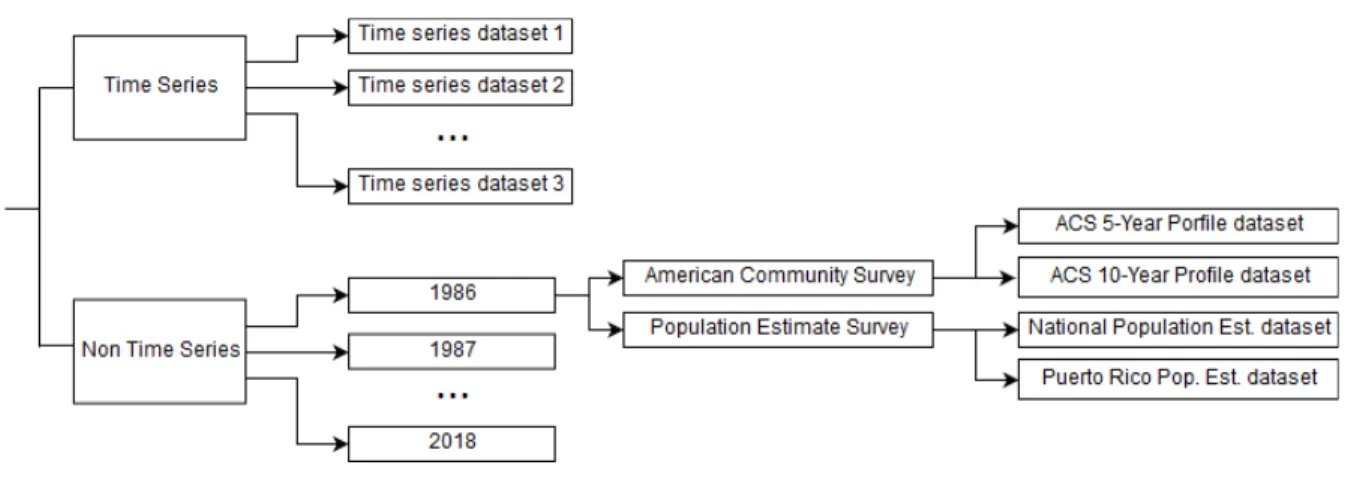
To translate this process into an intuitive GUI, we first reorganized the structure of dataset entries in the Census Data API Discovery Tool. Originally, each dataset existed as a discrete entry with no structural relationship to related datasets. For example, two different ACS datasets from 2014 would not be structurally grouped together. As such, it proved difficult to translate this structure into a usable GUI as there were far too many entries to independently display each on the page. So, we decided to restructure the organization of datasets to resemble the tree structure as presented in Figure 2.
At the top-level, datasets are categorized as either time series or non-time series. Non-time series datasets are first categorized by year. Then, they are grouped within the survey/program that generated the data. Finally, the leaf nodes are the actual datasets. The sub-trees that make up the children of the time series node are identical to the sub-trees that make up the children of the non-time series node, except, the layer of nodes discriminating datasets by year is absent. Now, for the GUI, we present the user a one-to-one reflection of this structure.
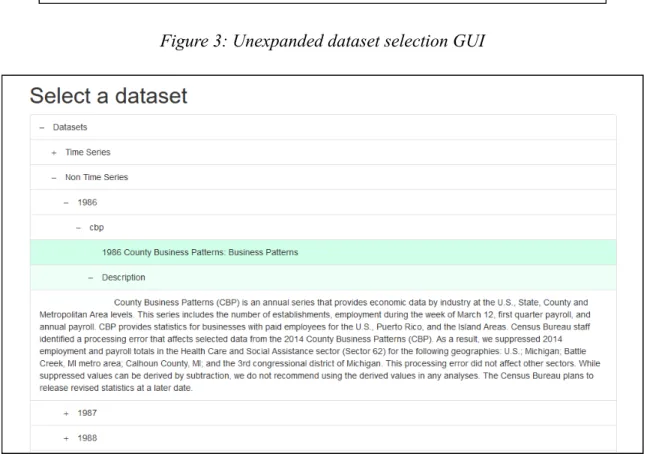
Figure 3: Unexpanded dataset selection GUI
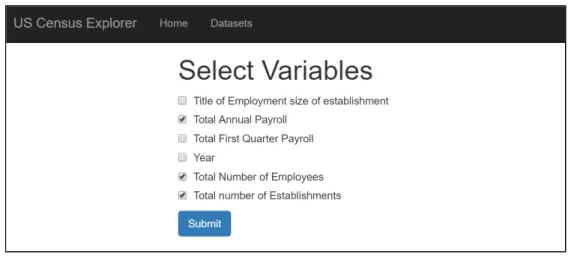
By presenting the dataset selection GUI as a one-to-one reflection of dataset storage in memory, we can directly translate a GUI selection into an O(1) search of the dataset entry tree. For example, in Figure 4, we’ve highlighted the 1986 County Business Patterns non-time series dataset. With the original API structure, we would have to iteratively search the JSON document for an entry matching this dataset which takes O(n) time where n = number of dataset entries. Reorganized as a Python dictionary in memory, we can generate an expression at runtime that retrieves the dataset entry in constant time. Once the user has selected a dataset, they are brought to another page where they may select the specific variables that they wish to query as seen in Figure 5.
Figure 5: Variable selection page
Once the user has selected their dataset and its associated variables, a query string is dynamically generated by our application. This query is executed over the Census Bureau’s API and the data is returned as a JSON string. This data is converted to a native Python data structure and passed to our visualization module.
C. VISUALIZATION
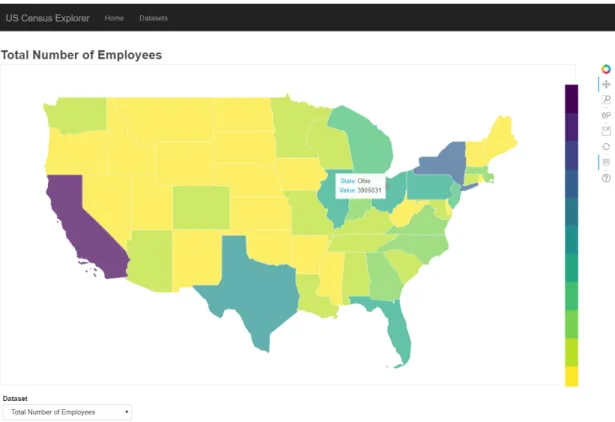
Within our application, we offer geographic visualizations for time series and non-time series datasets. Non-time series visualizations feature a map of the continental United States that is color-coded to reflect the values of the dataset that has been selected by the user. Additionally, it features a drop down menu to switch between the various variables the user has selected to be included in the dataset. Hovering over the map will reveal a tooltip displaying the value
associated with the state being hovered over.
Figure 6: Non-time series geographic visualization
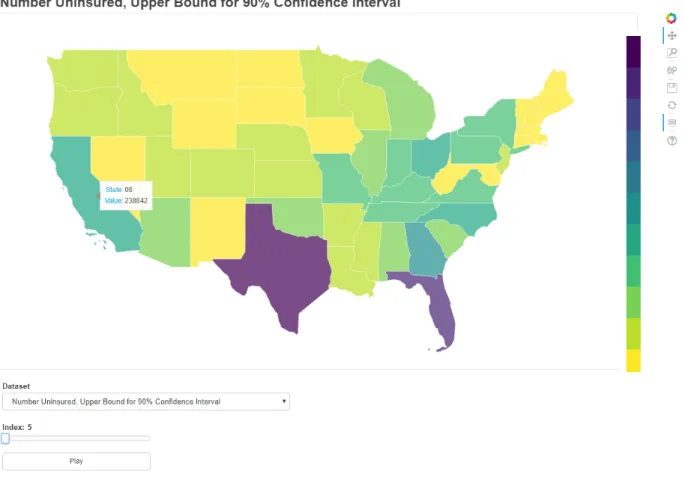
Our time series geographic visualization shares the same features as non-time series
visualization, however, it includes a button that when clicked, animates the plot allowing the user to view the time series data playback in real time. The user may also utilize a slider widget to playback the data at their own pace.
Figure 7: Time series geographic visualization
III. IMPLEMENTATION
A. APPLICATION ARCHITECTURE
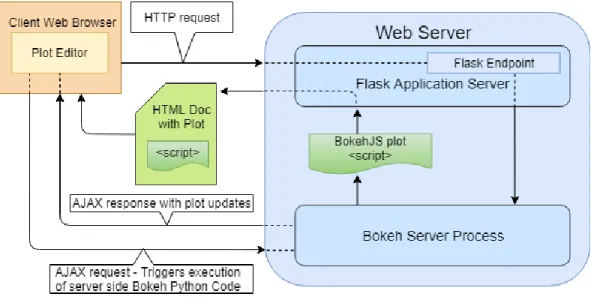
Our application is developed as a client-server application. The server-side components are developed in Python, mainly utilizing the web framework Flask to handle standard server operations like defining endpoints and handling HTTP requests. Additionally, we maintain an instance of a Bokeh server alongside the Flask server to produce and manage interactive visualizations for the front-end user interface. Bokeh is a Python library that can be used to
create rich, interactive visualizations in native Python code. After being defined in Python, the visualizations can then be embedded in web pages as Javascript code. The Bokeh server is instantiated as a sub-process of the Flask server and handles all updates to, creation of, and interactivity of the application’s visualizations. The two servers work in coordination with each other to drive visualizations and fetch new data from the census bureau’s API.
Figure 8: High-level overview of the application architecture
B. CENSUS API INTERFACE
There are a number of facilities that we’ve developed within our application to create a comprehensive interface into the Census Bureau’s data API. These components abstract away low-level operation such as HTTP requests to the API and the transformation of raw JSON data received from the API into Python objects. Together, these components create a complete programmatic interface into the Census Bureau’s data API. The first class of functionality that had to be implemented to utilize the Census data API within our application was the facilitation of HTTP requests. Being a Web API, all census data had to be queried from the Census Bureau
via HTTP requests. To do this, we implemented two classes to encapsulate the execution of and management of HTTP requests to the Census data API.
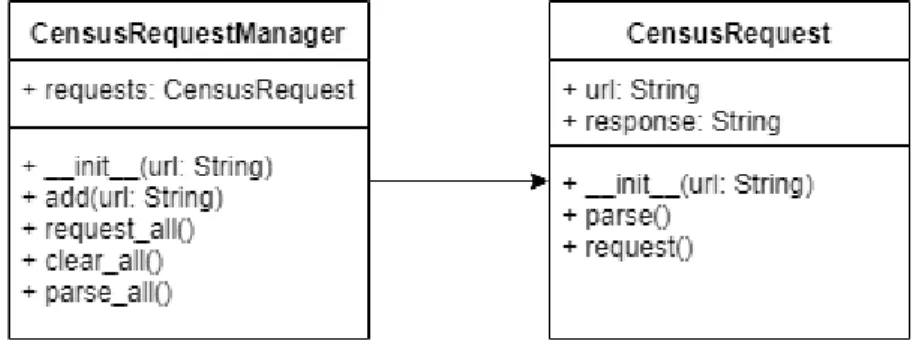
Figure 9: CensusRequestManager and CensusRequest UML diagrams
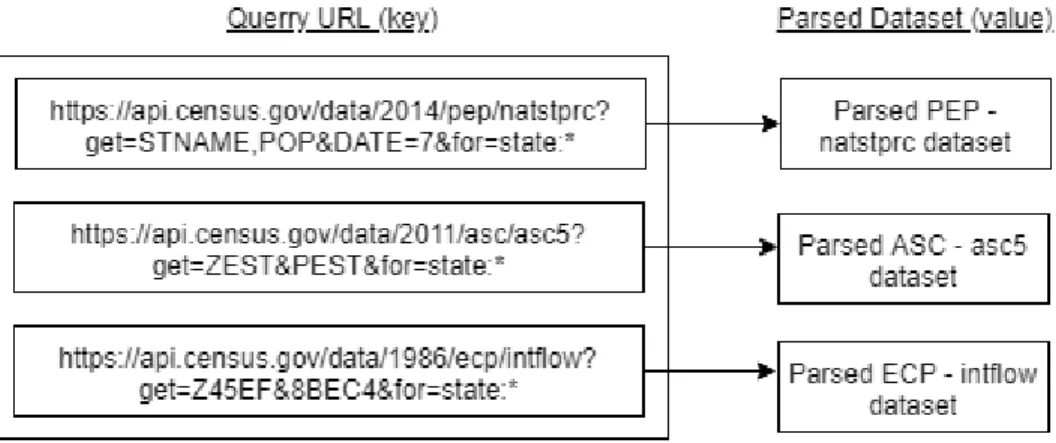
The CensusRequest class is responsible for encapsulating individual requests to the Census API. It is initialized with a census-compliant query URL and has two methods. CensusRequest.request() initiates the HTTP request based on the URL member variable and stores the HTTP response in the response member variable. This response is a string of raw JSON data. Invoking CensusRequest.parse() will parse the raw JSON data and return a Python dictionary that mimics the schema of the JSON data. CensusRequestManager is a class that encapsulates the creation and management of individual CensusRequest objects. It includes functionality to enqueue multiple query URLs and make requests to those URLs in batches. CensusRequestManager.parse_all() invokes CensusRequest.parse() on all queued CensusRequest objects and returns a Python dictionary that maps the query URLs to each parsed request.
Figure 10: Python dictionary returned by CensusRequestManager.parse_all()
Furthermore, we developed an additional class, CensusDataInterface, to encapsulate all requests to the census API and ownership of census data.
Figure 11: Census Interface UML diagram with CensusDataInterface
A CensusDataInterface object is initialized with a list of strings. This list of strings reflects the “c_vintage” and “c_dataset” fields of a dataset entry in the Census API Data Discovery Tool. The “c_vintage” field in an entry reflects the year that the dataset corresponds to. The
“c_dataset” field reflects the nested title of a dataset. This nested title typically begins with an acronym of the surveying organization followed by acronyms reflecting sets of datasets until a
final acronym is appended reflecting the title of the desired dataset. For example, to access the “2015 ACS 5-Year Data Profile” dataset, one would initialize a CensusDataInterface object with the following list: [‘2015’, ‘acs’, ‘acs5’, ‘profile’] . Here, the first argument, “2015”, specifies that we are interested in a 2015 dataset. The second argument, “acs”, specifies the organization that collected the data, in this case, the American Community Survey (ACS). The third argument, “acs5”, specifies that we wish to access a dataset within the ACS 5-Year category. Finally, the fourth argument, ‘profile’, specifies that we are accessing the “Data Profile” within the ACS 5-Year category. For time series datasets, the initialization is identical except the first argument derived from “c_vintage” is replaced with “timeseries”.
C. VISUALIZATION
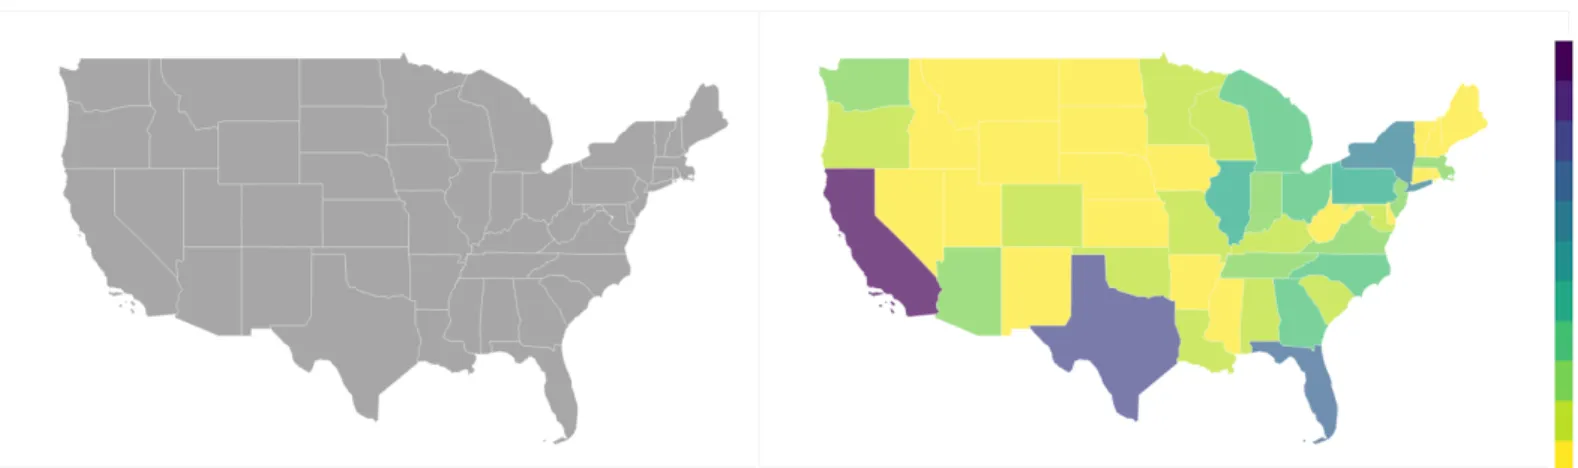
To aid in producing our visualizations, we utilized the Python library, Bokeh. Bokeh provides us with functionality for defining and rendering plots over a web connection. To create the geographic visualizations, we obtained geometric data for all 50 U.S. states and rendered them as polygonal glyphs to create a complete map of the United States. Then, once data queried from the Census Bureau has undergone a number of structural transformations to prepare it for visualization with Bokeh, the values of the dataset are color-mapped to each state on the rendered map as shown in Figure 12.
Figure 12: Before and after a dataset is loaded
Additionally, Figure 13 shows the in-memory structure of a time series dataset once it has been prepared for visualization. Non-time series datasets are represented in a similar structure but without the time series index keys.
IV. FUTURE WORK
There are a number of improvements that can be made to our application in the future. To begin, increasing support for datasets available from the U.S. census bureau would be a primary goal. Currently, the application caters to the most generalized form of a dataset that one might query from the census API, that is, a query that requests some number of variables for each of the 50 U.S. states. For example, our application does not support datasets for counties nor
datasets that require specific query components such as an explicit datetime parameter. Capturing more of these features available through the census data API would greatly increase the
functionality and potential uses of our application. Social features such as user profiles and the ability to share and edit work between users would be a welcome addition too. Finally, the inclusion of other data charts like line graphs, pie charts, and scatter plots would be extremely useful within the application as geographic visualizations aren’t always the right tool for visual communication.
IV. BIBLIOGRAPHY
[1] “Data Visualization: What It Is and Why It Matters.” SAS , 2019, www.sas.com/en_us/insights/big-data/data-visualization.html.
[2] Robinson, John Mansley. An Introduction to Early Greek Philosophy: the Chief Fragments and Ancient Testimony, with Connecting Commentary . Houghton Mifflin, 1968.
[3] “Who Uses Census Data?” Census 2016 Who Uses Census Data? , 2016, census.ie/the-census-and-you/who-uses-census-data/.
[4] US Census Bureau. “Purposes and Uses.” Purposes and Uses , 3 Apr. 2018, www.census.gov/programs-surveys/economic-census/guidance/data-uses.html.