National Louis University
Digital Commons@NLU
Dissertations12-2017
A Collaborative & Systematic Approach To
Implementing An Effective Standards-Based
Grading And Reporting System: A Change
Leadership Plan
Hector Freytas
National Louis University
Follow this and additional works at:https://digitalcommons.nl.edu/diss
Part of theEducation Commons
This Dissertation - Public Access is brought to you for free and open access by Digital Commons@NLU. It has been accepted for inclusion in Dissertations by an authorized administrator of Digital Commons@NLU. For more information, please [email protected]. Recommended Citation
Freytas, Hector, "A Collaborative & Systematic Approach To Implementing An Effective Standards-Based Grading And Reporting System: A Change Leadership Plan" (2017).Dissertations. 281.
A COLLABORATIVE & SYSTEMATIC APPROACH TO IMPLEMENTING AN EFFECTIVE STANDARDS-BASED GRADING AND REPORTING SYSTEM: A
CHANGE LEADERSHIP PLAN
Héctor Luis Freytas
Educational Leadership Doctoral Program
Submitted in partial fulfillment of the requirements of
Doctor of Education
In the Foster G. McGraw Graduate School
National College of Education National Louis University
ii
Copyright by Héctor L. Freytas, 2016 All rights reserved
iii
DIGITAL COMMONS DOCUMENT ORIGINATION STATEMENT
This document was created as one part of the three-part dissertation requirement of the National Louis University (NLU) Educational Leadership (EDL) Doctoral Program. The National Louis Educational Leadership Ed.D. is a professional practice degree program (Shulman et al., 2006).
For the dissertation requirement, doctoral candidates are required to plan, research, and implement three major projects, one each year, within their school or district with a focus on professional practice. The three projects are:
• Program Evaluation
• Change Leadership Plan
• Policy Advocacy Document
For the Program Evaluation candidates are required to identify and evaluate a program or practice within their school or district. The “program” can be a current initiative; a grant project; a common practice; or a movement. Focused on utilization, the evaluation can be formative, summative, or developmental (Patton, 2008). The candidate must demonstrate how the evaluation directly relates to student learning.
In the Change Leadership Plan candidates a plan that considers organizational possibilities for renewal. The plan for organizational change may be at the building or district level. It must be related to an area in need of improvement, and have a clear target in mind. The candidate must be able to identify noticeable and feasible differences that should exist as a result of the change plan (Wagner et al., 2006).
In the Policy Advocacy Document candidates develop and advocate for a policy at the local, state or national level using reflective practice and research as a means for
supporting and promoting reforms in education. Policy advocacy dissertations use critical theory to address moral and ethical issues of policy formation and administrative decision making (i.e., what ought to be). The purpose is to develop reflective, humane and social critics, moral leaders, and competent professionals, guided by a critical practical rational model (Browder, 1995).
Works Cited
Browder, L. H. (1995). An alternative to the doctoral dissertation: The policy advocacy concept and the policy document. Journal of School Leadership, 5, 40-69.
Patton, M. Q. (2008). Utilization-focused evaluation (4th ed.). Thousand Oaks, CA: Sage. Shulman, L.S., Golde, C. M., Bueschel, A. C., & Garabedian, K. J. (2006). Reclaiming
education’s doctorates: A critique and a proposal. Educational Researcher, 35(3), 25-32.
iv
Wagner, T. et al. (2006). Change leadership: A practical guide to transforming our
v
ABSTRACT
This mixed methods study examined the collaborative efforts between the Standards-Based Grading and Reporting Committee (SBGRC) at Mountain West High School (MWHS) and the Leadership District Team (LDT), which consisted of the following stakeholders: the district superintendent, the chief business officer, the chief financial officer, multiple principals and assistant principals, students, and parents of Mountain West School District (MWSD). These groups researched effective grading and reporting policies and procedures for possible implementation, and worked toward developing a specific, measurable, attainable, realistic, and timely (SMART) goal. In addition, a multiyear action plan was cocreated to streamline the process (DuFour, 2006). This change/action plan was codesigned to examine how to implement an effective standards-based grading and reporting system that is appropriate and reasonable for MWHS and MWSD. This study examined how, after reviewing local and national data and researching effective grading and reporting policies and procedures, key stakeholders collaboratively decided on the best way to measure and report academic achievement that would best prepare all students for success in colleges and careers.
In addition, this study, strived to shed light on a possible correlation between grade point average (GPA) and standardized test scores. Results showed that a quarter of the students with a “good” GPA (defined as 3.0 or above), who were in the top 25% of their class, performed at or below the level of the top 50% of students nationally on the Northwest Examination Assessment (NWEA)/Measure of Academic Proficiency (MAP), Partnership for Assessment of Readiness for College and Careers (PARCC), and the American College of Testing (ACT) exam. This begs the questions, “How could so many
vi
students be earning high marks in school, yet have such mediocre performance on standardized tests?”
What is more, the study revealed that nonacademic factors such as behavior, participation, attendance, and the ability to meet deadlines are included in local and national grading practices. These factors that distort students’ authentic academic performance.
vii
PREFACE
In mid- 2015, I assumed my new role as the director of bilingual education, dual-language and ESL for Mountain West School District (MWSD) and assistant principal at Mountain West High School (MWHS). Just days into my appointment, I was inducted into the Leadership District Team, composed of teachers, deans, instructional coaches, assistant principals, principals, district curriculum directors, directors of technology, and on special occasions, parents and students. I began working with the team on one of the district goals, namely, the exploration of standards-based grading and reporting (SBGR) through a change/action plan. This goal aligned not only to my personal belief in having a fair and appropriate grading system that supports learners, but also to my doctoral
studies.
Conducting a change plan supported my growth as a novice administrative leader in a plethora of ways. Oftentimes school leaders hastily implement changes without seeking input from all stakeholders or even determining if change is needed. Engaging in the process of working together to research effective grading and reporting policies and create a change plan has helped me understand the importance of bringing people together, of authentic collaboration, when deciding to make a change that affects all stakeholders. People want to be heard, and the best way to foster change is to include the stakeholders affected from the beginning.
This change plan was extremely meaningful because the entire process was cocreated with the input of all stakeholders: parents, teachers, students, administrators, and local leaders. In addition, the change plan supports the district’s vision of moving forward with standards-based grading and reporting.
viii
This process also prepared me to be a leader in my role as central office
administrator in two ways. First, it helped me understand that some schools may be ready for change, while others in the same district may not. Change needs to be systematic, but does not have to occur in all buildings at the same time. For change to be successful, the conditions, context, culture, and competencies need to be ready, which may or may not be the case in all schools in one district (Wagner, 2006).
Second, I learned that convincing others of the efficacy of standards-based grading and reporting needs to be accompanied by studies (both internal and external) that show statistical evidence of its potential for positive effects. My mentor, the principal of my building, often says, “Show me the data and I will give you my attention.” This is a powerful phrase that I hope to embody. In addition, earning support for change requires advocates to intentionally educate those who may be impacted through ongoing forums, meetings, or social media.
ix
TABLE OF CONTENTS
ABSTRACT ... V PREFACE ... VII TABLE OF CONTENTS ... IX LIST OF TABLES ... XIII LIST OF FIGURES ... XIV
SECTION ONE: INTRODUCTION ... 1
Background ... 1
Statement of the Problem ... 2
Rationale ... 8
Goals ... 15
Demographics ... 17
SECTION TWO: ASSESSING THE FOUR CS ... 18
Introduction ... 18
Context ... 19
Conditions ... 20
Culture ... 21
Competencies ... 22
SECTION THREE: RESEARCH METHODOLOGY ... 24
Research Design ... 24
Participants ... 26
Data Collection Techniques ... 27
Quantitative Data ... 27
Qualitative Data ... 28
Data Analysis Techniques ... 29
Qualitative Data ... 30
Quantitative Data ... 31
SECTION FOUR: RELEVANT LITERATURE ... 32
History of the Traditional Letter Grading System ... 32
History of School Standards ... 33
Challenges Associated with Traditional Grading Practices ... 34
Challenge #1: Purpose of Grading and Reporting ... 34
x
Challenge #3: Mathematical Equity ... 36
Challenge #4: Nonacademic Factors Included in Grades ... 38
Challenge #5: Retest/Redo Policies and Procedures That Influence Grading ... 40
Alternatives to the Traditional Letter Grading System ... 41
Remedial Coursework ... 44
Financial Cost of Remediation ... 46
Opportunity Cost of Remediation ... 46
Potential Income Cost of Remediation ... 46
SECTION FIVE: DATA ANALYSIS AND INTERPRETATIONS ... 48
Introduction ... 48
Grading and Grade Reporting Policy and Procedures Effectiveness Tool Survey Findings & Interpretations ... 49
Defining Respondents ... 49
Grading and Grade Reporting Policy & Procedures Survey ... 52
Defining Respondents ... 52
Survey Findings & Interpretations ... 52
MWSD Pre-Survey Findings & Interpretations ... 54
Defining respondents ... 54
Stakeholders Interviews Findings & Interpretations ... 57
Defining Respondents ... 57
Focus Group Interviews Findings & Interpretations ... 59
Defining respondents ... 59
SBG Teacher Observations ... 61
Defining Respondents ... 61
Quantitative Data Findings & Interpretations ... 62
Defining Respondents ... 62
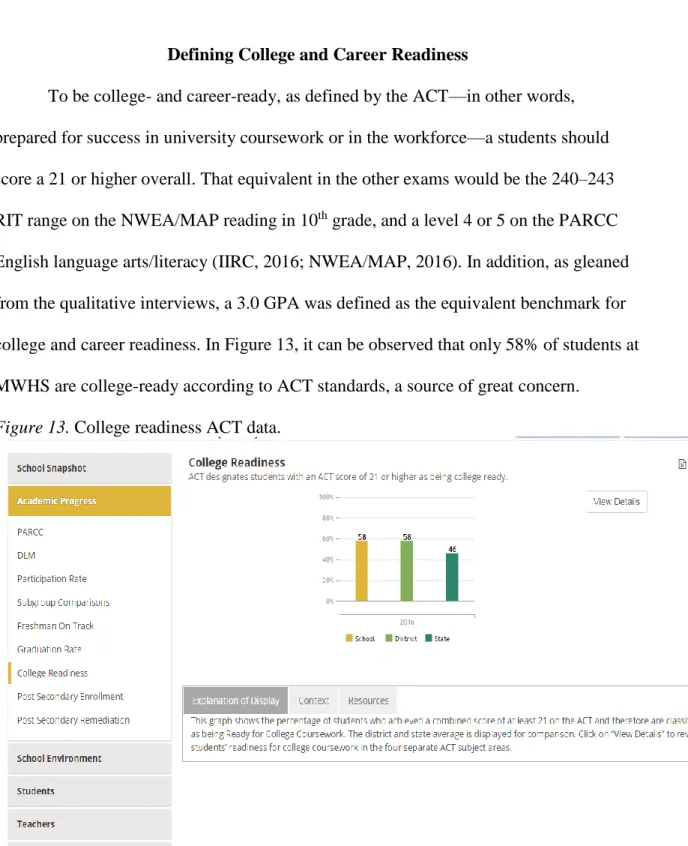
Defining College and Career Readiness ... 63
SECTION SIX: A VISION OF SUCCESS (TO BE) ... 67
Introduction ... 67
Context ... 67
Culture ... 68
Conditions ... 68
xi
SECTION SEVEN: STRATEGIES AND ACTIONS ... 70
Moving Forward ... 70
REFERENCES ... 74
APPENDIX A: MWSD/LDT ACTION PLAN TEMPLATE YEAR 1 ... 81
APPENDIX B: STANDARDS-BASED GRADING AND REPORTING COMMITTEE ACTION PLAN: YEAR 2 ... 83
APPENDIX C: QUANTITATIVE DATA OF MWHS ... 84
APPENDIX D: BASELINE 4 C’S ANALYSIS FOR STANDARDS-BASED GRADING AND REPORTING/AS IS ... 85
APPENDIX E: ANALYSIS FOR STANDARDS-BASED GRADING AND REPORTING/TO BE ... 86
APPENDIX F: ILLINOIS SCHOOL DISTRICT U-46 REPORT CARD 2015-2016: ENGLISH ... 87
APPENDIX G: ILLINOIS STATE U46 STANDARDS-BASED REPORT CARD: SPANISH . 88 APPENDIX H: CONSIDERATIONS FOR STANDARDS-BASED REPORTING ... 89
APPENDIX I: ILLINOIS STATE BOARD OF EDUCATION, PRACTIONERS’ FRAMEWORK FOR STANDARDS-BASED REPORTING AT THE ELEMENTARY LEVEL ... 91
APPENDIX J: GRADING AND GRADE REPORTING POLICIES & PROCEDURES SURVEY POWERED BY GOOGLE FORMS ... 93
APPENDIX K: INTERVIEW QUESTIONS FOR ALL STAKEHOLDERS INCLUDING STANDARDS-BASED GRADING AND REPORTING COMMITTEE MEMBERS (SBGRC) AND SBG PILOT TEACHERS ... 94
APPENDIX L: J STERLING MORTON HIGH SCHOOLS DISTRICT 201 GRADING POLICY AND PROCEDURES GRADING PHILOSOPHY ... 95
APPENDIX M: LINDBLOOM (CPS) MATH AND SCIENCE ACADEMY GRADING POLICY AND PROCEDURES ... 97
APPENDIX N: NAPERVILLE 203 PARENT GUIDEBOOK FOR STANDARDS –BASED REPORTING ... 100
APPENDIX O: SCHOOL DISTRICT U-46 GRADING POLICY AND PROCEDURES ... 104
APPENDIX P: MOUNTAIN WEST HIGH SCHOOL’S GRADING POLICY AND PROCEDURES ... 106
APPENDIX Q: INFORMED CONSENT... 111
APPENDIX R: INFORMED CONSENT ... 113
APPENDIX S: INFORMED CONSENT ... 115
xii
APPENDIX U: INFORMED CONSENT AND ASSENT ... 119 APPENDIX V: INFORMED CONSENT AND ASSENT ... 121 APPENDIX W: STANDARDS-BASED GRADING AND REPORTING COMMITTEE
INVITATION MOUNTAIN WEST HIGH SCHOOL ... 123 APPENDIX X: ANNOUNCEMENT TO PARTICIPATE IN VOLUNTARY SURVEY, LINK & QR CODE ... 125 APPENDIX Y: INVITATION FOR INTERVIEWS ... 127 APPENDIX Z: STANDARDS-BASED GRADING AND REPORTING COMMITTEE
AGENDAS ... 128 APPENDIX AA: REDO/RETAKE POLICY ... 130 APPENDIX BB: THE INTERNATIONAL SCHOOL YANGON ELEMENTARY SCHOOL REPORT CARD (GRADES 2-5) MYANMAR ... 131 APPENDIX CC: CALGARY BOARD OF EDUCATION 9TH GRADE REPORT CARD ... 134
APPENDIX DD: CALGARY BOAR OF EDUCATION 3RD GRADE REPORT CARD ... 138
APPENDIX EE: CONSIDERATIONS FOR STANDARDS-BASED REPORTING MS/HS ... 143 APPENDIX FF: ILLINOIS PRACTITIONERS’ FRAMEWORK FOR STANDARDS-BASED REPORTING MS/HS ... 145 APPENDIX GG: MWSD ELEMENTARY STANDARDS BASED REPORT CARD ... 148 APPENDIX HH: SBG ENGLISH DEPARTMENT ELECTRONIC GRADEBOOK AND GRADE CATEGORIES ... 149 APPENDIX II: GRADE AND GRADE REPORTING POLICIES AND PROCEDURES
EFFECTIVENESS TOOL POWERED BY GOOGLE FORMS ... 150 APPENDIX JJ: STANDARDS-BASED GRADING AND REPORTING NIGHT ... 152 APPENDIX KK: INVITATION TO ATTEND STANDARDS-BASED GRADING NIGHT .. 153 APPENDIX LL: STANDARDS-BASED GRADING NIGHT POWERPOINT ... 154 APPENDIX MM: 5.0 SCALE WITH LETTER GRADES AND PERCENTAGES ... 158 APPENDIX NN: SBG MATH DEPARTMENT ELECTRONIC GRADEBOOK AND GRADE CATEGORIES ... 159
xiii
LIST OF TABLES
Table 1. Grade and Grade Reporting Policy & Procedures Survey ... 53 Table 2. SBG pilot teacher observations. ... 62
xiv
LIST OF FIGURES
Figure 1: O’Connor (2002) highlights the key differences between standard-based and the
traditional grading system. ... 4
Figure 2: Lahey (2014) compares student performance in a point-based/grade report and a standards-based report. ... 5
Figure 3. Post-Secondary enrollment among graduating seniors at MWHS. ... 13
Figure 4. Typical letter grading and numerical scale (adapted from Guskey, 2015). ... 37
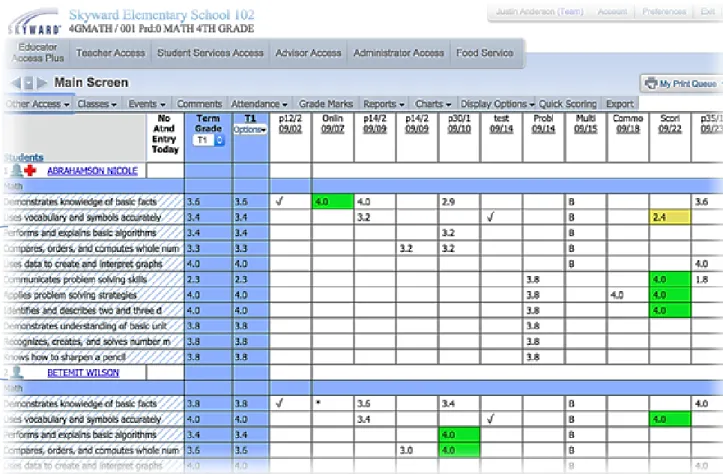
Figure 5. An electronic standards-based gradebook on Skyward. ... 42
Figure 6. Traditional digital gradebook with percentages, grades, assignment types, ... 44
and a +/- system. ... 44
Figure 7. Post-secondary remediation data. ... 45
Figure 8. Lifetime earnings by academic attainment. ... 46
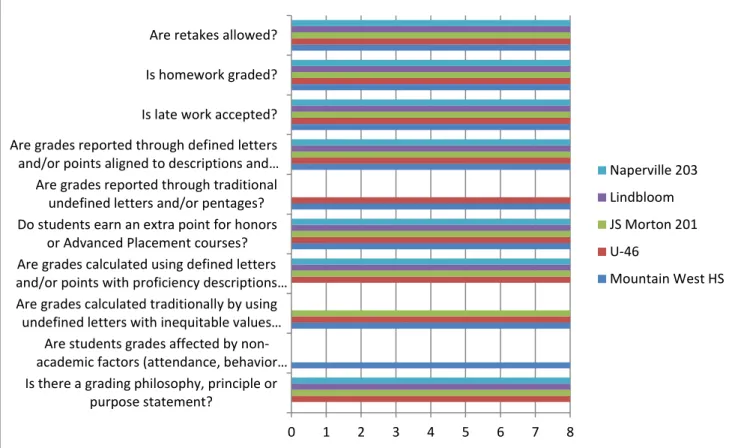
Figure 9. Grading and Grading Policy & Procedures Effectiveness Tool Survey. ... 50
Figure 10. Survey respondents’ identified roles. ... 52
Figure 11. Pre-survey results. ... 54
Figure 12. Stakeholders/interviewees. ... 58
Figure 13. College readiness ACT data. ... 63
Figure 14. Students with 3.0+ GPA and 21+ ACT score. ... 64
Figure 15. Students with 3.0+ GPA and proficient growth rate on NWEA/MAP Reading ... 65
... 65
1
SECTION ONE: INTRODUCTION Background
For more than 100 years, the US educational system has been evaluating student performance using the current letter grade system: A through F (in some cases E), 0 to 100 percent, with point accumulation a primary factor (Durm, 1993; Guskey, 1994; Matthews, 2005). This evaluation structure is familiar to almost all Americans who went through schooling in the United States. Yale University was first to report achievements of students via categories, and Harvard University was the first to report a traditional letter grade assigned to a pupil in 1883 (Durm, 1993; Matthews, 2005). The grading system as we know it today was fully developed at Mount Holyoke College in
Massachusetts in 1897 (Durm, 1993; Matthews, 2005). Unfortunately, that system has changed much since its inception, even though states have adopted specific and
measurable learning targets, state standards and 47 states have adopted the Common Core State Standards (CCSS) since 2010 (CCSS, 2016).
What is even more astonishing is that a majority of teacher preparation programs in the finest colleges and universities nationwide do not require, or even offer, a course in assessment and grading (Guskey, 2009; Guskey, 2015). I personally attended one of the finest public universities in the United States—the University of Illinois at Urbana-Champaign—for my teaching preparation experience and was not afforded the opportunity for a course in assessment and grading.
It is my hope, in this change plan, to explore and implement a new methodology in measuring student performance in schools through standards-based grading and reporting (SBGR). This system measures skills acquired by students compared to set
2
standards, so as to begin authentically measuring and communicating student
achievement in content areas as demonstrated by their mastery of the skills needed to be successful in the colleges and careers of the 21st century.
New and common standards throughout the country, as well as the skills required to access upward financial and social mobility, demand that schools embrace change, innovate, and implement new systems that capture and inform students’ demonstrable abilities.
Statement of the Problem
The problem that calls for change is the traditional grading system used to record and communicate academic achievement. The traditional letter grading system obligates teachers to evaluate student performance in a plethora of content areas—english, math, science and social studies—for no practical, procedural, or ethical reason (Guskey, 2015). Also, there is limited research on how and why the traditional letter grade system is used in schooling; yet, since 1971, more than 80% of schools in America have used some sort of the traditional letter grade method (Durm, 1993; Guskey, 2013). Many believe that the traditional grading system is hopelessly inaccurate, that it lacks meaningful feedback, is inequitable, archaic, not rooted in research, and often rewards and incorporates
nonacademic factions (e.g., on-time task completion) into a student’s overall grade (Amundson, 2011; Marzano & Heflebower, 2011; O’ Connor, 2011; Guskey, Jung, & Swan, 2011; Dueck, 2014; Guskey, 2015; Vatterott, 2015; Schimmer, 2016).
Moreover, with its permanent academic marks, the traditional grading system penalizes organizational, behavioral, and executive functioning issues that should and could be addressed separately from academic achievement. Despite the best of intentions
3
from educationalists, grades seem to reflect student compliance, rather than achievement and engagement. This leads to inflated and trivialized grades, undermining the entire learning process (O’ Connor, 2011; Dueck, 2014; Guskey, 2015; Vatterott, 2015; Schimmer, 2016).
As an educational leader, I have a difficult time interpreting academic
achievement through the current, traditional letter grading system. What do letter grades truly communicate? Mastery? Compliance? How do we know that? What does the letter mean in terms of a student’s ability to read well or demonstrate a skill based on
standards? I also wonder how parents, students, teachers, administrators, and other key stakeholders make inferences about the mastery of skills through the traditional letter grading system. I believe the current grading system cannot answer those questions; thus, a different system is needed that seeks to provide more information and evidence of student learning.
Fortunately, there is hope, thanks to innovative grading reforms: standards-based grading (SBG) or standards-based grading and reporting (SBGR), both of which are referenced and used interchangeably throughout this study. These systems have been in development since the late 80s in the Fairfax County School District in Virginia and in practice throughout the United States in the 21st century (Fairfax County Public Schools, n.d.). SBG, or grades based on standards, a phrase coined by Schimmer (2016), is a pedagogical evaluation practice wherein teachers report student performance based a select level of performance descriptors in a data management system or report card (Guskey, 2001; Reeves, 2008; Guskey & Jung, 2011; AnkenySchools, 2014; Andrews, Barnes, & Gibbs, 2016; Schimmer, 2016).
4
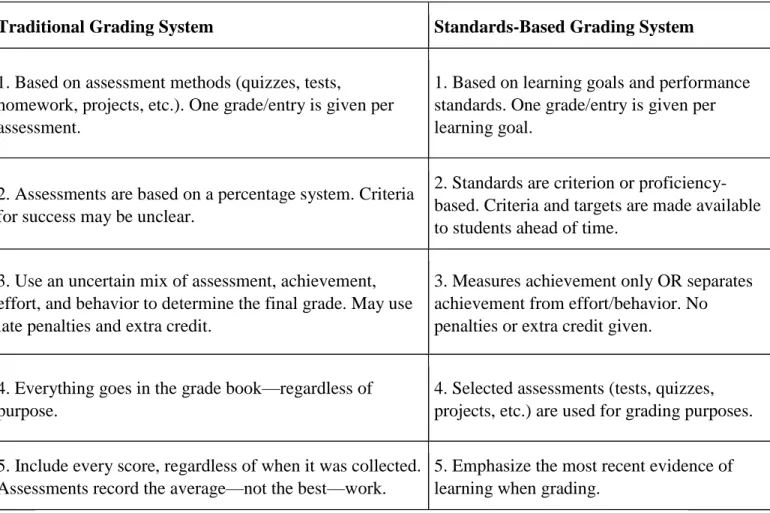
The differences between the traditional grading system and the SBG system are stark. Figure 1 compares the two systems’ fundamental uses, demonstrating clearly the pros and cons of each.
Figure 1. O’Connor (2002) highlights the key differences between standard-based and
the traditional grading system.
Traditional Grading System Standards-Based Grading System
1. Based on assessment methods (quizzes, tests,
homework, projects, etc.). One grade/entry is given per assessment.
1. Based on learning goals and performance standards. One grade/entry is given per learning goal.
2. Assessments are based on a percentage system. Criteria for success may be unclear.
2. Standards are criterion or proficiency-based. Criteria and targets are made available to students ahead of time.
3. Use an uncertain mix of assessment, achievement, effort, and behavior to determine the final grade. May use late penalties and extra credit.
3. Measures achievement only OR separates achievement from effort/behavior. No penalties or extra credit given.
4. Everything goes in the grade book—regardless of purpose.
4. Selected assessments (tests, quizzes, projects, etc.) are used for grading purposes.
5. Include every score, regardless of when it was collected. Assessments record the average—not the best—work.
5. Emphasize the most recent evidence of learning when grading.
The traditional grading system, represented through undefined letters, points, and percentages, distorts and misreports a student’s actual level of performance because low and high grades are averaged together. Furthermore, behavior and promptness may be included in grades, and criteria for success on assignments can be unclear and not linked
5
to standards. However, SBG measures achievement and executive function skills, such as organization, attendance, promptness, and behavior, separately from grades.
In addition, SBG emphasizes the most current evidence of learning when grading; it is based on learning goals and the CCSS, national standards common in almost all U.S. states (O’ Connor, 2011; Dueck, 2014; Guskey, 2015; Vatterott, 2015; Schimmer, 2016).
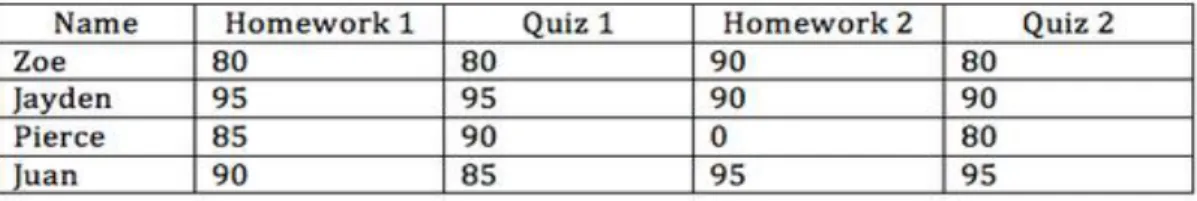
In classroom grading and reporting, it is evident that SBG strives to be more accurate than the traditional grading system at identifying students’ proficiencies or deficiencies. Figure 2 illustrates an example of students’ performance under the traditional and SBG systems.
Figure 2. Lahey (2014) compares student performance in a point-based/grade report and
a standards-based report.
In a points-based gradebook, the student at the top, Zoe, might assume she’s doing great, but according to the standards-based gradebook, she (and the teacher) can see that Zoe is not proficient in an essential skill she needs to move forward in her
6
writing education. Conversely, Pierce’s points-based grade would be lower than Zoe’s due to that lost homework assignment, but in reality, he is already proficient in the skill that assignment was designed to reinforce. (Lahey, p. 1, 2014).
Also, Pierce, who is proficient in the SBG report card, would likely be receiving a 66%, a D, when averaging assignments; meanwhile, Zoe, who is not proficient on any skill needed to write a proper argumentative essay, would be earning an 82.5%, a low B. This grade would communicate an inaccurate representation of Zoe’s writing skills, thus putting her at risk for low performance on standardized testing, next-level coursework, and introductory college classes. By contrast, Pierce, who is proficient in writing, receives a low grade, thus miscommunicating his skills and limiting his schooling opportunities.
SBG clearly communicates any student’s level of proficiency according to standards, which is why this well-research methodology of grading and reporting is becoming extremely popular (O’ Connor, 2011; Dueck, 2014; Guskey, 2015; Vatterott, 2015; Schimmer, 2016). In fact, its popularity is such that SBGR is currently practice in schools and districts throughout the United States and the world.
In Illinois, U-46, which encompasses elementary, middle, and high schools from 11 communities of DuPage, Kane, and Cook Counties, is currently implementing SBGR. This is reflected on students’ report cards (SD U-46, n.d.). In their report cards,
elementary and middle school students are graded using four levels of performance descriptors to determine mastery (SD U-46, n.d.):
• Level 1. Does not demonstrate understanding of concepts.
7
• Level 3. Consistently demonstrates understanding of concepts.
• Level 4. Demonstrates in-depth understanding of concepts.
These performance descriptors are then used to evaluate students’ current level of performance for each standard in each content area. (For the report card example in English and Spanish, see appendices F and G.) U-46’s standards-based report card
mirrors the recommended example as established by the Illinois State Board of Education (available in the Appendix I).
In Calgary, Canada, the Calgary Board of Education has adopted a standards-based report card (Schimmer, 2016). The report card intentionally separates behavior and academic achievement by having sections in which teachers can report progress on both. Academic progress and achievement is evaluated using a four-point scale:a 4 is excellent, a 3 is good, 2 is basic, and a 1 marks that the student has not met the standard. These scores are documented next to specific standards (Schimmer, 2016). (For the Calgary report cards, see appendices CC & DD.)
Across the world, in Myanmar (formerly Burma), a southeast Asian nation, the report card clearly states the purpose of learning, separates behavior from academic achievement, and uses a 1 through 4 proficiency scale similar to Illinois. In addition, the report card separates languages from other criteria, because the language program is assessed according to the American Count of Teachers of Foreign Languages Standards (ACTFL) (Schimmer, 2016). This report card, when compared to its traditional letter-grade counterpart, is truly standards based (Schimmer, 2016). (For an example of this report card, see Appendix BB.)
8
I wholeheartedly believe that if change is implemented successfully, if we overhaul the traditional grading system to one reflecting the mastery of skills aligned to standards, as done in many parts of the United States and throughout the world, students at every level will receive authentic feedback and evaluation on the skills necessary to be career- and college-ready. This would work to close the achievement/opportunity gap between grades for every student and reduce the number of remedial courses needed by high school graduates in postsecondary institutions.
Rationale
I chose to focus on this problem because grading (and grade reporting) is the single most important responsibility bestowed upon teachers and school administrators (Wormeli, 2006; Guskey, 2006; Guskey, 2015; Schimmer, 2016; Vatterott, 2015;
Marzano, 2015). For elementary and middle school students, grades determine whether a student gets promoted to the next grade level, earns the opportunity to join an honors program, participates in extracurricular activities, and is eligible to receive in-school privileges. For high school students, grades can determine access to extracurricular activities, scholarships/grants, internships, honors programs, in-school
privileges/rewards, high-paying careers, and university admission (Guskey, 2006; Andrew, Barnes, & Gibbs, 2016). One misrepresented grade could have irreparable consequences that last a lifetime; this is why grading must be used as an evaluative tool that authentically measures student proficiency on specific skills aligned to the CCSS, rather than a comparative tool that pits one student performance against the other.
When comparing students academically, grades represent a type of extrinsic achievement motivation. A very popular social-cognitive theory of achievement
9
motivation, called goal orientation theory, examines why students are engaged in their work (Brophy, 1998; Bradbury-Bailey, 2011). This theory indicates that there are two types of goal orientations: a performance orientation goals type, in which the goal is to get the highest grade in relation to other classmates, and the mastery orientation type, wherein the goal is understanding, along with acquiring skills and knowledge (Brophy, 1998). For disenfranchised minorities, the latter type has yielded more positive academic results because makes it possible for all students to meet targets through reassessment and specific feedback, and encourages them do so. By contrast, with the former goal type, fostered through the traditional grading system and its assignments, feedback is rare; having the highest score is the goal. This goal type has been found ineffective at motivating minorities, because historically, minorities have been alienated from the educational system and tend to perform worse academically in many content areas, compared to Whites (Brophy, 1998). Mastery orientation best lends itself to SBG because it requires specificity in what skills or knowledge are needed for success; it encourages mastery, unlike the traditional grading system. Brophy (1998) encouraged teachers to be intentional in helping students create goals. Having an intended outcome as it relates to a lesson or skill needed to be successful in school can motivate students to improve
academically.
In the traditional grading system, grades are artificially inflated with extra credit, attendance, and comportment, or even something as inconsequential as turning in a signed syllabus—items all unrelated to a student’s mastery of necessary skills (O’ Connor, 2011; Guskey, 2013; Dueck, 2014; Guskey, 2015; Vatterott, 2015; Schimmer, 2016). Grades do not reflect what students are learning. Letter grades do not measure a
10
student’s ability to read, write, listen, or communicate—all 21st century skills needed to be successful (Wagner, 2006: O’ Connor, 2011; Dueck, 2014; Guskey, 2015; Vatterott, 2015; Schimmer, 2016). If students are to be successful, they need to receive authentic, measurable feedback related to the skills they need to prosper in the classroom and in the world (O’ Connor, 2011; Dueck, 2014; Guskey, 2015; Vatterott, 2015; Schimmer, 2016).
Wilcox (2011) demonstrated, through a qualitative survey and quantitative data, that authentic feedback through a standards-based rubric led to students being more engaged in learning. In addition, it improved grades and self-reflection in high school science courses. The SBG rubric allowed for students to receive consistent, accurate, authentic and actionable feedback in multiple assessments and assignments. In addition, when comparing his previous cohort of students to the standards-based group without having changed his instruction, students in the SBG group earned higher test averages in physics and biology (Wilcox, 2011). SBG encourages students to fix mistakes and be more diligent. The students themselves stated, “Now that I get specific feedback on what I don’t know, instead of just a percentage point, I make that a goal to conquer. I am more motivated to learn and I know what I exactly need to do to learn” (Wilcox, 2011).
The study abovementioned highlighted how standards-based practices motivated students to improve their academic achievement and close the achievement /opportunity gap.
Closing the achievement/opportunity gap should be a priority for all educators, especially those in high-poverty and minority school districts that are striving to improve achievement for students at all grade levels. Bradbury-Bailey (2011) was able to
11
classrooms, including the sciences and humanities, outperformed their peers from years prior, who had been graded under the traditional grading system, on the End of Year Content Test (EOCT), state standardized exams per content area in the state of Georgia. The research found this was the case because students in an SBG system were able to master the content through multiple tries, teachers were able to given specific feedback aligned to the standards, and student were able to correct previous mistakes—all effective practices that prepared students for the EOCT (Bradbury-Bailey, 2011). Before SBG, students took an exam once. They earned a score with little to no feedback, and the teacher moved on. Under SBG, students were afforded multiple opportunities to truly understand and apply relevant concepts.
In another comprehensive investigation, Hardegree (2012) was able to
demonstrate through quantitative data that indicators on standards-based report cards (SBRC) correlated with scores on standardized testing. In this case, the exam was a criterion-referenced competency test (CRCT) administered to 550 fifth graders from eight elementary schools. Regardless of gender, English language learner (ELL) status, or socioeconomic background, elementary students with proficient or better indicators in specific skills related to math and reading outperformed peers with developing
proficiency skills indicators on the CRCT (Hardegree, 2012). In other words, the study provided evidence to suggest that standards-based grade reporting provides accurate student achievement information that may predict performance on standardized testing, something that has proven a challenge for the traditional grading system.
In Haptonstall (2010), the investigatory work examined the correlation between students’ grades in core subject areas and their scores on the Colorado Student
12
Assessment Program tests in reading, writing, math, and science. The study also examined the mean scores of varying subgroups to determine the existence of any dependent variable, such as students’ school districts. While all the school districts that participated in the study demonstrated a significant correlation between grades and test scores, Roaring Fork School District Re-1, which used a standards-based grading model, demonstrated both higher correlations and higher mean scores and grades across the board, in both the overall population and subgroups (Haptonstall, 2010). In other words, SBGR is a strong predictor of student performance on standardized testing.
In Nebraska, Stephens (2010) demonstrated that grading varies greatly from teacher to teacher. Teachers who taught the same subjects had different ways of
calculating grades. Some gave full credit for a late assignment while others did not. Some reduced grades for inappropriate behaviors while others did not. The inclusion of
nonacademic factors in grades, such as behavior and promptness, distort students’ current level of performance. This lack of consistency led to huge gaps in grading for students completing identical tasks (Stephens, 2010). Giving students the right, accurate grades is not only the right thing to do, it has consequences beyond high school.
Almost 2 million students—one-third of high school graduates who make it to college—are enrolled in remedial classes that are not transferrable and serve as gatekeepers to the introductory level college coursework (DuFour, 2015; Vatterott, 2015). In other states, like California, Alabama, and Alaska, this number was as high as 50% (Stenhouse Publishers, 2014). In other words, high school graduates with
presumably “good” enough letter grades to earn admissions to fine state and private universities are not adequately prepared for beginning college course work.
13
This underpreparedness may also impact university enrollment. As Figure 3 demonstrates, only 76% of graduating seniors at Mountain West High School1 (MWHS) enrolled in two- or four-year colleges within 12–16 months, leaving almost a quarter out of postsecondary opportunities.
Figure 3. Post-secondaryenrollment among graduating seniors at MWHS.
I have found discussing student achievement and opportunities at team data meetings to be very frustrating and disheartening. The team is made up of teachers, paraprofessionals, counselors, administrators, special education staff, and English Language Learners (ELL) educators at MWHS, one of four campuses of the Mountain West School District2 (MWSD). This team meets every Tuesday morning for an hour
1 MWHS is a pseudonym. 2 MWSD is a pseudonym.
14
block and quarterly for a double block and is responsible for the academic and social-emotional well-being of students, particularly those in need.
The frustration is palpable throughout the room when team members report on their assigned group of students to monitor and mentor. Each group consists of no more than five students who are at the bottom 10 to 15% of academic performance, are truants, or have social-emotional learning struggles or any other major concerns. This population of students is identified at the beginning of the year using preexisting data, and team members are assigned new students every four to six weeks. What is more, the group monitor/mentor presents a spreadsheet document which includes grades, percentages, referrals, attendance, and other notes. During group discussions and presentations, the team has noticed that a student could have a failing grade one week and then an 80% the next. What happened?
What is more, when we investigate deeper, we find that sometimes the difference between passing and failing is completion of a single homework assignment, or doing the extra credit, or participation, or behavior, or even something as simple as bringing in cans for the food drive or turning in the signed syllabus. None of these activities are related to the learning standards. Also, students’ grades change and vary so drastically that often the only solution for academic improvement is an assigned academic support period, similar to a study hall, with one adult who may or may not have sufficient knowledge in the area of need.
Furthermore, the team reviews the “F list,” which keeps a record of students failing one or more courses. Unfortunately, because of the wild fluctuations in grades,
15
students come in and out of that list so erratically that it has become difficult to create meaningful, skills-focused interventions or action plans.
The traditional letter grading system makes it difficult to create these strategies for keeping students on grade level and on track for graduation, since it is difficult to decipher why a student is failing a particular course. Thus once again, the system undermines the collective effort of teachers, school improvement teams, and students being served (Guskey & Jung, 2012; Peters & Buckmiller, 2014).
Grades should communicate achievement, but too often, they communicate compliance or lack thereof (O’Connor, 2011; Dueck, 2014; Guskey, 2015; Vatterott, 2015; Schimmer, 2016). How can we truly know students are learning with such a system in place in many schools? How can the achievement/opportunity gap be closed if grades might not represent a student’s actual level of performance?
Grading shouldn’t create obstacles to student learning; it should allow teachers to generate specific information relating to real standards to help students learn.
Unfortunately, the traditional grading system creates obstacles. It is archaic and filled with nonacademic factors, and does not reflect students’ mastery of skills needed to meet standards (Guskey, 1994).
Goals
The intended goal of this change plan is to move beyond the traditional letter grading system that has been in place at MWSD for 40 years to a SBGR system that measures student’s performance against the CCSS or other national standards (Durm, 1993; Guskey, 1994; CCSS, 2016). I believe that if this change takes place, MWHS will be able to close the achievement/opportunity gap, communicate accurate student
16
achievement, increase admissions into two- and four-year universities, make passing classes more accessible to students, improve standardized test scores, identify specific and targetable skills in reading, writing, communicating, and calculating, and overall better prepare pupils for pre- and postsecondary opportunities.
Since changing grading systems represents a major paradigm shift, a thoughtful, multiyear plan formed with the input of as many stakeholders as possible is key.
Teachers, community leaders, parents, students, administrators, and local politicians are necessary to ensure everyone is on board with the new system (Senge, 2012; Schimmer, 2016). Fortunately, a year-one plan (see Appendix A) was drafted during the summer of 2015 with stakeholder input from the researcher—the director of bilingual
education/dual-language and ESL for MWSD and assistant principal at MWHS—chair of the standards-based grading and reporting committee (SBGRC), and members of the Leadership District Team (LDT), which included stakeholders from multiple roles all over the district. In addition, three teachers who were members of the LDT had
personally volunteered to pilot SBG in mathematics and English for the upcoming school year, after going through professional development in SBG and hearing the
administrators’ commitment to exploring and possibly implementing the system. Thus, they would serve as strong political allies and recruits for the SBGRC, a committee created by the researcher to collaboratively investigate the most effective grading system for MWHS and MWSD.
Lastly, this problem should be approached through a unique blend of a technical and adaptive framework. Technical challenges are those for which the problem and solution are clearly defined. In this case, the problem is the letter grading system and the
17
solution is SBGR. However, SBGR is a relatively new approach that may require learning, experimentation, and adaptation as implementation progresses (Drago-Severson, 2009; Heifetz, Grashow, & Linksey, 2009; Senge, 2012). Furthermore, adopting a new grading system will require change in what people do, feel, and think— the key tenets of an adaptive challenge (Drago-Severson, 2009; Heifetz et al., 2009; Senge, 2012).
Demographics
MWSD is a west suburban school district located in DuPage County, Illinois, just west of Cook County (IIRC, 2016). MWHS is one of four campuses in MWSD, and it has a student population of approximately 500 in 9th through 12th grade (IIRC, 2016).
Caucasians make up 68% of the population, Hispanic/Latino students 16%, African-Americans 6%, Asians 5%, with the final 3% of mixed ethnicity (IIRC, 2016). Moreover, MWHS has been a Title I school for years, referring to the title grant given to schools with 40% or more of its students classified as low-income by the federal government (IIRC, 2016).
Students at MWHS have composite average of 20.5 on the ACT examination, 0.5 below the state average (IIRC, 2016). Also, and most currently, 41% of students met or exceeded the standards of the PARCC examination for English language arts (ELA), while only 7% did so on the math portion of the test (IIRC, 2016).
MWHS serves the communities of the western suburbs of Chicago. The
communities have a wide variety of housing options and prices. Homes in the areas can range from $100,000 to $500,000, and apartments can go from $800 to $1,400 in monthly rent (Zillow, 2016).
18
SECTION TWO: ASSESSING THE FOUR CS Introduction
The four Cs—conditions, culture, competencies, and context—is a diagnostic tool used to examine an organization’s effectiveness and make educational leaders think systematically when formulating proposals for change plans and school improvement goals (Wagner et al., 2006). The tool is intended to help identify one’s current reality— the as is—and to picture the desired outcome—the to be (Wagner et al., 2006).
Condition is defined as “external architecture surrounding student learning, the tangible arrangements of time, space, and resources (Wagner et al., 2006, p. 101). This can refer to any number of things:time dedicated to stakeholders through meetings or classroom instruction; expectations around roles and responsibilities; student results tied to formative and summative assessments; procedures, policies, and contracts; or even the physical space of a building and its utility.
Competencies are defined as the “repertoire of skills and knowledge that influence student learning” (Wagner et al., 2006, p. 99). The understanding and ability to apply knowledge through learning strategies and education systems fall under this category.
Culture is defined as “the shared values, beliefs, assumptions, expectations, and behaviors related to students and learning, teachers and teaching, instructional leadership, and the quality of relationships within and beyond the school” (Wagner et al., 2006, p. 102).
Context is defined as “skill demands all student must meet, and concerns of the families and community that the school or district serves.” Current realities surrounding
19
educational programming and academic performance would fall in this category, as would the school vision and mission.
In creating Appendix B, I took a systematic view of MWSD and more
specifically, MWHS, where I work as an assistant principal. I focused on SBG but also took into account staff beliefs, grading practices, assessments, and current committees dedicated to improving student achievement. I applied the four Cs framework as outlined in this section and described in Change Leaders: A Practical Guide to Transforming Our
Schools, by Tony Wagner and his colleagues (2006), to help ensure that I examined all
areas of my district’s practice.
Context
MWSD is a unit school district, with approximately 1,500 students spread over two elementary schools, one middle school, and one high school. Current district leadership grants autonomy to all buildings; thus, any successful change plan proposed may begin in one school then be adopted at other buildings. Wagner et al. (2006) stated that context refers to the larger organizational systems in which we work. For a school this might be the district, for a district this might be the state, and for the state this might be the nation.
MWSD has been using the traditional letter grading system to report academic achievement since the school opened 40 years ago. However, during the summer of 2015, just one month upon my arrival as the director of bilingual education/dual-language and ESL of MWSD and assistant principal for MWHS, many stakeholders—the
superintendent, the chief business officer, the chief academic officer, the principals, the assistant principals, and the researcher—proposed the investigation of an authentic
20
student achievement measuring system aligned to the state standards so as to better identify the skills students need to be successful within and beyond the classroom. These educationalists, who were members of the LDT, identified SBGR as that potential system. After many formal and informal dialogues during the summer, SBGR quickly became one of the many missions for the LDT to explore and possibly implement. In addition to meeting in the summer, the team meets quarterly throughout the academic year. The group is made up of students, parents, teachers, and administrators of all levels and from all four district campuses. More importantly, the LDT is led by the
superintendent and other administrative designees, including myself; however, the vast majority of topics and action items are led and proposed by the superintendent.
Moreover, according to the Partnership for Assessment of Readiness for College and Careers (PARCC) examination, the state of Illinois’s test, 41% of students met or exceeded the English language arts standards and only 7% met or exceeded the math standards at MWHS at the time of this research (IIRC, 2016). These statistics are of great concern to me, as the assistant principal, the researcher, and a main stakeholder
responsible for students’ performance and the curriculum and instruction they receive.
Conditions
Wagner et al. (2006) stated that conditions include school policies. Every school in MWSD uses the traditional letter grading system to measure and communicate academic achievement to students and parents, as written in district policy. However, kindergarten through second grade classes in the district do use a standards-based report card (see Appendix GG). What is more, a few teachers are experimenting with versions
21
of SBG in the gradebook and grade categories (see appendices HH and NN). This information can also be found in every school’s handbook and the district website.
Moreover, formative and summative assessments—assignments used in the learning process and at the end of learning (Wormeli, 2006)—are scored using points. Thus, the more points one accumulates, the better the current and overall grade; the opposite is also true. This accumulation of points is an erroneous measure of a student’s ability, because if a student has a tough start and misses a large chunk of available points, then he or she spends too much time catching up, and the cumulative score does not paint an accurate picture of what the student can do.
Furthermore, besides the LDT and three teachers experimenting with SBG, very few stakeholders are aware of SBGR. Collegial dialogues about SBGR with stakeholders other than the LDT are nonexistent. Lastly, a data collection system capable of aligning standards to assessment is in place at MWHS, but not the other campuses.
Culture
Teachers from MWSD have been using the traditional letter grading system to communicate student achievement for the last 40 years, so changing that system could prove extremely difficult. However, there is hope, because innovative practices have taken root throughout the district during the last five years. For example, MWSD is one of only 27 districts out of almost 900 in the entire state of Illinois to have a dual-language program at one of its elementary schools (IASB, 2016). Moreover, professional learning communities (PLCs) that did not exist three years ago have been fully implemented at all MWSD campuses. MWHS has been the campus most willing to embrace change, as long
22
as the proposal is structured and supported with research (see Section Five: Data Analysis and Interpretations).
According to the Illinois 5Essentials Survey, an online survey created by the University of Chicago and the Urban Education Institute to measure school climate and culture through a variety of questions for different stakeholders, approximately 95% of the staff are willing to follow administration’s initiatives at the high school level, but only 50% of the staff are on board at the junior high and elementary levels (IIRC, 2016). Wagner et al. (2006) defined culture in this sense as the beliefs of staff as it relates to student learning and the overall school environment. Thus, it can be inferred that the high school teachers are more willing to change than the elementary school teachers.
Competencies
Wagner et al. (2006) stated that competencies are most effectively built when professional development is focused, job-embedded, continuous, constructed, and collaborative. The current challenge for MWSD is that it lacks professional development opportunities for stakeholders to develop a profound understanding of SBGR. And, considering none have been provided, almost all staff members, from kindergarten through 12th grade, lack the skills to implement SBGR with fidelity.
Moreover, only a handful of administrators have a general understanding of SBGR and its benefits, since not all administrators are required to be part of the LDT, which oversees the standards-based action plan. Thus, there is very little information and awareness about SBGR outside the team and teachers experimenting with it.
23
Fortunately, three brave and innovative educators—Bob Ratch,3 Katy Lopp,4 and Christina Portage5—teachers at MWHS and members of the LDT, volunteered to
implement SBG during the 2015–2016 school year. In addition, one dual-language teacher from the elementary school volunteered to participate in SBG along with her traditional grading system. She was willing to try a new system, but not ready to let go of the one she had been practicing for more than six years, nor participate in the study.
Teachers willing to test new pedagogy of grading and reporting renewed all educators’ hopes of providing students with fair and accurate academic feedback that truly represents what they are able to do in the near future. Students deserve the best opportunities in the classroom, opportunities that are researched based and success-centered. The bravery of these teachers inspired me, a practitioner, to design the research methodology on their experiences.
3 This name is a pseudonym. 4 This name is a pseudonym. 5 This name is a pseudonym.
24
SECTION THREE: RESEARCH METHODOLOGY Research Design
I focused on what can be learned when an institution permits one of its administrative leaders to bring stakeholders together in the exploration of data and literature, in this case related to effective grading and reporting policies and procedures, through a case study model. This model requires the researcher to generate themes or conclusions from observations focused on a specific task (Patton, 2008). I interviewed and observed the three SBG pilot teachers’ grading practices, obtained copies of their gradebooks and grade categories (see appendices), and analyzed feedback provided by those teachers to students and how it is linked to the mastery of standards in each of the educators’ concentrations. In addition, I gathered current and archival data on
standardized test scores and grades so as to explore how the latter relates to the former. Furthermore, an important course of action in this research was establishing a voluntary and committed Standards-Based Grading and Reporting Committee (SBGRC), composed of all stakeholders: two administrators, a teacher, a student, a board member, a local entrepreneur, a local politician, and a parent. Starting in late October 2016, the committee began meeting monthly for two hours to complement the LDT’s quarterly meetings. The goal of the SBGRC was to support the LDT’s year-one action plan and create the year-two implementation plan.
The SBGRC’s main responsibilities were to evaluate current grading policies and procedures as they relate to the mastery of standards, search for best practices that have yielded accurate portrayals of students’ abilities, look at data on grade point average and its relation to achievement in standardized testing, and find areas in the LDT’s SBG
year-25
one action plan to impact. This group was also subject to interviews and surveys, and served as a focus group.
More important, my change plan focused on moving the year-one action plan forward. The action plan (found in Appendix A) called for an increase in the
understanding of effective grading practices aligned to SBG for teacher and parent stakeholders during year one. Faculty’s current level of understanding of effective practices was measured through a pre-survey, as reported in Section Five. Next, the plan called for a post-survey, which would include the same questions and be administered sometime before the end of the school year, after professional development opportunities for teachers had been provided. Unfortunately, the post-survey was not developed by the conclusion of this study. Teachers did share at faculty meetings that their knowledge of SBGR did increase thanks to readings facilitated by the researcher during faculty
meetings. The plan also called for information sessions to be provided to parents through a parent university (a forum of information). These sessions would help parents
understand the benefits of effective grading practices and SBGR. Informing parents about the topic became the key area enhanced by the SBGRC.
Lastly, year two calls for a plan to implement SBGR. This was talked about at a LDT meeting, but at the end of this study, there was no formal commitment by local administrators to implement SBGR. The plan was nevertheless created (see Appendix B).
Wagner et al. (2006) would categorize the action plan under, appropriately, the planning stage. Consequently, my hope is to enhance the action plan with an end goal and move from the planning stage to the implementation stage. However, before that can
26
occur, the action plan must be completed and there must be commitment to follow it. This is the desire of the intended users and the LDT.
In addition, any change plan, but especially one coming from a novice
administrator, should include suggestions and be a collaborative endeavor. This inclusive endeavor will be structured as a professional learning organization, which Senge (2012) suggested is the most effective way to introduce change.
Participants
To begin, I interviewed the three SBGR pilot teachers—two female and one male—at MWHS. They ranged in age from 30 to 40 years. In addition to these three, members of the English department decided during the 2015–2016 school year to
experiment with the effort by organizing their gradebooks and grade categories according to skills reflective of standards: reading, writing, speaking, and listening (see Appendix HH). The math department did the same. Their efforts can be found in Appendix NN.
I used purposeful sampling for this study. Patton (2006) stated that purposeful sampling allows the researcher to go in-depth and gain as much qualitative information as possible for a study. Consequently, purposeful sampling allowed me to observe and extract a vast amount of qualitative data from the SBG teachers. These participants also participated in ethnographic interviews. A total of seven adults participated in the interviews: two administrators and five teachers. All seven were White and ranged from 25 to 65 years of age, both male and female. Along with teachers, other participants included students, parents, and community members.
A total of five students participated in the interviews. The students were high school students, male and female, between the ages of 12 to 18. There were three White
27
stduents, one Latina student, one Black student, and one Asian student. Three parents— two community members and one board member—participated in the interviews. Pseudonyms were used for all participants.
Furthermore, approximately 20 teachers from MWHS, as well as 20 students and 50 parents, participated in surveys related to beliefs regarding grading practices.
Lastly, more than 50 parents attended an informational session on SBGR known as parent univeristy. There, one of the SBG pilot teachers shared their grading practices and the related benefits reaped by both students and teachers.
Data Collection Techniques
For this change plan, I collected six types of quantitative and qualitative data artifacts:
• Current and archival standardized test scores
• Grades and grading practices
• Survey data
• MWSD pre-survey results
• Ethnographic interviews
Quantitative Data
First, I collected grades and current/archival scores on the following standardized tests: the Northwest Evaluation Association/Measure of Academic Proficiency
(NWEA/MAP), Partnership for Assessment of Readiness for College and Careers (PARCC) and the American College of Testing (ACT). (See Appendix C.)
I was able to collect aforementioned data by accessing students’ records through the data management system Skyward. In order to gain access to Skyward and student
28
documents, one must log in to the system with a username and password. Only MWSD teachers and administrators have a preapproved username and password, which limits access to authorized personnel only.
Qualitative Data
As mentioned earlier, I surveyed students, parents, teachers, board members, local entrepreneurs, and extracurricular staff members. This was done using Google forms, an online survey creator. The survey asked questions about grading practices and was open for one week for all stakeholders: student, parents, teachers, administrators, and
community leaders. (See Appendix J.) Everyone was afforded the opportunity to complete the survey on their own after obtaining a consent form from my office. Also, the survey was sent via ParentLink, an online system with the capabiliy to send mass emails to all registered stakeholders. Almost all parents, teachers, and administrators in the district are registered to the program. The survey was also posted on the school’s Facebook page with a link to the survey, as well as a QR code symbol that when scanned with a smartphone reader would take the participant directly to the survey.
After the survey closed, Kyle Wock6 made a school announcement asking students and staff interested in continuing with the study to participate in a one-time interview. Five students, five teachers, four administrators, two board members, one local entrepreneur, and six parents accepted. The interviews were conducted after school for four weeks in my newly relocated and renovated work suite. Interviewees’ responses were recorded in a Google spreadsheet live during the interviews by me. I asked a series
29
of questions, which can be found in Appendix K. Each interviewee needed to turn in a signed consent form to participate.
Furthermore, I presented the pre-survey of teachers from the MWSD/LDT’s action plan. The survey asked a series of questions related to effective grading practices and procedures, which can be found in Section Five.
Lastly, I interviewed three SBG pilot teachers for approximately one hour. In that hour, we discussed a variety of topics: grading policies, differences in grading systems from the previous year to the year of the interview, gradebook setup, and student experiences (see Appendix K). These notes were arranged according to themes and shared during professional development sessions for parents. Also, after the interviews, I observed each of the teachers once during a predetermined time, in which teachers would share how they were implementing SBG and give feedback to students.
Data Analysis Techniques
The process of analyzing data with the intended users may be just as powerful as the outcomes themselves (Patton, 2008; Senge, 2012). This is why I fostered the
collaborative analysis of both the qualitative and quantitative data. Participatory action research emphasizes making data-driven decisions to improve schools (Bucknam, James, & Milenkiewicz, 2008; Senge, 2012). This research project was data-driven and
participative through the SBGRC. These two key elements should help create an educated culture willing to make all the changes necessary to improve the current situation.
30
Qualitative Data
On October 31, 2016, the LDT met to discuss the progress of MWSD’s action plan. The superintendent sent an email informing everyone of the date and purpose of meeting. During this meeting, the LDT analyzed the pre-survey, noted teachers’ beliefs on grading practices, and discussed professional development opportunities to develop the teachers’ and parents’ capacity. It was shared that the SBGRC should focus on parents and the LDT on teachers. However, no post-survey or SBG professional
development for teachers was developed by the time this study concluded. At the second meeting, the data from the surveys, interviews, and focus groups were shared.
I examined the survey data by creating frequency tables for each question. This permitted me to describe how responses to the surveys were distributed along different categories of questions. After this, I engaged in tabular analysis of the questions to describe potential relationships between various survey items (Patton, 2008). The key to this part was to prioritize essential question items and group categories based on the analysis I conducted. Lastly, I looked for relationships between certain answers and common characteristics of the participants.
I also analyzed the interviews using coding, or “labels put on data that summarize the data’s content or highlight a primary idea” (Bucknam et al., 2008, p.88). This was necessary to look for common, specific, and relatable themes or central statements. In addition, I transcribed the interviews live on a Google spreadsheet. After the data were transcribed, the SBGRC and I searched for themes using coding and interpreted the meaning of those statements. All of the data were stored in my personal laptop, which is password-protected.
31
Lastly, I analyzed the observation notes/tool that I created, which documented current teacher practices associated with SBG that were shared during the interviews, such as standards-based categories, specific feedback, repurposing homework, and allowing for redos/retakes.
Quantitative Data
In analyzing the quantitative data, I created a table with grade point averages (GPAs) and scores on four standardized tests. The table was created using Microsoft Excel, which permitted the data to be organized, filtered and sorted in a variety of ways. The committee and I looked to see how much, if at all, grades earned in the classroom corresponded to standardized test scores. Having high grades with poor standardized test scores (or the inverse) is a problem that needs to be solved to better prepare all students for colleges and careers of the 21st century.
32
SECTION FOUR: RELEVANT LITERATURE
In order to begin solving the challenges presented by the traditional letter grading system and exploring SBGR, I introduced a brief history of the traditional letter grading system and standards. I also examined a diverse set of literature from the United States and Canada dealing with the challenges of traditional letter grades in an era of clearly established, skills-focused targets, as well as state and national standards. Third, I examined a possible alternative to the traditional letter grading and reporting system known as standards-based grading and reporting. Fourth, I examined grading policies and procedures linked to discouraging the mastery of skills set forth by local and national standards. Fifth, I examined literature related to college freshmen needing remedial coursework. Through this review, I developed a conceptual framework to understand the critical problems inherent in the traditional grading system and their possible solutions through SBGR.
History of the Traditional Letter Grading System
Yale University can be considered the first educational institution to award “grades” in the late 1700s (Durm, 1993). Yale President Ezra Stiles presented the following classifications to 58 students who completed the final exam: Optimi (Optimum/Excellent), second Optimi (Great), Inferiores (Good) and Pejores (Worst) (Durm, 1993). However, the first traditional letter grade ever presented to a pupil in the United States was a B received by a Harvard College undergraduate in 1883 (Durm, 1993; Matthews, 2005; Vatterott, 2015). This letter grade represented one of five ways of classifying students in a system in which students with the lowest mark would fail the class (Vatterott, 2015). This grading system was fully developed, as we know it today, in
33
1897 at Mount Holyoke College in South Hadley, Massachusetts. Above 95% percent marekd an A, all the way down to an F for anything below 75% (Durm, 1993; Matthews, 2005; Vatterott, 2015).
For more than 100 years, schools in America have been evaluating student performance in subjects such as mathematics, English, reading, and science using this system of grades and point accumulation (National Education Association, 1979; Durm, 1993; Vatterott, 2015, Matthews, 2005). Almost anyone who attended school in the United States is familiar with it. Unfortunately, it has not changed much since its inception, and this lack of innovation has presented many challenges.
History of School Standards
Since the inception of compulsory education in the United States, the creation and implementation of educational objectives or standards has always been the responsibility of school districts and states (Reeves, 2002). In 1986, the Illinois State Board of
Education adopted the 34 State Goals, its first standards, which would be the
predecessors to the Illinois Learning Standards (ILS) of 2007 (ISBE, 2016). In June 2010, “established state education chiefs and governors in 48 states came together to develop the Common Core, a set of clear college and career-ready standards for kindergarten through 12th grade in English language arts/literacy and mathematics.”
Today, 42 states and the District of Columbia have voluntarily adopted and are working to implement those standards, which are designed to increase the likelihood that students graduating from high school are prepared to take credit-bearing introductory courses in two- or four-year college programs or enter the workforce (CCSS, 2016, p.1).
34
In Illinois, the CCSSs were formally adopted in 2010 with full implementation taking place in 2013–2014 (CCSS, 2016).
Standards are educational learning goals of what students should be able to demonstrate at each grade level (Guskey, 2015; Vaterrott, 2015; Schimmer, 2016). For example, a CCSS for English language arts (ELA) for 9th or 10th grade states that students should be able to “cite strong and thorough textual evidence to support analysis of what the text says explicitly, as well as inferences drawn from the text” (CCSS, 2016). Standards-based grading could help meet this goal, but many challenges would need to be overcome in the current traditional system before any new meaningful system could be put in place.
Challenges Associated with Traditional Grading Practices Challenge #1: Purpose of Grading and Reporting
Researchers have asked administrato