POSITIVE BEHAVIORAL INTERVENTIONS AND SUPPORTS (PBIS)
IMPLEMENTATION AND STUDENT PROBLEM BEHAVIORS: A
CORRELATIONAL ANALYSIS
by
Amy Henry
A dissertation submitted to the faculty of the University of Michigan – Flint in
partial fulfillment of the requirements for the degree of
Doctor of Education
Education Department
Dissertation Advisor: Dr. Tyrone Bynoe
Dissertation Committee Member: Dr. Eric Common
Dissertation Committee Member: Dr. Chad Waldron
University of Michigan – Flint
2018, December
i
COPYRIGHT BY
AMY HENRY
ii
I dedicate this dissertation to my late father, Donald Arwood. For as long as I can
remember, my dad told me I could do anything and be anything. When I told him I was going to be a teacher, his response was priceless: “Why would you want to be a teacher when you can be a doctor?!” He eventually learned that I could be both. While the colors of my tassels would have caused him GREAT distress (our family bleeds green), I know he would have been proud of me anyway. For my dad, I say, “Go green! Go white!”
iii
ACKNOWLEDGEMENT
Eleanor Roosevelt once said, “You gain strength, courage, and confidence by every experience in which you really stop to look fear in the face… You must do the thing you think you cannot do.” The journey to becoming Dr. Amy Henry is one that has been a dream in my heart since I was a small child. I did not know how I would get here. The road has not always been easy, but I have been blessed to have an amazing network of support.
First and foremost I want to thank God for giving me the strength, wisdom, and vision for completing this stage of my educational career. When times were tough, my faith and hope in Jesus kept me moving forward.
Second, I want to thank my family. To John, you are an amazing husband, father, and friend. Thank you for supporting me in every way - big and small. Although making me endless cups of coffee may have seemed like a small task, it was the fuel that kept me going! To Emma, Liliana, and Avery, you girls are the sweetest and sassiest cheerleaders a mom could ever ask for! Thank you for being patient with me when I was working or on calls. As promised, I am going to be a much better mom now! To my parents, thank you for always believing in me and for encouraging me to push forward. Your faith and support motivated me during times when I needed it the most. To my MUCH older sister, thanks for always supporting me and for acting like you were annoyed with me when I knew you were proud. To my brother-in-law, Ricardo, thank you for believing in me. I am so thankful to have you in my life. To my nephews, Alex and Rocco, thank you for the much needed visits and breaks from this work. I needed them all! I love you! To all of my extended family, aka “The Mafia”, thank you all for always loving me and believing in me. I am so blessed to have all of your support!
iv
journey. Rajah and Karri, thank you for being my support system as we navigated the EdD program. You two will forever be in my heart (even you, Rajah)! To all of my friends at MIBLSI, especially Anna Harms, Steve Goodman, Cheyne LeVessuer, Melissa Nantais, and Jennifer Rollenhagen, thank you for the countless hours you all spent supporting me and helping me learn and grow. Your influence on me both professionally and personally has been profound. I will forever be grateful to you all. To all of my friends at the Muskegon Area Intermediate School District, thank you for all you have done to support me and for putting up with me when this work interrupted meetings or caused me to have mental blocks. I could not ask for a better group of friends to work with and for. To my dear friend and colleague Jennifer Nelson, thank you for all that you did to support me – especially for reminding me of basic algebraic equations in the midst of complicated statistical analyses. I do not know how I would have done this without you! To Dr. Kathleen Lane, thank you for being my mentor and cheerleader along this journey. It all started in a minivan on a tour of Michigan… Thank you for the memories and the constant encouragement! Finally, to all of the staff at the University of Michigan – Flint,
especially my committee members Dr. Tyrone Bynoe, Dr. Eric Common, and Dr. Chad Waldron, thank you all for your support and instruction over these years. I came to this institution with a dream, and you all supported me in making that dream a reality.
v
ABSTRACT
The number of schools implementing Positive Behavior Interventions and Supports (PBIS) is continually rising with multiple policies focused on PBIS to address behavioral concerns in schools. Additional research is needed to analyze if PBIS is leading to desired local outcomes. This study analyzed the association between PBIS implementation and student problem behaviors. Data were collected from Michigan’s Integrated Behavior and Learning Support Initiative’s (MIBLSI) School Climate Transformation Grant (SCTG) participating schools. The first research question asked if there was a statistically significant association between PBIS implementation as measured by the Tiered Fidelity Inventory (TFI) Tier 1 percentage score and the rate of student problem behaviors as measured by office discipline referrals (ODR). Using the Pearson correlation coefficient, analyses revealed the association was not statistically significant. The second research question asked what the predictive validity of SWPBIS TFI Tier 1 percentage score and Tier 1 PBIS stage of implementation was on the rate of student problem behaviors. It was determined that the multiple regression analysis was not appropriate given a lack of linearity and homoscedasticity in the data set. Finally, the third research question asked if positive results could be generalized across demographic locales when Tier 1 PBIS is implemented with fidelity. Since findings for question one were not positive, this question was not addressed as planned. Results of this study indicate further research is needed to confirm the effectiveness of PBIS implementation on a reduction in ODRs and that the inclusion of additional variables would be beneficial to the analyses.
vi
TABLE OF CONTENTS
CHAPTER I. INTRODUCTIONA. Problem Statement and Research Questions……….……….. p. 2
B. Purpose of the Study.………..……. p. 5
C. Study’s Significance……… p. 5
D. Delimitations………..……….…………. p. 8
E. Key Definitions……… p. 8
CHAPTER II. LITERATURE REVIEW
A. Historic Review………... p. 18
1. Corporal punishment……….…... p. 19 2. Zero tolerance, suspension/expulsion, and dropout………... p. 21 3. Positive Behavioral Interventions and Supports………..………… p. 24
B. Thematic Review………. p. 28
1. Common elements for implementation of PBIS……….………. p. 29 2. Outcomes of implementation fidelity.………. p. 31 a. Decrease in problem behaviors and exclusionary consequences. p. 31 b. Increase in student attendance………... p. 35 c. Increase in academic achievement………... p. 36 3. Disproportionality and equity……….. p. 38
C. Methodological Review………...… p. 42
CHAPTER III. METHODOLOGY
A. Problem Statement and Research Questions………p. 46
B. Hypotheses……….………..… p. 49
1. Null hypotheses………….………... p. 49
2. Alternate hypotheses…….………...… p. 50
C. Research Design……….. p. 50
D. Research Techniques………...……….... p. 53 1. Descriptive statistical analyses……… p. 53
2. Research question one………. p. 53
3. Research question two………. p. 55
4. Research question three………..…. p. 59 E. Data Collection Sources and Techniques……….... p. 60
1. Sample…...………... p. 60
2. Measures...………... p. 63
F. Data Analysis Techniques……….………...… p. 68
1. Research question one………. p. 68
2. Research question two………. p. 69
3. Research question three………..…. p. 60
vii
A. ODR Descriptive Statistics.……….… p. 77 B. TFI Descriptive Statistics……….… p. 85 C. Research Question 1 Findings and Analysis.……….………..… p. 92 D. Research Question 2 Findings and Analysis.……….………..… p. 95 E. Research Question 3 Findings and Analysis..…...……….………..… p. 98 CHAPTER V. CONCLUSION
A. Discussion…………...……….……… p. 108
B. Limitations………....……….………..… p. 112
C. Recommendations for Future Research.…...……….………..… p. 116
References……….. p. 120 Appendices
Appendix A: Institutional Review Board Approval Letter……… p. 135 Appendix B: MIBLSI Research Partnership Application…...………...…… p. 136 Appendix C: Study’s Data set……….………...…… p. 140 Appendix D: First Data set from MIBLSI..………….………...… p. 142 Appendix E: PPSC School Stages of Implementation Indicators..……..…………. p. 158 Appendix F: Figure 9.1 – Statistical Test Selection.………..……..…………. p. 162 Appendix G: SWIS Data Summary Reports for 2016-2017 and 2017-2018……….p. 163 Appendix H: MIBLSI Database Acceptable Use Agreement………...………. p. 165
viii Table
1.1 Locale Definitions………..………..……….…. p. 15
3.1 Correlational Design Study Table………..………….………... p. 54
3.2 SPSS Correlation Output File……… p. 55
3.3 Stages of Implementation………..………... p. 56 3.4 Multiple Regression Data Table……….………... p. 57 3.5 SPSS Multiple Regression Model Summary Output File………..……... p. 59 3.6 SPSS Multiple regression Coefficients Output File………... p. 59
3.7 ANOVA Data Table……….. p. 60
3.8 Correlational Design Study Table……….. p. 71
3.9 SPSS Correlation Output File……… p. 72
3.10 Methodology Table……….... p. 73 4.1 2016-2017 ODR Descriptive Data………. p. 78 4.2 2017-2018 ODR Descriptive Data………. p. 80 4.3 2016-2017 Tier 1 TFI Descriptive Data………. p. 86 4.4 2017-2018 Tier 1 TFI Descriptive Data………. p. 87 4.5 SCTG TFI and ODR Correlation Matrix………... p. 93 4.6 Locale TFI and ODR Correlation Matrix………..… p. 99 4.7 2016-2017 Locale ODR One-Sample Test……….... p. 100
ix
LIST OF FIGURES
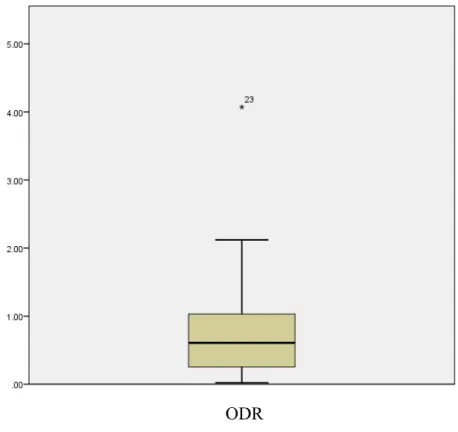
Figure2.1 Four Elements of School-Wide Positive Behavior Support ……...……….…. p. 27 4.1 Boxplot of 2016-2017 SCTG ODRs………..………….………... p. 81 4.2 Boxplot of 2017-2018 SCTG ODRs………..………….………... p. 82 4.3 Histogram of 2016-2017 SCTG ODRs…………..………….………... p. 83 4.4 Histogram of 2017-2018 SCTG ODRs…………..………….………... p. 84 4.5 Boxplot of 2016-2017 SCTG Tier 1 TFI….……..………….………... p. 88 4.6 Boxplot of 2017-2018 SCTG Tier 1 TFI….……..………….………... p. 89 4.7 Histogram of 2016-2017 SCTG Tier 1 TFI….……..……….………... p. 90 4.8 Histogram of 2017-2018 SCTG Tier 1 TFI….……..……….………... p. 91 4.9 2016-2017 SCTG TFI and ODR Correlation Scatterplot……….. p. 94 4.10 2017-2018 SCTG TFI and ODR Correlation Scatterplot……….. p. 95 4.11 2016-2017 SCTG TFI and ODR Correlation Scatterplot……….. p. 97 4.12 2017-2018 SCTG TFI and ODR Correlation Scatterplot……….. p. 97 4.13 2016-2017 Suburb TFI and ODR Correlation Scatterplot…………..……….. p. 101 4.14 2017-2018 Suburb TFI and ODR Correlation Scatterplot…………..……….. p. 102 4.15 2016-2017 Town TFI and ODR Correlation Scatterplot………...…..……….. p. 103 4.16 2017-2018 Town TFI and ODR Correlation Scatterplot…………...……….. p. 104 4.17 2016-2017 Rural TFI and ODR Correlation Scatterplot…………..………..p. 105 4.18 2017-2018 Rural TFI and ODR Correlation Scatterplot……….…...………..p. 106
INTRODUCTION
Positive Behavioral Interventions and Supports (PBIS) is a framework for addressing the non-academic needs of students in schools. These non-academic needs include the behavioral, social, emotional, and health aspects of a student’s wellbeing (George, Kincaid, & Pollard-Sage, 2011; Horner & Sugai, 2015; Mathews, McIntosh, Frank, & May, 2014; Sugai & Horner, 2002, Sugai & Simonsen, 2012). The supports provided to students within this multi-tiered framework are commonly broken into three tiers. Tier 1 is commonly defined as the universal tier with supports and structures accessed by all students in the system. Tier 2 is commonly defined as a strategic or targeted level of support that is provided to some students who require more customized supports than the universal or Tier 1 supports in order to be successful. Tier 3 is commonly defined as an intensive and highly individualized level of supports which are provided to a few students who need customized supports in order to be successful. For
educators, the installation of a PBIS framework within the school system is crucial to supporting successful social and academic student outcomes. Specifically, Tier 1 supports are of critical importance as they establish a safe and efficient environment allowing for effective teaching and learning to take place (George et al., 2011).
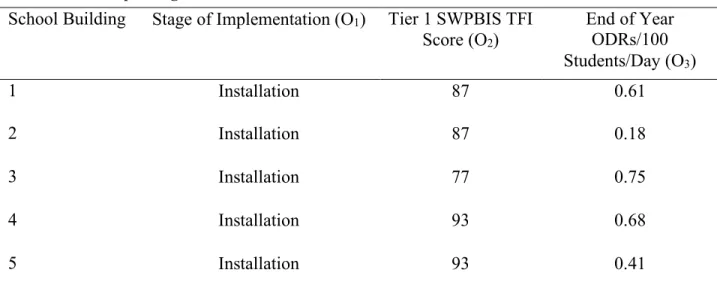
This correlational study sought to determine if PBIS implementation was associated with decreased levels of student problem behaviors. The study examined the predictive validity of two independent variables on the dependent variable of student problem behaviors measured by office discipline referrals (ODRs) at the end of the year per 100 students, per day using data from Michigan’s Integrated Behavior and Learning Supports Initiative’s (MIBLSI) School Climate Transformation Grant (SCTG) participating schools. The two independent variables related to
PBIS implementation were the School-Wide PBIS Tiered Fidelity Inventory (SWPBIS TFI) Tier 1 percentage score and the school’s stage of implementation as determined by MIBLSI stage of implementation indicators for their SCTG participating schools (see Appendix E). If statistically significant associations were reported from the correlational study, an additional analysis would have been conducted to determine the external generalizability of the results across schools grouped by locale: city, suburb, town, and rural. The unit of analysis of this study was at the school level. The study focused on schools within the state of Michigan who were a part of the SCTG cohort and were entering data into MIBLSI’s data warehouse, MIDATA. Given the backdrop concerning the intended study, this introduction chapter has included the following sections: a) problem statement and research questions, b) purpose of the study, c) significance of the study, e) study’s delimitations, and f) key definitions.
Problem Statement and Research Questions
Like many other states across the nation, Michigan has funded efforts to support schools in PBIS (Dunlap, Goodman, McEvoy, & Paris, 2010). In support of PBIS implementation at the local and regional level, Michigan’s Department of Education chose to invest both state and federal funding into MIBLSI for over a decade. MIBLSI is an Individuals with Disabilities Education Act (IDEA) grant funded initiative through the Michigan Department of Education’s Office of Special Education (MIBLSI, n.d.). While MIBLIS has multiple streams of funding supporting their work in Michigan, a majority of their funding is IDEA related. This initiative supports local education agencies, both intermediate school districts and local school districts, in implementing multi-tiered systems of support for reading and behavior. Districts and schools across the state of Michigan are interested in finding an effective and efficient manner to address
the multiple needs of all students by supporting their social, emotional, and behavioral development in a systematic way. PBIS offers district and school leaders a multi-tiered
behavioral supports model to promote students’ social, emotional, and behavioral competencies. Through the work of the MIBLSI project, schools and districts have been utilizing a fidelity measure that was recently developed to assess PBIS implementation. This tool is the SWPBIS TFI, and it measures the level to which PBIS is being implemented with fidelity at the school system level. Fidelity of implementation is defined as the degree to which a program,
intervention, or practice is put into place as it was originally designed (Lane &
Beebe-Frankenberger, 2004). With the use of TFI data across the SCTG participating schools, MIBLSI is able to show the impact that their supports have on the level of implementation of PBIS in schools and districts. In addition, all schools working with MIBLSI are using the School-Wide Information System (SWIS) database to track student outcome data in the form of office discipline referrals (ODRs). Since PBIS is a crucial area of focus for districts and schools looking to support the non-academic needs of students, it is imperative that the effects of PBIS implementation, including the effects of data-based decision making, are analyzed to inform educational leaders about the benefits these efforts will have on student outcomes.
PBIS is a commonly implemented educational framework in schools with over 25,000 currently implementing (OSEP, 2018). PBIS is often found in literature and legislation around general and special education as it is a system to support all students. While the research
conducted around PBIS includes effectiveness of PBIS at decreasing problem behaviors, there is a need for additional studies around the association between the threshold of fidelity and a decrease in student problem behaviors. Given that implementation occurs in stages, there is a
need for studies addressing the predictive validity of implementation fidelity and stage of implementation on the rate of student problem behaviors. There is also a need for research around the generalizability of expected outcomes across schools grouped by locale (city, suburb, town, and rural), as this information will support educators in each of these locales to justify supporting PBIS overtime in their unique context. In an effort to provide local superintendents in the state of Michigan with a compelling reason to continue supporting PBIS after local, state, and federal grants have ended, a quantitative analysis of a correlational design was conducted to determine the predictive validity of Tier 1 PBIS implementation fidelity to student outcomes. Analysis was conducted based on stage of implementation as well as fidelity assessment scores to demonstrate the effectiveness of PBIS at supporting schools in decreasing student problem behaviors. With the need to further support research around the effectiveness of PBIS at addressing student behaviors, the following research questions were considered in this study:
1. Is there a statistically significant association between School-Wide PBIS Tiered Fidelity Inventory Tier 1 percentage score and the rate of student problem behaviors as measured by office discipline referrals reported in SWIS?
2. What is the predictive validity of School-Wide PBIS Tiered Fidelity Inventory Tier 1 percentage score and Tier 1 PBIS stage of implementation on the rate of student problem behaviors as measured by office discipline referrals reported in SWIS? 3. Given a positive finding in question one, is there external
generalizability across demographic locales (city, suburb, town, and rural) after controlling for stage of implementation when Tier 1 of PBIS is implemented with fidelity as measured by the School-Wide PBIS Tiered Fidelity Inventory?
This study pursued answers to these research questions based on an analysis of TFI data, school stage of implementation, school demographic data, and student outcome data.
Purpose of the Study
This study could be used to inform the educational community of outcomes expected from implementing Tier 1 of PBIS with fidelity. This study’s aim was to provide additional support examining PBIS fidelity and student outcomes and offer additional evidence around the 70% fidelity threshold found in the study conducted by Mercer, McIntosh, and Hoselton (2017). However, this study has demonstrated similar outcomes to other studies around the effects of PBIS implementation on the rate of office discipline referrals, thus making this a replication of previous research (Childs et al., 2015; Gage et al., 2018). Additionally, districts and schools are looking to find a framework to address students’ non-academic needs that is matched to their specific context. Implementation of PBIS includes establishing leadership teams who will examine fidelity data along with other data (e.g., student outcome, demographic, capacity, etc.) to ensure the best supports are being provided to their students. Through an analysis of results across school demographics, this study aimed to provide districts with information regarding the level of variability in outcomes when Tier 1 is implemented with fidelity within specific locales. This study could also be used to provide information to political leaders affecting policies and funding for districts and schools around non-academic needs.
Study’s Significance
Research has demonstrated numerous times that supporting students’ non-academic skills, such as behavior, social, emotional, and health, supports their academic achievement (Bradshaw, Mitchell, & Leaf, 2010; Horner et al., 2009; Luiselli, Putnam, Handler, & Feinberg; 2005; Muscott, Mann, & LeBrun, 2008; Najaka, Gottfredson, & Wilson, 2002). For this reason, Michigan has supported ongoing efforts to establish effective multi-tiered behavioral frameworks
within each district and school building across the state (MIBLSI, n.d.; Michigan Department of Education, 2017; Michigan State Board of Education, 2006; Revised School Code, 2017). The MIBLSI project has applied for and received multiple grants (state and federal) over the years, including the SCTG. These opportunities have allowed MIBLSI to increase staff and supports for local districts and schools. Even though MIBLSI has targeted strengthening the supports
provided to partnering local education agencies (LEA), implementation has not yet reached fidelity and has not been sustained in some areas. Given that this is an area of high importance across the educational community and specifically in the state of Michigan (Every Student Succeeds Act, 2015; MIBLSI, n.d.; Michigan Department of Education, 2017; Michigan State Board of Education, 2006; Revised School Code, 2017), research was conducted to determine if there was a statistically significant association between Tier 1 PBIS implementation and
decreased student problem behaviors. If statistically significant results were found with the correlational study, an additional analysis of variability was intended to be conducted to determine if there was variability in these results across the school locales (e.g., city, suburb, town, and rural). These results could potentially be helpful to the field of education as a whole in assisting schools and districts with PBIS implementation, sustaining these efforts over time, making data-based decisions, and lobbying for resources to support this work based upon the school’s unique context and needs. The results of this study could justify the need for PBIS supports to be sustained overtime in order for positive outcomes to be fully realized. With this information, schools and districts are encouraged to support ongoing, sustained efforts to scale up implementation of PBIS within their organizations.
In addition, the process of implementing and sustaining a PBIS framework is closely connected to multiple professional standards for educational leaders. When looking at the Professional Standards for Educational Leaders from the National Policy Board for Educational Administration (2015), two of these standards align closely with the study’s purpose and
significance. Standard three states, “Effective educational leaders strive for equity of educational opportunity and culturally responsive practices to promote each student’s academic success and well-being” (p. 9). This standard further delineates how educational leaders do this in saying that the leader will promote practices that support the academic and social needs of individual
students. This standard also states that educational leaders will address matters of equity and cultural responsiveness in their buildings. This is exactly the type of practice that PBIS supports leaders in doing. PBIS requires that leaders not only establish a foundation of trust and a positive climate and culture in their buildings, but it also requires that leaders stay attune to the diverse needs of the students on an individual basis. Tools such as SWIS allow leaders to drill down into their information to discover issues of bias and disproportionality in discipline issues. Once these issues are recognized, leaders in a PBIS system take steps to reduce or eliminate the barriers to positive success that their students and staff might be facing.
Standard five also aligns well with the goals of implementing a PBIS framework.
Standard five states, “Effective educational leaders cultivate an inclusive, caring, and supportive school community that promotes the academic success and well-being of each student” (p. 10). This standard explains that educational leaders not only ensure that the students are successful in academics, but the leader makes sure that the students have a safe, caring, and healthy learning environment and that the social, emotional, and physical needs of each student are met. This is
done by providing a system of academic and social supports to meet the range of needs present in the building. The most significant sub-point in this standard that aligns perfectly to PBIS states that the leader cultivates an environment that reinforces positive student conduct. Not only does PBIS establish routines and expectations around behavior in the school, it also establishes a systematic way of reinforcing positive behavior and supporting students who might be struggling with social, emotional, or physical needs that are creating barriers to their success. Through the implementation of a PBIS framework, educational leaders are meeting the expectation of this standard.
Delimitations
To validate the study and make it manageable and feasible, delimitations were
established. The researcher established validating criteria for all data collected. The researcher worked with MIBLSI staff to access data. MIBLSI staff pulled data from the MIBLSI data warehouse, MIDATA, related to Tier 1 PBIS implementation, stage of implementation, the rate of student problem behaviors, and school demographic information related to school locale for their SCTG participating schools. The data stored in this warehouse was entered by school and district personnel and was monitored by the MIBLSI liaison supporting their implementation efforts. All data were reported from the use of the same fidelity tool (TFI) and the same student behavior database (SWIS). The use of the TFI and SWIS ODR information further validated the study in that these tools have been researched and vetted on a national level.
Key Definitions
To comprehend fully the aspects of this study, it is imperative that certain terms and practices are clearly defined. One of the major understandings that needs to be established is a
clear definition of PBIS. According to the Handbook of Positive Behavior Support, PBIS is defined as “an approach designed to improve the adoption, accurate implementation, and sustained use of evidence-based practices related to behavior and classroom management and school discipline systems” (Sugai & Horner, 2011, p. 309). The definition also states that PBIS is not a packaged curriculum but a preventative framework for schools to organize evidence-based practices designed to improve student outcomes, improve their implementation of evidence-based practices designed to improve student outcomes, and maximize academic and social outcomes for all students. The student outcomes that are realized are both behavioral and
academic in nature. As students are able to exhibit socially acceptable behaviors, they are able to participate more in academic opportunities, thereby increasing their academic outcomes as well (Luiselli, Putnam, Handler, & Feinberg, 2005; Muscott, Mann, & LeBrun, 2008; Najaka,
Gottfredson, & Wilson, 2002). In short, PBIS is a framework that cannot be purchased or simply adopted; it needs to be built within the school system. PBIS is often interchanged with terms like multi-tiered or tiered behavioral framework, school-wide positive behavioral (intervention) supports, and positive behavioral supports (OSEP, 2018).
With PBIS being a multi-tiered framework, a solid understanding of the PBIS tiers is essential to empower educators and clarify terminology used in this study. George et al. (2011) define Tier 1 as a universal, primary prevention system established to support all students in all settings. They state that Tier 1 has the potential to prevent problem behaviors and even reduce the amount of risk for students in the system. They identify seven practice components of a Tier 1 PBIS system: a) a committed leadership team; b) a system to support data-based decision-making; c) procedures for responding to problem behaviors; d) behavior expectations that are
positively stated; e) procedures for encouraging students to meet behavior expectations; f) lesson plans for teaching behavior expectations; and g) a plan for monitoring and evaluating
implementation efforts (George et al., 2011, p. 384). Given that the goal of PBIS is to prevent problem behaviors and support students in their academic and non-academic outcomes, Tier 1 is foundational to the success of this work. While all students receive the support of Tier 1, it is considered effective only when it is meeting the needs of around 80%-90% of the students in a school (George et al., 2011). However, some students will need additional supports. Tier 2 and Tier 3 provide these additional supports to students who need more than what is established in Tier 1. Tier 2 is defined as a secondary level of prevention that is designed to reduce the number of cases of student problem behaviors. Tier 2 interventions are often referred to as “selected” or “targeted”. This tier is meant to address the needs of student(s) or groups of students who need targeted supports to be successful. Tier 2 serves approximately 10-15% of the student population who are at risk of developing severe problem behaviors (Hawken, Adolphson, MacLeod, & Schumann, 2011). Tier 3 is defined as a tertiary level of support that is designed to address the specific conditions associated with individual problem behaviors. This tier is considered an intensive, individualized level of support that is often characterized as data driven and team based. This tier of supports typically serves around 5% or fewer of the students in the school (Sugai & Horner, 2011). In addition, Tiers 2 and 3 should be considered additive in nature. While PBIS is comprised of all three tiers, this study focused on implementation fidelity and student outcomes based on Tier 1 supports only.
Another key aspect of this study is implementation science. According to Ogden and Fixsen (2007), “implementation is defined as a specified set of activities designed to put into
practice an activity or program of known dimension” (p. 4). The formula for implementation’s success requires effective innovations combined with effective implementation within an enabling context. The combination of these three elements creates a high likelihood of socially significant outcomes. Additionally, Ogden and Fixsen (2007) define three implementation drivers and four implementation stages. The implementation drivers are leadership, organization, and competency. Leadership drivers are conceptualized as both technical (e.g., time, funding) and adaptive (e.g., motivation, clinical inertia). Organizational drivers are systems intervention (e.g., managerial support), facilitative administration (e.g., immediate appointment, time, caseload), and decision support data system. Competency drivers are selection (e.g., staff
attitudes, receptivity to training, not part of role), training (e.g., intervention training, knowledge, belief in usefulness), and coaching (e.g., support after training, comfort with topic, rapport with client/stakeholder). The four stages of implementation are exploration, installation, initial implementation, and full implementation. Exploration is the stage in which organizations research innovations that would help them reach their goals. They also assess their readiness to implement successfully. In the installation stage, organizations gather all resources needed, select staff for training and coaching, and select assessments that will be used to measure the
effectiveness of the innovation. During initial implementation, organizations begin
implementation of the innovation within the appropriate context. It is often within this stage that organizations identify areas needing to be tweaked or system structures that need to be put in place in order for the innovation to be successful. Many organizations will often find that there is a need to go back and set up structures or gather resources that were missed during the
forward as proper installation is crucial to the organization reaching the final stage of full
implementation. It is also found within the research that this stage is only successful if there is an implementation team designated to support and monitor implementation efforts. Without such a team, research has shown that the organization will only be about 14% implemented after seventeen years of working at it (Ogden & Fixsen, 2014). The final stage is full implementation. In this stage, organizations must reach 50% of their staff implementing with fidelity and showing intended outcomes. At this point, some organizations are able to expand the innovation to new contexts in order to replicate their success. Time is a key factor in implementation as well. Fixsen, Naoom, Blasé, Friedman, and Wallace (2005) found that little research has been done around the impact of time on realizing positive outcomes when evidence-based practices are implemented. They state that extensive planning efforts must be made to conduct research around the significance time plays on reaching implementation goals.
A deep understanding and clear definitions of fidelity and sustainability are crucial to PBIS implementation. According to the Montana Office of Public Instruction, fidelity is the degree or extent to which a program is implemented as planned and is defined as “the accurate and consistent application of an agreed upon procedure” (Montana Office of Public Instruction, 2016). Lane and Beebe-Frankeberger (2004) reiterate this definition in stating fidelity is “the degree to which the intervention plan was put into place as originally designed” (p. 128). This study defined fidelity as the implementation of PBIS in its intended form, including all critical features. This study measured fidelity using the TFI, which specifies the critical features as teams, implementation, and evaluation. This tool allows PBIS leadership teams to assess their level of implementation and to determine if they are implementing with fidelity (Algozzine et al.,
2014). Finally, McIntosh, Horner, and Sugai (2009) state that sustainability is defined as the durable implementation of a practice at a level that continues to produce valued outcomes. When it comes to PBIS outcomes, implementation fidelity is a direct reflection of the adult actions in the school and is one of the most critical outcomes to measure (Bradshaw, Pas, Debnam, & Lindstrom Johnson, 2015). This means that sustainability is defined not only as a continuation of positive outcomes in terms of student success, but it is also defined by high levels of
implementation fidelity. Research suggests that PBIS implementation fidelity is reached when schools receive a score of 70% on fidelity assessments and maintain this score over time (Algozzine et al., 2014). For purposes of this study, a 70% score on the TFI was considered implementing with fidelity. In addition, this study sought to confirm that a score of 70% fidelity is a threshold for outcomes as was determined by a study conducted by Mercer, McIntosh, and Hoselton (2017). Their study found significant outcomes were not realized or correlated to implementation fidelity of the core features of PBIS on multiple fidelity tools when the school reported a score of less than 70%. Only when a school reached the 70% threshold did the data indicate that there were consistent, statistically significant positive student outcomes.
This study also sought to explore the generalizability of issues around equity and
disproportionality in discipline through the analysis of positive outcomes across the demographic locales of city, suburb, town, and rural. According to McRoy, Fong, and Dettlaff (2014),
disproportionality is defined as the ratio between the percentage of people in a specific racial or ethnic group being negatively over-identified in comparison to their percentage of the overall population. Research has shown that disciplinary practices in schools have been inequitable and have over identified students in minority populations (e.g. special education, African American,
etc.), which punishes these groups disproportionately (Fenning & Rose, 2007; Girvan, Gion, McIntosh, & Smolkowski, 2017; McIntosh, Nese, & Horner, 2016; Skiba et al., 2002;
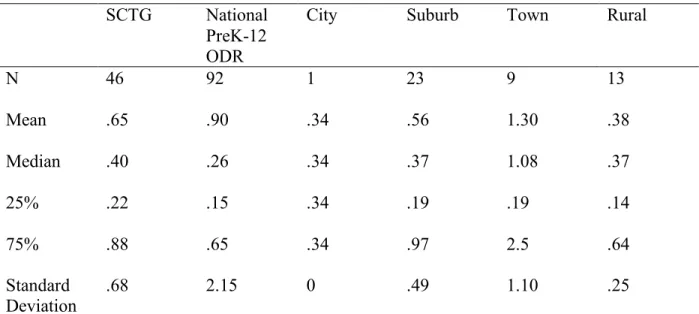
Smolkowski, Girvan, McIntosh, Nese, & Horner, 2016). However, emerging research has shown implementation of PBIS can reduce disproportionality and increase equity in student discipline (Bal, Kozleski, Schrader, Rodriguez, & Pelton, 2014; McIntosh, Girvan, Horner, Smolkowski, & Sugai, 2014). In an effort to begin preliminary analysis around the generalizability of PBIS effects on equity and disproportionality, an analysis of variance was planned to be conducted around groups of schools based on their demographic labels (locales) as determined by Michigan’s Department of Education. Michigan’s Center for Education Performance and Information or CEPI identifies schools as one of four main categories: city, suburb, town, or rural (CEPI, 2016). Each of these four categories is broken into the three subcategories; however, this study focused on the four main categories. (Subcategories are defined in Table 1.1.) A city is defined as a “territory inside an urbanized area and inside a principal city” with a population ranging between less than 100,000 to more than 250,000 (CEPI, 2016, p. 21). A suburb is defined as a “territory outside a principal city and inside an urbanized area” with a population ranging between less than 100,000 to more than 250,000 (CEPI, 2016, p. 21). A town is defined as a “territory inside an urban cluster” and outside of an urbanized area (CEPI, 2016, p. 21). A rural area is defined as a “census-defined rural territory” that is outside of an urbanized area and outside of an urban cluster (CEPI, 2016, p. 21). Michigan came to these definitions through the use of data from the United States Census Bureau. The United States Census Bureau classifies locales as either urban or rural. According to Ratcliffe, Burd, Holder, and Fields (2016), urban locales are broken into two categories: urban areas and urban clusters. These categories are
defined based on population density as well as other determining factors. Urban areas are those with 50,000 or more people with a density of 1,000 people per square mile. They also use a calculation to account for residential and non-residential land use that could allow a locale to be identified as urban with only 500 people per square mile. An urban cluster is an area with at least 2,500 people but less than 50,000 people. An urban cluster must also have at least 1,000 people per square mile or 500 people with the adjusted calculation for residential and non-residential land use. Rural is then defined as “all population, housing, and territory not included within an urbanized area or urban cluster” (Ratcliffe et al., 2016, p. 3). When analyzing the outcomes of schools across Michigan, definitions set by the Michigan Department of Education were planned to be used to determine if positive effects of PBIS implementation could be realized in any school regardless of their locale.
Table 1.1: Locale Definitions
Locale Subcategory Definition
City Large Territory inside an urbanized area and inside a principal city with (a) population of 250,000 or more
Midsize Territory inside an urbanized area and inside a principal city with (a) population of less than 250,000 and greater than or equal to 100,000
Small Territory inside an urbanized area and inside a principal city with (a) population of less than 100,000
Suburb Large Territory outside a principal city and inside an urbanized area with (a) population of 250,000 or more
Midsize Territory outside a principal city and inside an urbanized area with (a) population less than 250,000 and greater than or equal to 100,000
Small Territory outside a principal city and inside an urbanized area with (a) population less than 100,000
Town Fringe Territory inside an urban cluster that is less than or equal to ten miles from an urbanized area
Distant Territory inside an urban cluster that is more than ten miles and less than or equal to thirty-five miles from an urbanized area
Remote Territory inside an urban cluster that is more than thirty-five miles from an urbanized area
Rural Fringe Census-defined rural territory that is less than or equal to five miles from an urbanized area, as well as rural territory that is less than or equal to two-and-a-half miles from an urban cluster
Distant Census-defined rural territory that is more than five miles but less than or equal to twenty-five miles from an urbanized area, as well as rural territory that is more than two-and-a-half miles but less than or equal to ten miles from an urban cluster
Remote Census-defined rural territory that is more than twenty-five miles from an urbanized area and is also more than ten miles from an urban cluster
Note: CEPI (2016, p. 21-22)
Finally, this study partnered with MIBLSI to access TFI, ODR, PBIS stage of
implementation, and demographic data for SCTG participating schools across Michigan. It is important to understand that schools and districts partnering with MIBLSI receive support through an intentionally designed scope and sequence of training, coaching, and technical assistance. With the launch of their first project and cohort of schools seeking support in 2004, MBLSI began offering training, coaching, and technical assistance to schools who were interested in looking at both PBIS and reading strategies to deploy systematically throughout their schools. From 2004-2013, MIBLSI supported seven cohorts of schools with this model. In 2011, they moved to a regional-based model to support capacity development in regional service agencies in the areas of behavior and reading. In 2016, MIBLSI moved to a district model, which allowed them to support districts directly in building multi-tiered systems of support for behavior and reading. In addition to their integrated academic and behavior model, MIBLSI also holds various federal grants that allow them to focus their supports on specific work. One of these grants is the SCTG, which was awarded to the Michigan Department of Education (MDE) in
2014. This grant focuses on supporting PBIS implementation at the district and school level. Direct supports to districts and schools began in 2015, with initial data collection beginning in the 2016-2017 school year. Given that this grant project is focused only on PBIS implementation and that there was a need to justify continued funding from the United States Department of Education, this study only used data from the SCTG participating schools. Data were collected for both the 2016-2017 and 2017-2018 school years.
Chapter Summary
This chapter has introduced the proposed correlational study around the association between Tier 1 PBIS implementation fidelity and decreased student problem behaviors. The original intent of this study was to conduct a study of predictive validity that was a progression of analyses leading to a multiple regression including analysis of stage of implementation in relation to student outcomes. Being that stage of implementation has not been analyzed by the institution housing the study’s data set, this study was targeted to be a unique contribution to the field. Additionally, if statistical significance would have been found in the correlational analysis related to the first question, an analysis of variance around subgroups of schools would have allowed the results of this study to determine external generalizability. Background information around the purpose and significance of the study was reviewed. This chapter also provided connections to educational leadership as well as delimitations of the study. Key terms were defined in order to establish a clear understanding of the components of the study.
CHAPTER TWO LITERATURE REVIEW
This literature review will analyze and synthesize the history, themes, and methodologies of multiple sources and studies around the implementation of Positive Behavioral Interventions and Supports (PBIS), which can also be referred to as School-Wide Positive Behavioral
Interventions and Supports (SWPBIS). One of the chapter’s purposes is to help the reader
understand the context leading to PBIS as a fundamental framework to support students. Another purpose is to identify common elements that support sustained implementation of PBIS practices as well as expected outcomes when fidelity is reached. The final purpose of this chapter is to validate this study’s selected methodology. The first section of the review will provide the reader with the historical background and development of PBIS as a critical framework for districts and schools to address students’ non-academic needs. The second section will synthesize literature and identify common themes, findings, and gaps that support the proposed research problem and research questions. The third section of this chapter reviews methodologies used by researchers to determine the association and predictive validity of independent variables on dependent variables.
Historical Review
Since as early as 1642 when the Massachusetts Bay Colony began offering Puritan education so that children could learn to read the Bible (Campbell, 2015), teachers have faced the challenge of addressing student problem behaviors. Multiple methods for addressing these challenges have been utilized with varying results. There has also been a tremendous amount of controversy over their effectiveness to shape student behaviors as well as to inflict unintended
negative consequences on students. Given that people and systems evolve over time, a historical perspective and understanding of how student behaviors have been addressed in districts and schools as well as the effects of the various methods are critical for understanding why the shift has been made to a PBIS framework.
Corporal punishment. As the educational system began developing in the United States, most schools focused on religious studies rather than on subjects taught today, such as reading, math, or science. The intent was to teach children the basic Christian values around family, religion, and community (Campbell, 2015). The foundation of religion in schools led educators to take a biblical approach to addressing student behaviors and discipline. One scripture that was taken from the Bible and was used to justify the method of punishment for behavioral missteps was Proverbs 13:24, which states, “He who spares his rod hates his son, but he who loves him disciplines him promptly” (New King James Version; Dukes, 2009). While this is only one biblical scripture relating to disciplining children and could be interpreted in numerous ways, Campbell (2015) uses this as an example of how educators justified corporal punishment in the earliest establishments of public education. From this early beginning, districts, schools, and educators began using corporal punishment as a way to make students conform to school rules and behave in a manner that district and school officials deemed appropriate.
Corporal punishment in schools is defined by the American Academy of Child and Adolescent Psychiatry as “a discipline method in which a supervising adult deliberately inflicts pain upon a child in response to a child's unacceptable behavior and/or inappropriate language” (American Academy of Child and Adolescent Psychiatry, 1998). One of the most common forms of corporal punishment utilized in schools was paddling. When students misbehaved, teachers
would have them bend over so that they could paddle their buttocks. Other common forms of corporal punishment in schools included hitting, spanking, and slapping. Some reports have indicated the use of objects other than paddles to inflict pain on students, including shoes, belts, rulers, hammers, and metal pipes. Some children have even been choked, pinched, and dragged by their hair in an effort to shape their behaviors (Gershoff, Purtell, & Holas, 2015). The effects of corporal punishment are not limited to the physical pain and injury imposed upon a student. Rollins (2012) found corporal punishment may adversely affect a student’s self-image and academic achievement. Additionally, Rollins found punishment can lead to disruptive and violent behaviors and can severely alter social skills development. Corporal punishment has other negative unintended consequences such as providing a model of aggression for students to follow, teaching that physical responses are acceptable, decreasing attendance rates, reducing opportunities for academic learning, and creating aversions to those delivering the punishments (Dukes, 2009).
While many states recognized the harmful effects of corporal punishment and made the use of it illegal in schools, a report in USA Today in July of 2017 stated that fifteen states in the United States continue to allow this form of discipline in schools (Alvarado, 2017). These states include Florida, Georgia, North Carolina, South Carolina, Tennessee, Alabama, Mississippi, Louisiana, Texas, Oklahoma, Arkansas, Missouri, South Dakota, Wyoming, and Arizona. Even though the Eighth Amendment protects prisoners from corporal punishment, the U.S. Supreme Court ruled in 1977 that this same protection did not apply to students in schools (Ingraham v. Wright, 1977). Additionally, animals are a protected subgroup from corporal punishment. The only subgroup of people in the United States who are not protected from corporal punishment are
children (Gershoff, Purtell, & Holas, 2015). Many states have legally banned its use as a form of discipline in districts and schools as they are more increasingly aware of the detrimental and counterproductive effects of corporal punishment on children.
Zero tolerance, suspension/expulsion, and dropout. While the use of corporal
punishment was diminishing across the nation, schools and districts were continuing to deal with increasing student problem behaviors. In the early 1990s, zero tolerance policies began
infiltrating districts and schools in response to increasing violence among youths (Shah, 2013). For example, a school district in San Diego institute a zero tolerance policy after two students were shot and killed. Their policy allowed them to expel any student who brought a weapon to school in an effort to protect the masses (Vail, 1995). With mass shootings happening in school across the nation, there was a need for quick intervention on behalf of the safety of all students (Astor et al., 1997; Borum et al, 2010). The introduction of zero tolerance policies allowed school administrators to expel a student for a full year if they brought a weapon to school. However, this policy did not limit the use of expulsion to students bringing weapons to school, and many school administrators widened their local expulsion policies to include other behaviors as well (Evans & Lester, 2012). The American Psychological Association Zero Tolerance Task Force eventually defined zero tolerance as “a philosophy or policy that mandates the application of predetermined consequences, most often severe and punitive in nature, that are intended to be applied regardless of the gravity of behavior, mitigating circumstances, or situational context” (American Psychological Association, 2008, p. 852). In many cases, the predetermined
consequences students face for their misbehavior were exclusionary in nature, causing them to miss out on the opportunity for exposure to academic content and alienating them from certain
social contexts. Many educators believed this practice would teach the students to change their behavior while also teaching other students to avoid such disruptive behaviors (Ewing, 2000). As these practices grew and more students were excluded from educational settings, students with disabilities were experiencing increasingly more exclusionary consequences. This practice spurred civil rights issues across the country (McCarthy & Soodak, 2007). Along this same timeframe, the federal Gun-Free Schools Act of 1994 (a subsection of the Elementary and
Secondary Education Act) came out, which further supported the use of zero tolerance policies in schools in order to maintain a safe and orderly environment. This act required that each state receiving federal funds under the Elementary and Secondary Education Act have a state law requiring local education agencies to expel students from school for one year if they brought a firearm to school. This law did not, however, prohibit the lawful carrying of a firearm on school property (Gun Free Schools Act, 1994).
However, multiple researchers have found zero tolerance policies to cause more harm to students than they were correcting behavioral problems. Martinez (2009) reports many district and school administrators were misusing and abusing zero tolerance policies resulting in a higher frequency of student suspensions and expulsions. With the original intention of zero tolerance policies being used to decrease problem behaviors as students learned the consequences
associated with their choices, one would expect that suspensions and expulsions would decrease. However, according to a report from the National Association of School Psychologists (NASP, 2001), suspensions and expulsions increased under the zero-tolerance era with students from minority status backgrounds and students with disabilities being disproportionately impacted. Gage, Sugai, Lunde, and DeLoreto (2013) examined the effects of high school practices and their
zero-tolerance policies related to student unexcused absences and found that student grades suffered under the policy, which led to a trajectory of increased dropouts. These findings were consistent with the American Psychological Association’s Zero Tolerance Task Force stance that zero tolerance policies often have unintended consequences for students and do not effectively target the behaviors they were intended to address (American Psychological Association, 2008). In addition to disproportionality in the use of zero tolerance policies, Startz (2016) of the
Brookings Institution found Black students were twice as likely to receive corporal punishment as their White counterparts. Findings like these led researchers to analyze disproportionality and find ways to reduce and diminish the overrepresentation of minority subgroups within school discipline practices.
The unintended consequences of zero tolerance policies, as described above, are that many students were being suspended and expelled from public schools across the nation without consideration being given to their individual needs or the supports they might require to help them make positive, prosocial decisions. In a 2011 report from the Council of State
Governments’ Justice Center, an analysis of almost one million secondary students found over half of the students had been punished by suspension or expulsion. The result of the study showed those students who had received suspensions or expulsions were significantly more likely to dropout than students who had not been punished for their behavior through suspension or expulsion (Fabelo, Thompson, Plotkin, Carmichael, Marchbanks, & Booth, 2011). Teaching Tolerance is an organization established with the mission to “reduce prejudice, improve
intergroup relations and support equitable school experiences for our nation’s children”
called the school-to-prison pipeline. The school-to-prison pipeline is defined by the American Civil Liberties Union as “a disturbing national trend wherein children are funneled out of public schools and into the juvenile and criminal justice systems” (American Civil Liberties Union, 2018, p. 1). Teaching Tolerance reports that major contributors to the school-to-prison pipeline are the reactionary, punitive policies adopted and measures taken by districts and schools in response to student behaviors resulting in suspension and out-of-class time (Elias, 2013). Elias also reports Black students, while only accounting for 18% of the district and school populations across the nation, make up 46% of suspensions nationwide. Furthermore, one in four Black children with disabilities are suspended in contrast to their White counterparts where only one in eleven are suspended. Skiba, Michael, Nardo, and Peterson (2002) report that, in addition to racial disproportionality in discipline, a gap also exists in gender. They found that boys were almost twice as likely to receive out of school suspension as girls. These findings present a great challenge to the field of education to not only reduce punitive response to problem behaviors, but also to address the serious issues of equity in discipline across demographic groups. In short, zero tolerance policies did not effectively address and reduce student problem behaviors in many of the nation’s public schools (American Psychological Association, 2008; Fabelo, Thompson, Plotkin, Carmichael, Marchbanks, & Booth, 2011; Gage, Sugai, Lunde, and DeLoreto, 2013; Martinez, 2009; NASP 2001).
Positive Behavioral Interventions and Supports. Evidence showed neither corporal punishment nor zero tolerance policies were effective in changing student behavior, which further resulted in disproportionate and negative student outcomes. Researchers, policy makers, and educators were searching for strategies that would effectively address student behavior.
NASP identified three effective and promising alternatives to zero tolerance and
suspension/expulsion policies and practices: violence prevention initiatives, social skills training and positive behavioral supports, and early intervention strategies (NASP, 2001). Additionally, the Individuals with Disabilities Education Act (IDEA) of 1990 (an amendment of the Education of Handicapped Children Act of 1975) began addressing specific behavior disorders and
requirements for supporting identified students. The first reauthorization of IDEA (1997) not only recognized specific behavioral disorders, but it also addressed the need for more effective behavioral interventions for students with behavioral disorders and for students with disabilities whose behavior was a manifestation of their disability. Under the first reauthorization of IDEA (1997), schools were given increased flexibility in addressing behavioral issues with students with disabilities. First, schools were given the ability to discipline students with disabilities in the same way that they addressed problem behaviors for students without disabilities (with a few restrictions). Restrictions on this flexibility center around suspension and removal of students with disabilities from the educational environment. Special education students could be suspended for up to ten days without services and without a review of their Individualized Education Plan (IEP). Students with disabilities could be moved to an interim alternative education setting (IAES) for up to forty-five days if the student brought a weapon or drugs to a school or a school function. A hearing can also be held to remove the student from the
educational setting if the student is deemed a threat to other students. Additionally, IDEA (1997) requires that a student with disabilities whose behavior is a manifestation of their identified disability be placed on a behavior intervention plan (BIP). This plan is to be proactive and include positive intervention strategies. If there is a behavioral issue that arises with the student
in which the school wishes to seek alternative placement or desires to impose a suspension longer than ten days, a manifestation determination is required. This is a process that requires the student’s IEP team to determine if the behavioral concern is related to their identified disability. Finally, the first reauthorization of IDEA (1997) introduced PBIS to the law and brought the establishment of the National Center on PBIS in an effort to scale up supports for districts and schools around the implementation of evidence-based practices for addressing student behavior (Sugai & Simonsen, 2012). As a part of the work of the PBIS National Technical Assistance Center, Sugai and Simonsen (2012) discuss the purpose of the PBIS framework in the following way:
PBIS is an implementation framework that is designed to enhance academic and social behavior outcomes for all students by (a) emphasizing the use of data for informing decisions about the selection, implementation, and progress monitoring of evidence- based behavioral practices; and (b) organizing resources and systems to improve durable implementation fidelity (p.1).
The establishment of these supports led to a national shift in addressing behavior in a
preventative and proactive manner in districts and schools for all students, not just those students who were identified with behavioral disorders. New research and syntheses of past research were led by Sugai and Horner (2002) to determine the need for and effectiveness of a proactive, positive shift in responses to student problem behaviors, such as PBIS. They found four factors to be consistent in research: a) punishment and exclusionary practices are not effective in the absence of proactive systems to support students; b) there are behavioral principles that support effective systems for responding to students with behavioral disorders; c) effective instruction
can lead to a decrease in student problem behaviors; and d) school-wide behavioral support systems can effectively reduce the amount of student problem behaviors, both anti-social and disruptive (Sugai & Horner, 2002). This school-wide system is a PBIS framework that is meant to address and support student behaviors in a positive and proactive manner rather than a reactive manner. Moving from the concept of positive behavioral support for individuals with behavioral challenges to a systems approach of PBIS requires that districts and schools look to
organizational structures to support all students. Figure 2.1 is a visual depiction of the four critical elements of PBIS being supported by effective practices as presented by Sugai and Horner (2002, P. 30). The four critical elements are systems, practices, data, and outcomes. These elements are supported by the use of four effective practices: “social competence and academic achievement; supporting staff behavior; supporting decision making; and supporting student behavior” (Sugai & Horner, 2002, p. 30).
Figure 2.1: Four Elements of School-Wide Positive Behavior Support (Sugai & Horner, 2002, p. 30)
With research pointing to the use of PBIS as an effective and efficient way of addressing student behaviors in districts and schools and as a replacement for systems focused on punitive reactions, the second reauthorization of the Individuals with Disabilities Education Act of 2004 explicitly wrote PBIS in as a way to support students with disabilities whose behaviors are manifestations of their identified disability or disabilities. Multiple researchers have validated the findings and claims of Sugai and Horner (2002) and have used their research findings to expand upon the literature around PBIS in the field.
Other options for addressing behavior, such as Conscious Discipline (McDaniel, 2008), Restorative Practices (Gregory, Clawson, Davis, & Gerewitz, 2016), and Love and Logic (Fay & Fay, 2000), are available to schools. However, PBIS has been chosen by 25,911 schools for a number of reasons (OSEP, 2018). One of the many strengths of PBIS is that it is a framework, not a prepackaged program, thus making it easier to contextualize the framework in individual schools and districts while maintaining the critical features that make PBIS effective (Freeman et al., 2015). PBIS emphasizes prevention rather than solely focusing on the response after problem behaviors occur, as can be the case in other approaches (Bradshaw, Mitchell, & Leaf, 2010). In addition, PBIS has well defined components that are easily assessed in practice through
established fidelity measures such as the School-wide PBIS Tiered Fidelity Inventory (Algonzzine et al., 2014).
Thematic Review
With 25,911 schools implementing PBIS across the United States as of November of 2018, research has found PBIS to be an educational framework producing promising results (OSEP, 2018). Many researchers have focused on the common elements that support sustainable
implementation of a PBIS framework. This work has found concurrently common elements supporting and hindering implementation. Districts and schools are looking for ways to approach student behaviors that allow them to support successful outcomes effectively and efficiently. It is crucial to understand the critical features necessary for implementation fidelity and sustainability which support PBIS in being implemented and sustained over time.
Common elements for implementation of PBIS. Multiple studies have been conducted around critical features that support PBIS implementation. Coffee and Horner (2012) identified critical features of PBIS implementation: a contextually appropriate innovation; staff buy-in; a shared vision; administrative support; ongoing technical assistance; data-based decision-making and sharing; and continuous regeneration. Additionally, they found that two areas were most likely to support sustained implementation fidelity: a supportive administrator who
communicates with stakeholders around core concepts of PBIS and data which are collected and used to support decision-making. This research aligns with research conducted by Klingner, Boardman, and McMaster (2013). These researchers found support from leadership was a key driver to not only the adoption of evidence-based practices within a PBIS framework, but it was also a critical element in the sustainability of high levels of implementation. Sugai and Horner (2006) share similar findings that are consistent across districts with sustained implementation of the critical features of PBIS: effective leadership teams; allocation of resources to support
implementation; stakeholder support; effective training, coaching, and technical assistance for implementers; and on-going evaluation. These features were also echoed in research conducted by Pinkelman, McIntosh, Rasplica, Berg, and Strickland-Cohen (2015), who identified staff buy-in as a major component of effective implementation. Mathews, McIntosh, Frank, and May
(2014) concur with these findings adding implementer skill and the effective and consistent use of data as additional critical features for sustainable implementation fidelity. Using
implementation science as a lens to categorize these findings, the drivers of implementation are leadership, organizational systems, and capacity (Ogden & Fixsen, 2014). All of the research around PBIS’ critical features falls into the categories of leadership, organizational systems, and capacity.
School districts and schools must pay close attention to the evaluation of PBIS in order to ensure that high levels of implementation fidelity are occurring during implementation. Without implementation fidelity, districts and schools cannot expect to realize the outcomes they desire. A recent, comprehensive fidelity measure of PBIS is called the School-Wide Positive Behavioral Interventions and Supports Tiered Fidelity Inventory (SWPBIS TFI). The SWPBIS TFI was developed to provide the field with a valid, reliable, and efficient measure to assess to what degree a school has put the core features of PBIS in place (Algozzine et al., 2014). Not only does the SWPBIS TFI measure the extent of PBIS implementation fidelity, it was also developed and validated as an effective and efficient measurement of fidelity across all three tiers of the PBIS framework. This tool is particularly useful for educational leaders as it is a free access tool which can be used to guide planning of PBIS implementation, to progress-monitor improvement of fidelity, and to assess formatively the implementation of tiers (Massar, McIntosh, Mercer, & Hoselton, In Press). The SWPBIS TFI was specifically developed to measure implementation fidelity of the critical features of PBIS as identified by researchers in the aforementioned studies. The SWPBIS TFI specifically identifies three critical areas for Tier 1 PBIS implementation fidelity: teams, implementation, and evaluation. Additionally, the SWPBIS TFI states that a
school is considered implementing Tier 1 with fidelity when it reaches a score of 70%
(Algozzine et al., 2014). This criterion was established based upon a study conducted by Mercer, McIntosh, and Hoselton (2017), wherein the authors found statistically significant results when schools reached a 70% threshold of implementation fidelity on the SWPBIS TFI (K. McIntosh, personal communication, March 27, 2018). This study examined the outcomes of
implementation fidelity of the critical features of PBIS, and it cross analyzed multiple fidelity assessments in order to establish the 70% fidelity criterion. The researchers identify a need to continue examining the foundations of this criterion to confirm the established threshold of 70% and to generalize these findings in other regions (Mercer, McIntosh, & Hoselton, 2017).
Outcomes of implementation fidelity. In 2015, Horner and Sugai reported 21,000 schools over a timespan of twenty years had implemented PBIS. With 25,911 schools
implementing PBIS today (OSEP, 2018), multiple researchers have conducted studies around the outcomes that can be expected when districts and schools implement the critical features that support PBIS with fidelity given the amount of time and widespread sample of schools to examine. In the following sections, research around these outcomes will be presented including decreased problem behaviors and exclusionary consequences (suspensions and expulsions), increased student attendance, and increased academic achievement.
Decreased in problem behaviors and exclusionary consequences.One of the most common outcomes of implementing PBIS with fidelity is whether schools see a significant reduction in student problem behaviors. For example, Freeman, Simonsen, McCoach, Sugai, Lombardi, and Horner (2015) reported a statistically significant decrease in office discipline referrals (ODRs) for schools which were at or were approaching implementation fidelity of