Moving from Free to Fee:
How Online Firms Market to Successfully Change their Business Model
Koen Pauwels1 Allen Weiss2
October 11, 2007
1
Associate Professor, Tuck School of Business at Dartmouth, 100 Tuck Hall, Hanover, NH 03755, Phone: (603) 646-1097, Fax: (603) 646-0995, E-mail: koen.h.pauwels@dartmouth.edu.
2
Professor of Marketing, University of Southern California, Los Angeles, CA 90089-0443, Phone: (213) 740-5035, E-mail: amweiss@marshall.usc.edu
Moving from Free to Fee:
How Online Firms Market to Successfully Change their Business Model Moving from free to ‘free & fee’ for any product or service represents a challenge to managers, especially when consumers have plenty of free alternatives. For one online content provider, this paper examines (1) the sources of long-run revenue loss (through attracting fewer free subscribers) and (2) how the firm’s marketing actions affect its revenue gains (through attracting paid subscribers). The authors quantify revenue loss from several sources, including the direct effects of charging for part of the online content and the reduced effectiveness of search engine referrals and emails. Their analysis suggests several managerial implications. First, managers should focus their price promotions towards stimulating new monthly subscriptions, instead of the current promotional focus on stimulating new yearly contracts. In contrast, email and search engine referrals appear very effective at generating yearly subscriptions. Meanwhile, ‘free to fee’ conversion email blasts are a double-edged sword: they increase subscription revenue at the expense of advertising revenue. Finally, further analysis shows the move was preceded by the build-up of momentum in new free subscriptions, which appears beneficial for the move’s success. The decomposition and comparison of the sources of revenue loss versus gains reveals several tradeoffs facing companies moving from free to ‘free & fee’.
Keywords: from free to fee, online content, price, marketing communication, search-engine referrals, time series analysis, vector-autoregressive models.
Introduction
A decade ago, Peterson, Balasubramanian, and Bronnenberg (1997) heralded the Internet as a promising new channel for products and services that are low outlay, frequently purchased, and with a value proposition of intangible or informational nature. Such content providers have indeed become popular with consumers (Saba 2005). Recent research in marketing has made significant advances in our understanding of various Internet marketing issues, including Web-browsing behavior (Bucklin and Sismeiro 2003), search-engine visits (Telang, Boatwright, and Mukhopadhyay 2004), and recommendation agents (Cooke, Sujan, Sujan, and Weitz 2002; Diehl, Kornish, and Lynch 2003). However, one vexing practitioner’s problem has remained virtually untouched by formal analysis: how firm performance is affected by moving from free to free & feei —that is, from offering all content for free to charging for at least some of it. A prominent fear among content providers is the likely loss of customers to the many still free competitors. Moreover, the impact of marketing actions to stimulate paid
subscriptions is uncertain given the general consensus among web surfers that “content is free” (Dyson 1995). Empirical findings on these issues are scarce, as firms feel uneasy sharing data with academic researchers for confidentiality and competitive reasons.
Consumers certainly like getting products and services for free. Beyond the absence of monetary costs, a free good is free of trade-offs and reduces consumer
psychological costs (Ariely and Shampan’er 2004). Thus, it offers a great incentive to try a new product. However, it may also pose a problem if the company decides customers should start paying. The issue of moving from free to fee matters in many industries, including entertainment content providers and the publishing industry, which represented $240B in 2004, according to the U.S. Bureau of the Census. After the bursting of the Internet bubble, which supported free online content by investor funding and high
advertising income, many companies tried charging for their Web contentii, with varying success. Research by economists on the pricing of information goods (e.g., Bakos and Brynjolfsson 2000; Jain and Kannan 2002; Varian 1995) identified a variety of pricing models that could be employed to guide these decisions. These included usage-based pricing, micro payments, and subscription models. But irrespective of the pricing model, managers are understandably concerned on the performance impact of the move from
free to fee: consumers have been conditioned to expect free online content, and there often are many, if not thousands, of competing alternatives from which they can choose. When The NY Times moved to a paid version of its editorial pages, one reader
commented, “The only thing the NYTimes will achieve is a reduced readership for its writers. No one will, nor should we, pay for online content. It’s a big, free web out there.” The ultimate abandonment of the payment system (on September 19, 2007) appears to vindicate these arguments, and illustrates the challenge content providers face online.
In sum, despite high managerial importance, little empirical research has addressed the following questions facing companies moving from free to ‘free & fee’:
1) What are the long-run performance effects of such a move? In particular, what are the sources of revenue loss that may offset the revenue gains from user fees? 2) What role do marketing actions play in the free- and fee-user response? In
particular, which actions are especially successful in increasing free and fee subscriptions, for both short-term and long-term contracts?
This research aims to shed light on these issues by focusing on the adoption behavior for free and fee-based Web content and marketing actions that may affect this behavior. Indeed, the number of new free and paying subscribers are key performance indicators for content providers, who depend on these numbers for both advertising and subscription income. The potential drivers of these subscriber numbers are many, and include consumer characteristics (e.g. price sensitivity and perceived content value), competitive characteristics (e.g. market concentration, content overlap and pricing schemes) and company characteristics (e.g. content restriction and marketing decisions). In this paper, we are interested in the short- and long-run effects of marketing
communication and price promotions (i.e., temporary price cuts) on new free- and fee-user subscriptionsiii. To this end, we apply several modern time series techniques to a daily dataset from a commercial Web site in the ‘business content’ industry. Next to Personals/Dating and Entertainment/Lifestyles, this industry is among the top 3 categories for online content, with a 2005 total spending of $312 M and of growth of 49% compared to 2001(Online Publishers Association 2005).
Research Background
Previous research has examined several phenomena related to our research questions. Three decades ago, Scott (1976) studied the effect of a free two-week trial subscription on consumer willingness to pay for a six-month newspaper subscription. Interestingly, consumers who were offered the free trial were less likely than those in the control group to become paying subscribers. More recently, Gedenk and Neslin (1999) and Bawa and Shoemaker (2004) analyzed the impact of free samples on subsequent (paid) purchases. The former study found that distribution of free samples increased the probability consumers would buy the brand in the future. The latter study explicitly distinguished and allowed for potential negative effects (cannibalization of paid
purchases) and positive effects (acceleration of purchases by customers and expansion— i.e., purchases by non-customers). Importantly, both short-run and long-run effects of free samples were positive; they yield higher customer retention after trial, a larger potential for acceleration of purchases by new consumers, and a higher purchase probability among those who would otherwise not have tried the brand.
Though our research shares a similar focus on the performance effects of
marketing actions, it differs from previous papers in at least two important respects. First, all mentioned studies examined the effects of marketing actions on purchase behavior in contexts where people are used to paying, and ultimately expect to pay, for the product or service. In contrast, we deal with markets where (potential) customers have likely
become accustomed to free content and thus have a zero reference price. It is not clear how this will affect the impact of marketing on subscriptions. Therefore, our exploratory analysis may provide new insights into marketing effects in such environment. Second, the move from free to fee is virtually always partial for online content. Firms maintain a mix of free and for-fee content and, therefore, of free and for-fee subscribers. Because content providers often rely on growing free users to attract advertisers, this research is unique in examining how marketing decisions affect both paying customers (who yield subscription revenue) and non-paying customers (who yield advertising revenue).
In our context, the revenue implications of the move from free to ‘free & fee’ may be written in terms of changes to Free Subscribers (Fsub) and Paying Subscribers (Psub):
∆ Revenue = ∆ FSub * Advertising Revenue per free subscriber + ∆ PSub * Fee (1)
where ∆ stands for the difference between the actual value of a series and its benchmark; i.e. a model-forecasted value of the series in the absence of the move. The first part of equation (1) represents a potential revenue loss from fewer free subscribers, while the second part represents a potential revenue gain from paying subscribers. We proceed by considering the likely drivers of this revenue loss and revenue gain in turn.
2.1. Sources of revenue loss: how does the move from free to fee hurt free user growth? In a general sense, content providers who move from free to fee are making two strategic decisions: a restriction-level decision and a pricing decisioniv. The restriction-level decision is the extent to which formerly free content will now be restricted to paying users. Conceptually, restriction can range along a continuum, from complete restriction to highly selective restrictions (i.e., most of the content is free, except for a few selections). Often, at least part of the content remains free (e.g., The New York Times, ESPN, and our data provider), resulting in a combination of free and fee subscribers.
When content providers decide to move from free to fee, their site may become less attractive to free users. There are at least two reasons for this. First, such change blocks free access to certain aspects of the provider’s content, thus reducing free users’ perceived benefits and, thus, demand (Brynjolfsson, Hu, and Smith 2003). Second, potential users generally are accustomed to obtaining content for free on the Web and likely expect the same from any specific provider. Any (short or long contract) price is thus likely to be rejected (Brehm 1966) by some potential users whose preferences for free content have been formed. Fitzsimons and Lehmann (2004) note that encountering unexpected paid content tends to decrease the attractiveness of free content and reduce satisfaction with the choice options. On the other hand, a move from free to fee may expand the market for fee content due to price signaling; i.e. the price of fee content signals a higher quality to the (potential) subscriber (Zeithaml 1988).
Besides its direct effect on new free subscribers, the move from free to fee may also decrease the effectiveness of marketing communication on generating free
subscriptions. Indeed, the short-run and long-run effects of marketing communication
likely depend on the perceived value of the offer (Hanssens and Ouyang 2001). By closing off the for-fee part of their content to free subscribers, providers may lower the perceived value of a free subscription. Especially harmful would be a refocus of the communication message on stimulating for-fee, rather than free, subscriptions. Such ‘conversion’ efforts typically highlight the benefits of fee content, at the expense of free content.
In sum, the move from free to fee may influence new free subscriptions (1) directly, (2) via changes in the effectiveness of marketing communications and (3) via conversion efforts, as represented in equation (2):
∆ FSub = ∆ Move + ∆ Markcom effectiveness + ∆ Conversion (2)
2.2 Sources of revenue gain: how do marketing actions stimulate fee user growth? Given this potential for revenue loss, it is crucial for the company’s performance to generate paid subscriptions. Typically, online content providers offer the choice between short-term contracts versus long-term contracts. Across all online content categories, subscriptions represents 78.4% of content purchases (Online Publishers Association 2005), with monthly and annual contracts accounting for 92% of these subscriptions (the remainder being weekly, quarterly and semi-annual forms of subscriptions). The key distinction between short-term and long-term contracts is the length of time the user commits to paying for the content. Commitment issues are particularly interesting when moving from free to fee; users accustomed to the no-commitment, no–trade-off situation of free content (Ariely and Shampan’er 2004) suddenly face the choice of whether, and for how long, to commit. We expect that price promotions and marketing communications have different effectiveness in stimulating new short-term versus long-term contract subscriptions.
Some users will be reluctant to make a long-term commitment. Short contracts allow such users to try out at minimal commitment and diagnose the extent to which the content is useful, and thus facilitate their adoption decision (Rogers and Shoemaker 1971). Regret is less likely with a short contract; if users find better or equivalent content at a lower price, they can switch faster with a short contract than with a long contract. To
the extent that price promotions offer a risk premium for trial (Gedenk and Neslin 1999; Pauwels, Hanssens, and Siddarth 2002), they may be very effective for stimulating short contracts.
Price promotions may be less effective in stimulating long-term contracts. Users willing to commit to such contracts believe the content will interest them over a long period of time (Laurent and Kapferer 1985). Moreover, when accessing the content is considered a virtue (versus a vice), users may prefer a long contract for pre-commitment reasons (Wertenbroch 1998). Finally, users may prefer long contracts for convenience reasons; they have to renew their subscriptions less often (Lambrecht and Skiera 2006). This factor appears especially powerful when someone else, e.g., the user’s employer, is paying the bill. Given these reasons, price promotions should be less powerful in
increasing new long-term contracts.
Instead, marketing communication may play a larger role in generating new long –term contracts. Among such actionsv, content-based Web sites spend most
communication dollars aimed at obtaining a high ranking on search-engine sites such as Google, Yahoo! and MSN; including investing in the optimization of a site so that Web users find it during an Internet search (Telang, Boatwright, and Mukhopadhyay 2004). Moreover, many sites engage in targeted emails to free subscribers, with the intent of upselling them to paying services.
In sum, we consider how moving from free to a restricted fee–based offering affects (1) the “advertising revenue” component of the online content provider, through free-user growth; (2) the “subscription revenue” component, through paid-user growth; and (3) the effectiveness of marketing actions to stimulate free- and paid-user growth.
Empirical Setting
Our dataset covers a period of almost four years (6/14/2001–3/27/2005) with 1,383 daily observations at an online content provider. Its site permits visitors to read articles that provide analysis and opinion on topics of interest to marketing professionals. Visitors registervi for free content by providing only an e-mail address and choosing a password. The site was supported solely through advertising income until January 1, 2004, at which time a fee-based subscription business model was introduced whereby
paying subscribers received access to advanced articles and other services, such as a buyer’s guide and the guarantee they would see no third-party advertisingvii. As advanced articles used to be free, this situation likely represents a loss of value for the free
subscribers. Paying subscribers were given the option of either a monthly or a yearly fee, corresponding to our distinction between short-term and long-term contracts. Promotions on these fees were run periodically. It is important to note that, because the restriction of free content occurs at the same day as the charging of fees for accessing the restricted content (as usual for content providers), we can not separate these two effects. Instead, we refer to January 1st 2004 as ‘the move from free to fee’. Our data thus capture a single ‘natural experiment’, which analysis has a long tradition in the social sciences, including marketing (e.g. Neslin and Shoemaker 1983, Ailawadi et al. 2001). For this proprietary dataset, Table 1 displays summary statistics on the subscription and price series.
---- Insert Table 1 about here ----
On average, 111 users a day register for free content, and this number is growing by about 5.5 per week (0.185 a day). As for paid subscriptions, yearly contracts are more popular than monthly contracts probably because the former present a better deal for long-term use. Indeed, the regular monthly price is $4.95, while the regular yearly price is $49.95 throughout the sample, and several price promotions are run (in the model, we use these price promotions as variables because the charging of regular prices occurs at the same time as the move from free to fee). We note that these prices are representative of the entire online content industry, for which the latest available figures indicate an average annual subscription fee of $49.69 in 2001 and $48.94 in 2002 (Online Publishers Association 2003).
As for the content provider’s marketing efforts, we have data on two types: targeted communication through e-mails to current subscribers, and mass-market
communication yielding search engine referrals. Targeted communication includes e-mail “blasts” sent to potential and current free subscribers, with the intention of upselling them to paid-subscription levels. Moreover, we have data on other e-mails sent to a certain number of subscribers, with a variety of news, including announcements of new services and events. In terms of mass-market communicationviii, our data include the number of referral searches from all major search engines to the Web site. This variable is not truly
a marketing control variable, but the outcome of consumer searches and a host of contributing management activities such as search engine optimization (which the company started about a year before the move), links from other sites, and a multitude of other promotion and advertising type activities that a site engages in to increase its rankings. Given the absence of information on the timing and magnitude of each of these activities, search engine referrals represent our best proxy measure. For these variables, Table 2 contrasts the average (daily) levels before and after the move from free to fee.
---- Insert Table 2 about here ----
Search-engine referrals increase from 410 in the for-free period to 2,921 in the for-fee period. Likewise, e-mails increase from 505 to 7,085. In other words, both activities are a magnitude higher in the period after the move from free to fee. And, logically, the for-fee period sees virtually all “blasts”, aiming to upgrade (potential) free subscribers to the paid service (the one blast in the for-free period occurred shortly before the move, and we do not include it in our analysis given that our series of paying
subscriptions only start on January 1st 2004). Finally, it is instructive to compare the average of daily new free subscriptions before and after the move; this number increased from 64 to 209. This growth is also evident from Figure 1, which displays the free subscription time series.
---- Insert Figure 1 about here ---
Besides the positive trend, a key feature of the new subscription data is seasonality of two types: high frequency (day-of-week) and low frequency (year-end holiday). Pauwels and Dans (2001) observe similar patterns in daily data for online newspapers and offer several reasons. First, the website is dedicated to the marketing profession, so new users typically discover it during a workday – not the weekend or holidays. Second, Internet access is typically available at work, but may not be at home (especially in developing countries – from which our data provider does attract some subscribers). Note too that, like Table 2, Figure 1 does not show an easily recognizable harm of the move from free to fee (1/1/2004) to new free subscriptions. It could be that no such harm occurred or that it is masked by the content provider’s increased marketing efforts. Therefore, we need to go beyond a before/after comparison and formulate a model to account for marketing actions and address our research questions.
Methodology
Based on our research questions and data, our choice of methodology is driven by four main considerations. First, the model should control for trend and seasonality
patterns, and it must provide a forecasted, expected baseline for each performance variable so that we may capture the impact of unexpected events (e.g., the move from free to fee) as deviations from this baseline (Abraham and Lodish 1987). Second, the model should be robust to deviations from stationarityix, which can lead to spurious regression problems (Granger and Newbold 1986). Third, the model should provide a flexible treatment of both short-run and long-run effects of marketing actions on
performance (Dekimpe and Hanssens 1999). Finally, the model should allow for various dynamic interactions among performance variables (e.g., the likely interaction between new free and paid subscriptionsx), among marketing variables (e.g., a likely increase in marketing communication each time a fee price is promoted), and between marketing and performance variables (e.g., a decrease in new free subscriptions induces the content provider to send more emails).
In sum, our model should account for the time-series properties of performance and marketing variables and for their dynamic interactions. The persistence modeling framework (Dekimpe and Hanssens 2004) addresses these four criteria in several methodological steps, summarized and extended (with robustness checks) in Table 3.
---- Insert Table 3 about here ----
Permanent Versus Temporary Change: Unit Root and Cointegration Tests
First, unit root tests verify the univariate time-series properties (stationarity versus evolution) for each variable. The substantive question they address is whether our
performance variables (new subscriptions) are mean-reverting (stationarity) or have changed permanently in the data sample (evolution). We use both the Augmented Dickey-Fuller test procedure recommended in Enders (2003) and the Kwiatkowski-Phillips-Schmidt-Shin test (1992). The former maintains evolution as the null hypothesis (and is the most popular in marketing applications), while the latter maintains stationarity as the null hypothesis. Each test is estimated in two forms: with and without a
deterministic time trend. Convergent conclusions of these different tests yield higher
confidence in our variable classification (Maddala and Kim 1998). Next, we examine the robustness of our unit-root test conclusion to structural breaks (Perron 1989, 1990), as the move from free to fee is an obvious choice for such break point. Finally, the cointegration test of Johansen et al. (2000) verifies whether any combination of evolving variables is in long-run equilibrium, allowing for structural breaks in these variables.
Modeling Dynamic Interactions: VARX Models
Next, we specify vector-autoregressive (VARX) models that are well suited to measure the dynamic performance response and interactions between performance and marketing variables (Dekimpe and Hanssens 1999). Both performance variables and marketing actions are endogenous—i.e., they are explained by their own past and the past of the other endogenous variables. Specifically, VARX models not only measure short-run and long-short-run response to marketing actions, but also capture the performance implications of complex feedback loops.
VARX models are specified in levels or differences (d) of each endogenous variable, depending on the results of its unit-root tests. Model specification requires two remaining choices: the number of lags K, also known as the order of the model, and which variables to include as endogenous. We base the former on the Bayesian Information Criterion (BIC), which is a consistent estimator of lag length (Lütkepohl 1993), and test whether we should add lags to pass diagnostic tests on residual
autocorrelation (Franses 2005). As to the latter, we include all variables as endogenous for which Granger Causality tests reveal that they are caused by another variable in the system (Enders 2003). The remaining variables (in our case, only the move from free to feexi) are included as exogenous variables, with as many lags as indicated by residual tests. Finally, as control variables (the vector C), we include an intercept, six day-of-week seasonal dummies (using Friday as the benchmark), a dummy for the year-end holidays, and a time trend to capture external factors (to the extent possible), such as growth in Internet access, growth in people with high-speed bandwidth, general increases in content and content providers, etc.
Given the nature of our data and research focus, we have to be careful which data periods to analyze. Obviously, there were no paying subscribers before 1/1/2004, and the
regular price jump from zero to the regular (monthly and yearly) prices is likely to have had a different impact than the subsequent price promotions off the regular price. Therefore, we specify two different models:
Model 1: For the full data period, this model includes new free subscriptions, both marketing efforts (E-mails, Blast) and search engine referrals. The impact of the move from free to fee on free subscriptions is manifested in two ways: (1) the pulse variable ‘Move’ (taking on a value of 1 at the time of the move from free to fee)
measures the direct effect on the subscription series, and (2) the step variable ‘Fee’ (0 in the for-free period, 1 in the fee & free period) interacts with Search engine referrals and Emailxii to assess how their effectiveness differs after the move. Evidently, all variables may have an immediate (same-day) or a lagged effect. Equation (3) presents the model:
1 1 * * * 0 * * 0 t t k t j t t k t j t t k t j j t t k t j t t k t t k K k k
dFSub dFSub M ove
dSearch dSearch M ove
Em ail Em ail M ove
C B
Blast Blast M ove
Search Fee Search Fee
Em ail Fee Em ail Fee
− − − − − − − − − − = ⎡ ⎤ ⎡ ⎤ ⎡ ⎤ ⎢ ⎥ ⎢ ⎥ ⎢ ⎥ ⎢ ⎥ ⎢ ⎥ ⎢ ⎢ ⎥ ⎢ ⎥ ⎢ = + × + Γ ⎢ ⎥ ⎢ ⎥ ⎢ ⎢ ⎥ ⎢ ⎥ ⎢ ⎢ ⎥ ⎢ ⎥ ⎢ ⎢ ⎥ ⎢ ⎥ ⎢ ⎣ ⎦ ⎣ ⎦ ⎣ ⎦
∑
, , , , * , * , 0 (3) FSub t Search t Em ail t Blast t S F t E F t J j u u u u u u = ⎡ ⎤ ⎢ ⎥ ⎥ ⎢ ⎥ ⎥ ⎢ ⎥ + ⎥ ⎢ ⎥ ⎥ ⎢ ⎥ ⎥ ⎢ ⎥ ⎥ ⎢ ⎥ ⎣ ⎦∑
with Fsub the number of new free subscriptions, Search the number of search engine referrals, Email the number of general emails sent, Blast the presence of free-to-fee conversion emails, C the (6*1) vector of control variables, K the order of the model, Bk and Γjthe (6*6) and (6*1) vectors of dynamic coefficients, J the maximum of lags
selected for the effect of move on each endogenous variable, and [uFSub,t, …, uE*F,t]' ∼N(0,Σu). We estimate this model in units (instead of logarithms) in order to obtain a
managerially relevant decomposition of the effects of interest (van Heerde et al. 2003). Model 2: For the for-fee period starting 1/1/2004, this model includes new free subscriptions and all three marketing efforts (E-mails, Search, Blast), and adds new subscriptions for the monthly (MSub) and yearly (Ysub) contracts. Moreover, instead of the regular prices (which are constant throughout the for-fee period), we include price promotions ($ off) for monthly (Mprom) and yearly (Yprom) contracts:
, , 2 1 P r P r P r P r t t k F S u b t t t k M S u b t t t k Y S u b t t k t t k t t k t t k t t k K k k d F S u b d F S u b u d M S u b d M S u b u d Y S u b d Y S u b u d S e a r c h d S e a r c h C B E m a i l E m a i l B l a s t B l a s t M o m M o m Y o m Y o m − − − − − − − − = ⎡ ⎤ ⎡ ⎤ ⎢ ⎥ ⎢ ⎥ ⎢ ⎥ ⎢ ⎥ ⎢ ⎥ ⎢ ⎥ ⎢ ⎥ ⎢ ⎥ ⎢ ⎥ = + × ⎢ ⎥ + ⎢ ⎥ ⎢ ⎥ ⎢ ⎥ ⎢ ⎥ ⎢ ⎥ ⎢ ⎥ ⎢ ⎥ ⎢ ⎥ ⎢ ⎥ ⎢ ⎥ ⎢ ⎥ ⎢ ⎥ ⎣ ⎦ ⎣ ⎦
∑
, , , , P r , P r , ( 4 ) t S e a r c h t E m a i l t B l a s t t M o m t Y o m t u u u u u ⎡ ⎤ ⎢ ⎥ ⎢ ⎥ ⎢ ⎥ ⎢ ⎥ ⎢ ⎥ ⎢ ⎥ ⎢ ⎥ ⎢ ⎥ ⎢ ⎥ ⎢ ⎥ ⎢ ⎥ ⎣ ⎦with FSub the number of new free subscriptions, MSub the number of new monthly-contract subscriptions, YSub the number of new yearly-monthly-contract subscriptions, Search the number of search engine referrals, Email the number of general emails sent, Blast the presence of free-to-fee conversion emails, MProm the $ amount of a price promotion on the monthly subscription price, YProm the $ amount of a price promotion on the yearly subscription price, C the (8*1) vector of control variables, K the order of the model, Bk the (8*8) vector of dynamic coefficients, and [uFSub,t, …, uYprom,t]' ∼N(0,Σu). We estimate
equation (4) both in units and in logarithms. The former yields a managerially relevant assessment of marketing effectiveness, while the latter directly yields unit-free elasticities (Pauwels et al. 2002), which allow comparison of percentage gains of marketing
communication and price promotions for monthly versus annual contracts (and with potential future research on this matter).
Long-Run Impact of Marketing Actions: Impulse-Response Functions
A VARX model estimates the baseline of each endogenous variable and forecasts its future values based on the dynamic interactions of all jointly endogenous variables. Based on the VARX-coefficients, impulse-response functions track the over-time impact of unexpected changes (shocks) to the marketing variables on forecast deviations from baseline for the other endogenous variables.
To derive the impulse-response functions of a marketing action, we compute two forecasts, one based on the information set without the marketing action and the other based on the extended information set that accounts for the marketing action. The difference between these forecasts measures the incremental effect of the marketing
action. Importantly, these dynamic effects are not a priori restricted in time, sign, or magnitude. As for the immediate (same-day) effects, we adopt the generalized,
simultaneous-shocking approach (Pesaran and Shin 1998), which uses information in the residual variance-covariance matrix of the VARX model instead of requiring the
researcher to impose a causal ordering among the endogenous variables (Dekimpe and Hanssens 1999). Finally, we follow established practice in marketing research and assess the statistical significance of each impulse-response value by applying a one-standard error band, as motivated in Pesaran, Pierse, and Lee (1993) and Sims and Zha (1999). Our interpretation of the estimated effects focuses on the immediate (same-day) effect and the permanent effect; i.e. the value at which the impulse response function stabilizes. These numbers operationalize respectively the short-run and the long-run effects of variables on the subscription series. Finally, we compare the long-run effects based on the significance tests for the difference in impulse response functions outlined by Pauwels (2004). In particular, two impulse response functions are considered as
significantly different if their long-run effect is significantly different (using the standard error of the accumulated response function, based on the joint distribution of the
individual period’s standard errors, as detailed in Lütkepohl 1993, chapter 3.7).
Results
Unit root tests and VARX Model fit assessment
First, the unit-root tests (Table 4) reveal evolution in all three subscription variables and in search-engine referrals (even after allowing for a structural break at the time of the move), but stationarity for e-mails, blasts, monthly-contract and yearly-contract price promotions. As no combination of evolving variables shows evidence of cointegration, we proceed by estimating our models with the three subscription variables and search-engine referrals in differences. Note that significant marketing effects on performance difference (or ‘growth’ hereafter) imply that the action has permanently changed the performance level (Dekimpe and Hanssens 1999, Pauwels et al. 2004).
---- Insert Table 4 about ----
Both estimated VARX models have significant F-statistics for overall model fit (respectively 95.5 and 14.65). Moreover, they adequately explain the performance series:
the adjusted R2 for new free-subscription growth is respectively .832 (Model 1) and .865 (Model 2), while for new monthly and yearly subscription growth the adjusted R2 is respectively .597 and .683 (Model 2). Likewise, growth in search-engine referrals follows predictable patterns. The explanatory power for the marketing action variables is
logically lower (between .12 and .28), indicating they are mostly unexpected “shocks” to the system and thus plausibly unexpected to customers as well. Finally, both models pass the diagnostic tests (Franses 2005) for residual correlation (Durbin Watson test and LM tests), residual normality (Jarque-Bera test), and heteroskedasticity (White test).
Short-run and long-run marketing effects on new subscriptions
Estimation of the impulse-response functionsxiii reveals that all dynamic effects stabilize within a week, as illustrated in Figures 2-4 for the main driver affecting each of the three new subscription series.
---- Insert Figures 2-4 about here ----
The impact of search engine referrals on new free subscriptions is significant in the first day, peaks in the second and then settles into a significant long-run effect (Figure 2). In contrast, monthly-contract price promotions reach their highest impact right away on new monthly-contract subscriptions, and then show a post-promotion dip before stabilizing at a significantly positive long-run level (Figure 3). In comparison, the effect of yearly-contract price promotions on new yearly-contract subscriptions is much smaller in magnitude. However, a small post-promotion dip is offset by positive dynamic effects, causing the long-run effect to exceed the short run effect. Plausibly, yearly contract subscribers are not as price sensitive as monthly contract subscribers, and the promotion mostly acts a salient attention-grabber, which leads several people to sign up a few days afterwards. Tables 5-6 present the full results on short- and long-run marketing effects.
---- Insert Tables 5-7 about here ----
Table 5 displays the unit effects of potential drivers on new free subscriptions. Both search-engine referrals and e-mails have a positive effect on new free subscriptions. However, the move from free to ‘fee & free’ reduces the growth in free subscriptions compared to the baseline forecast. This reduction is relatively substantial: the daily
number of new free subscriptions is 208 fewer in the for-fee period than it would have been had the company not started charging for content.
Moreover, the move from free to fee reduces marketing communication effectiveness. Both search-engine referrals and e-mails have lower long-run effects on new free subscriptions —respectively 6 percent 0.029/0.453) and 21 percent (-0.525/2.466) less than before the move. We can multiply this loss in marketing
communication effectiveness with the average marketing communication levels in Table 2 to conclude the company lost 79 daily free subscriptions through the search-engine referral effect and 4 daily free subscriptions through the e-mail effect.
Finally, we note an interesting twist in the effect of blasts on new free
subscriptions. The short-run effect is positive, indicating a possible complementarity effect: the general e-mail blasts may further raise awareness for the free site and induce free customers to recommend the site to friends and colleagues. In the long run, though, the substitution effect dominates: the blast reduces free-subscriber growth, probably because it convinces potential free subscribers to instead become paid subscribers. Indeed, Table 6 shows that blasts increase both monthly-contract and yearly-contract subscriptions (we take a closer look at this trade-off in the effect decomposition section).
The marketing communication and promotion effects in Table 6 show the expected signs, including some cannibalization of monthly subscriptions through
promotions on the yearly contract’s price. Interestingly, monthly price promotions have a stronger long-term unit effect on monthly subscriptions than yearly price promotions have on yearly subscriptions. As for communication efforts, all three variables have a higher long-term unit impact on new yearly versus new monthly subscriptions. E-mails are twice as effective in stimulating yearly versus monthly subscriptions. Moreover, search-engine referrals are three times as effective in generating new yearly versus monthly subscriptions. Finally, general e-mail blasts (designed to induce free subscribers to upgrade) are even ten times more effective for stimulating yearly versus monthly contracts. These long-term effect differences are significant at the 1% level.
Table 7 shows the estimated marketing elasticities, based on the log-log version of equation (4). While we have no such comparison benchmark for the other marketing actions, we note that the promotional elasticity for monthly contracts is in the range
reported for sales of fast moving consumer goods (e.g. Pauwels 2004, 2007), while the promotional elasticity for the yearly contracts is in the range reported for newspaper subscriptions (Lewis 1995) and access to telecommunication services (Danaher 2002). We observe the same relative pattern as that in Table 6: price promotions have a higher long-term elasticity for monthly contracts, while marketing communication efforts have a higher long-term elasticity for yearly contracts (and elasticity differences are significant at the 5% level). The magnitude of the difference is less outspoken though, as yearly contracts have a higher baseline than monthly contracts. An interesting observation is that, despite the inelastic demand for the yearly contract, it receives most of the promotional activity. This may indicate that management overestimates the price elasticity of such subscriptions, as reported by many scholars for the printed newspaper industry (Lewis 1995).
Robustness checks
We assess the robustness of our substantive results in two ways. First, we investigate the parameter stability of the VARX models by bootstrapping: we draw a sample with replacement 250 times and estimate the model on each sample. A comparison of the original estimates and the distribution of the bootstrap estimates reveals that all substantive results hold up. For each significant effect in the original analysis, we observe that the 90% range of the bootstrapped estimates excludes 0 (detailed results available on request). Thus, we see no cause of concern regarding the stability of the parameters of interest, being consistent with the information in the original coefficient estimates and their standard errors
Second, we estimate a regression model explaining dFsub, corresponding to the VARX-model in equation (3) and a simultaneous equation system corresponding to the VARX-model in equation (4), which we display in equation (5):
, , , n 1 2 1 1 0 0 0 2 3 4 5 0 0 0 0 1 * * * * * * * Pr * Pr * t FSub t F t k t l t l t n t p t q t r t v FSub t t MSub t M t k K L M N k l m k l m n Q P R V p q r v p q r v K k k
dFSub C dFSub dMSub dYSub dSearch
Email Blast M om Y om u dMSub C dMSub δ γ γ β β β β β δ − − − − − − − − − = = = = = = = = = = + + + + + + + + + = +
∑
∑
∑
∑
∑
∑
∑
∑
∑
, , n 3 4 6 0 0 0 7 8 9 10 0 0 0 0 5 6 1 0 * * * * * * Pr * Pr * * * t l t l t n t p t q t r t v MSub t t YSub t Y t k t l t l L M N l m l m n Q P R V p q r v p q r v K L k l m k ldFSub dYSub dSearch
Email Blast M om Y om u
dYSub C dYSub dFSub dMSub
γ γ β β β β β δ γ γ − − − − − − − − − − = = = = = = = = = + + + + + + + + = + + +
∑
∑
∑
∑
∑
∑
∑
∑
∑
, n 11 0 0 12 13 14 15 0 0 0 0 * * * * Pr * Pr t n t p t q t r t v YSub t M N m n Q P R V p q r v p q r v dSearch Email Blast M om Y om u β β β β β − − − − − = = = = = = + + + + + +∑
∑
∑
∑
∑
∑
(5)where C stands for the deterministic terms (intercept, trend and seasonality), all variables have the same interpretation as before, and the number of lagged terms (determined by a specification search) may differ for each variable and in each equation. We estimate this model by 3SLS; which accounts for the correlation of the right-hand side variables with the error terms, and for contemporaneous correlation and heteroskedasticity in the residuals (Zellner and Theil 1962), using lagged terms as instrumental variables.
Note that the model in equation (5) does control for trend and seasonality patterns and for deviations from stationarity (as variables are included in differences or levels, depending on the unit root test results). Moreover, it incorporates both immediate (short-run) and dynamic (long-(short-run) effects of marketing actions on the subscription series, and the possible relation between free and paid subscriptions. However, it does not
incorporate dynamic interactions among the marketing variables, nor dynamic effects of the subscription variables on the marketing actions (‘performance feedback’ in Dekimpe and Hanssens 1999). Therefore, a comparison of model fit for equation (3) and (4)
indicates the extent to which such dynamic interactions help explain the data patterns. We compare both in-sample fit and forecasting accuracy (based on the 2005 data as hold-out sample). Finally, a comparison of the model estimates for the common variables provides a robustness check of our substantive results.
Our estimation of the regression and simultaneous equation model yields, for each, significant F-statistics for overall model fit. We compare these models with the
proposed VARX models using (1) in-sample explanatory power and (2) one-step ahead forecasts errors in the hold-out sample). Table 8 shows that the VARX models have a higher R2 and adjusted R2, and a lower one-step ahead Root Mean Squared error than their corresponding equation, and this for each of the three subscription series in the Simultaneous Equation model.
---- Insert Table 8 about here ----
Comparing the many model estimates in common with the corresponding VARX model (results available upon request), we observe a strong consistency in the substantive results (sign and significance) for both models, with an almost identical estimate for the immediate (short-run) effect. The major difference lies in the long-run effects: after the first lag, the effect estimates are virtually all insignificant in the alternative models. Plausibly, the VARX model captures performance feedback and other complex dynamic interactions, which have made it the model of choice in many recent papers with a focus on long-run effects (see Dekimpe and Hanssens 2004 for a review).
In sum, the robustness checks reveal no reason to doubt the validity of our substantive results – though of course replication is needed to examine whether they apply to other content providers. We offer several suggestions to this end in the conclusions.
Decomposing the sources of revenue loss and comparing them with revenue gains We assess managerial implications by decomposing the loss of free subscriptions into its sources (equation 2), and by comparing the resulting loss of potential advertising revenue with paid subscriber revenue (equation 1). To this end, we compare the actual number of new free subscriptions to the expected number based on our VARX forecasts.
First, we obtain the model-forecasted levels of new free subscriptions in the absence of the move from free to fee. This average daily number is 1,147 higher than in the for-free period, due to the large increase in search engine referrals and emails (Table 2). As the actual daily number is only 144 higher, we aim to explain the loss of 1,003 free subscriptions a day. Our VARX model estimates reveal the following 3 drivers:
1. The move from free to fee itself (i.e. the combination of restricting free content and charging for content) accounts for 208 lost subscriptions a day.
2. The decrease in marketing communication effectiveness (search engine referrals and emails) accounts for 71 fewer free subscriptions a day.
3. The blasts in the for-fee period decrease new free subscriptions, for a total of 752. The total estimated loss from our model is 1,031, which differs from the raw data loss of 1,003 by only 28 (i.e., about 3 percent).
The relative magnitude of the first two revenue loss sources appears intuitive: the reduction in marketing effectiveness matters, but not nearly as much as the move from free to fee itself; i.e. the restriction of valuable content that used to be free. The impact of blasts is more surprising, but makes sense when considered in combination with the gain in new paying subscription numbers. Indeed, while all 29 blasts together decrease new free subscriptions with a total of 752, they increase new monthly-contract and yearly-contract subscriptions with respectively 5 and 51. The relevant question then becomes which of the blasts’ effects yields the highest monetary impact. More generally, we need information on the advertising income generated by free users to compare their revenue contribution with that of the for-fee subscribers.
The content provider gave us its best estimates of how much advertising revenue increases for every 1,000 new free subscriptions. This revenue is almost exclusively based on the advertising e-mails sent to the free subscribers—other forms of advertising obtain much lower revenues. This extra revenue for an extra free subscriber is $1.63 a yearxiv, or 0.45 cents a day. From Table 1, we know that the comparable revenue numbers are $48 for yearly-contract subscribers and $4.94 for monthly subscribers (a conservative estimate assuming they do not renew, in which case they are worth up to 12 times more, i.e. $59.28 a year). These paying subscribers are not exposed to email advertising, and thus yield only their fee in revenues. We use this numbers to calculate the net revenue impact of blasts and of the move from free to fee.
First, the blasts generate $2,454 in paying subscriber revenue in total, which is double their total loss of $1,224 in free subscriber advertising revenue. Overall, the move from free to fee yields a daily revenue loss of $4.64 (1,031* $0.0045), which is more than offset by the daily average revenue of $277 (2.06* $4.94 + 5.55* $48) from paying subscribers. In other words, the move from free to fee is profitable for this firm; the resulting subscriber revenue is higher than the loss in advertising revenue.
Timing of the move from free to fee
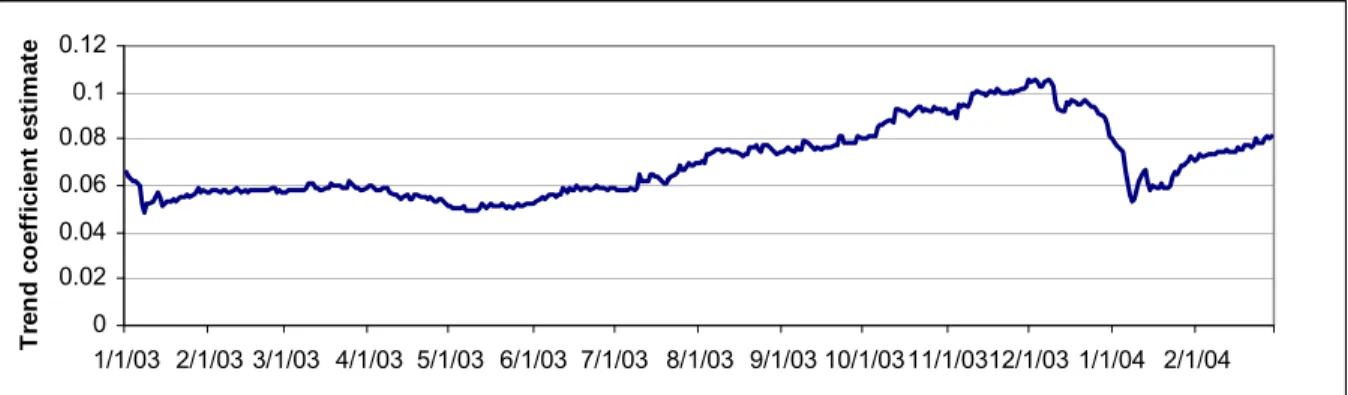
While we focus on analyzing the consequences of the move from free to fee, its antecedents may also be of interest to managers contemplating such move. In particular, it appears intuitive to wait until the free site becomes more popular; a sign that consumers have come to realize its value. We test for this intuition in several ways. First, Granger Causality tests determine whether the move can be attributed to daily changes in (new free) subscriptions. Second, the move’s timing could also be influenced by trends in subscriptionsxv. Indeed, recent research offers conceptual and empirical support for the importance of such ‘performance regimes’ (Pauwels and Hanssens 2007), operationalized as rolling window estimates of either the deterministic trend (ibid) or the stochastic trend in performance (Bronnenberg, Mahajan and Vanhonacker 2000, Pauwels 2001).
A deterministic trend implies that the series steadily moves in a certain direction: significantly positive trends represent growth; significantly negative trends decline. We test for its significance in a rolling window test that decomposes the performance series into constant, trend and seasonal fluctuations, as depicted in equation 6:
yt = c + δt +
∑
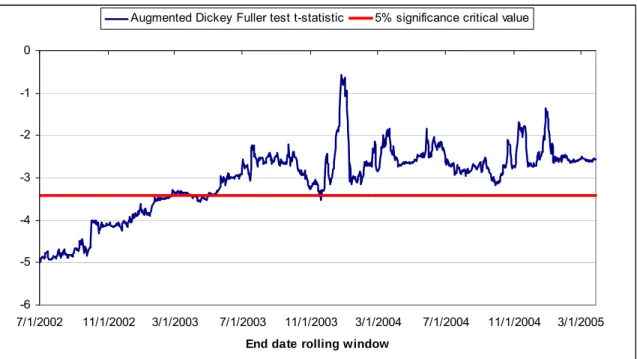
= 7 2 j λj DoWj + γ Holiday + ρ yt-1 +εt ` (6) with t representing the deterministic time trend, DoW the 6 day-of-week dummies (using Friday as the benchmark) to capture high-frequency noise, Holiday the dummy variable for end-of-year holidays to capture low-frequency noise, and a lagged term to capture autoregressive behavior (as indicated by the Durbin-Watson statistic). We estimate equation (6) in rolling windows of 365 daily observationsxvi. This rolling-window analysis (Leeflang et al. 2000, Swanson and White 1997) uses a data sample of fixed size, which allows direct comparisons between the estimates in different windows. Based on these rolling window tests, Pauwels and Hanssens (2007) classify performance regimes along two dimensions: the performance trend sign (up, insignificant or down), and the change in this trend (accelerating or decelerating). Ranked according to managerial desirability, these regimes are called accelerating growth (upward trend with accelerating trend change), saturating growth (upward trend with decelerating trend change), improving stability, lessening stability, decline turnaround and deteriorating decline.The interpretation of a stochastic trend (evolution) and its absence (stationarity) deserves further explanation. Stationarity or mean-reversion implies that all observed fluctuations are temporary deviations from deterministic components, which may include mean, trend and seasonal cycles (as in equation 6). Thus, if an unexpectedly large number of people sign up today, we would not change our expectation of the number of new subscribers tomorrow. In contrast, evolution implies that no mean-reversion occurs; i.e. the performance series may wander widely apart from any previously held position. Therefore, if a large number of people sign up today, this ‘shock’ substantially changes our expectation on the number of people that sign up tomorrow. In case of such positive evolution, the performance series has momentum, i.e. better performance today generates better performance tomorrow. The Augmented Dickey-Fuller test investigates the presence of a stochastic trend as follows:
Δ yt = γ yt-1 + δt + α +
∑
βi dyt-i + = p i1∑
= 7 2 j λj DoWj + γ Holiday + εt (7) With d yt the first difference of the series, and the number of lags p selected by the Bayesian Information Criterion (Hamilton 1994). The deterministic time trend is added to isolate the stochastic trend (Enders 2003), and the seasonal dummies provide good size estimates of the Dickey-Fuller test in seasonal series (Ghysels et al. 1994). The coefficient of interest is γ; the t-statistic testing γ = 0 is the Dickey-Fuller test for a unit root (evolution) against a trend-stationary alternative. The critical value for this test specification at the 5% significance level is -3.41; t-statistics below this value indicate trend-stationarity, t-statistics above this value indicate evolution. Again, we estimate equation (6) in rolling windows of 365 daily observations to investigate the stochastic trend across time periods and relate it to the timing of the move from free to fee.The results of our timing analysis are informative. Granger Causality tests
provided no evidence that the move from free to fee was caused by daily changes in new free subscriptions, so we proceed with our analysis of trends in new free subscriptions. Figure 5 shows the rolling-window test result for the deterministic trend coefficient, focusing on the period before and right after the move from free to fee (January 1, 2004).
---- Insert Figure 5 about here ----
Throughout 2003, new free subscriptions are growing (positive trend), with accelerating growth in Fall 2003. However, December 2003 sees a decline of the
deterministic trend estimate; representing the ‘saturating growth’ regime in Pauwels and Hanssens (2007). Consistent with literature (e.g. Schendel et al. 1976, Pauwels and Hanssens 2007), management takes a major decision (the move from free to fee) when the deterministic trend estimate is declining; i.e. when the growth prospects from the traditional advertising income model are diminishing. Further tests confirm that the move from free to fee is affected by the rolling-window trend estimate and that the effect is negative (i.e. the trend decline significantly influences the move from free to fee). Afterwards, we observe a further dip in the trend estimate, reflecting the loss of (potential) free subscriptions quantified in our VARX-analysis.
Figure 6 show the rolling-window test results for the stochastic trend t-statistic (with values below -3.41 indicating stationarity, and above -3.41 indicating evolution).
---- Insert Figure 6 about here ----
The stochastic trend analysis both confirms the deterministic trend assessment and highlights another aspect of the move’s timing. First, the stochastic trend’s t-statistic also declines in December 2003; the month before the move from free to fee. As a result, new free subscriptions are loosing their classification as an evolving series, and thus the ability to permanently benefit from a temporary subscription boost. Such change has been observed for the growth in online news consumers in Spain, marking the stabilization of consumer penetration and thus the need to tap other sources of growth for firms (Pauwels 2001). The move from free to fee (January 1st 2004) shows up as a return to the unit root classification, as it represents a structural break in the series. Second, in contrast to previous work on growing brands (Bronnenberg et al. 2000), we do not observe positive evolution from the start of our dataset. Instead, new free subscriptions are initially classified as stationary, which changes only in Spring 2003. Thus, it appears that the performance series had gained “momentum” (ibid) before management decided to move from free to fee. We note that this influx of new free subscriptions increases the
consumer value of joining the site, which enables (free and paid) users to exploit the joint expertise of the full installed base. This may be an important reason for the revenue success of the move for this particular company: it succeeded in first creating (in Spring
2003) and then monetizing the positive evolution in new free subscriptions. We speculate that the paid subscriber gains are lower and the free subscriber losses higher for
companies who attempt to make the move before momentum in free subscriptions has materialized. Evidently, data on such companies are needed to provide empirical evidence in this regard.
Conclusions and avenues for future research
The current research aims to start filling an important gap in empirical research: when companies decide to move from free to ‘fee & fee’, what role do marketing actions play in the free- and fee-user response and what sources of revenue loss may offset the paid subscription revenue gains? While this is prevalent for online content, it is likely relevant for many other marketing contexts where users become accustomed to enjoying a product or service for free. Our analysis points specifically to the nature of the trade-offs firms face. First, moving from free to fee has consequences for firm’s advertising revenue from free subscribers. The empirical results show that the move itself (plausibly through restriction of free content) slows down the growth of free users directly and reduces the effectiveness of marketing communication in generating new free users. Management expected the former, but not the latter, which it is not readily revealed by inspection of the raw data even after the move. In our empirical application, the revenue loss appeared minor: about 2 percent of the paid-subscriber revenue. Interestingly, the majority of this loss is due to the targeted email blasts by the content provider, aimed at convincing potential subscribers to commit to paid contracts. It appears that ‘content should be free’ is still a powerful slogan on the Web; while companies are trying to get surfers used to paying for content, other services, such as Congoo.com are actively encouraging them to get past the “pay wall.”
With subscription fees now the major revenue component, the power of marketing actions to stimulate paid subscriptions becomes critical. Various marketing actions
stimulate potential users to adopt specific pricing formats. In particular, price promotions are more effective in stimulating subscriptions for short contracts (in our case monthly contracts) than for long contracts (in our case yearly contracts). This finding is consistent with theoretical arguments that short contracts allow such users to try out at minimal
commitment, diagnose the extent to which the content is useful, and thus facilitate their adoption decision (Rogers and Shoemaker 1971).
In contrast to price promotions, both emails and search-engine referrals are more effective in generating new yearly subscriptions. Especially the latter came as a surprise to management, who suspected that the same-page display of competing content
providers in search engine results would reduce the commitment of subscribers gained though this route. However, this result is consistent with the notion that long-term commitments are riskier than short-term commitments because they involve a greater immediate economic investment. Prior research indicates that in conditions where outcomes are risky, individuals look for cues suggesting risk is minimal. One such cue is the credibility of the content provider, which may be derived through the search engine acting as a third party (Chu and Chu 1994). Likewise, the emails provide specific information on content, which tends to reduce perceived risk.
Finally, our moving window trend analyses revealed that the move from free to fee occurred about a year after new free subscriptions became an evolving variable, and about a month after its growth showed signs of saturation. The former is consistent with management intuition that the content site has picked up momentum in signing on new users, which gave them the confidence to consider different ways of monetizing user interest. While such momentum may thus give the opportunity to make the move from free to fee, the saturation in growth may have indicated the necessity to start adding subscription revenues. More generally, we speculate that (1) the success of the move from free to fee depends on the perceived content value of the site, which is indicated by momentum in free subscribers, and (2) management’s decision to execute the move is more likely when this growth saturates. We note though that ‘saturating growth’ is still a relatively favorable regime in the framework of Pauwels and Hanssens (2007), which observe that packaged good manufacturers tend to wait with dramatic changes until their performance is clearly in decline. Thus, management of small company in a growth industry appears to act more proactively than managent in established companies and mature industries (Schendel et al. 1976).
The current paper has investigated one company, though representative of the US online content industry, so further studies are needed to establish whether our findings
generalize to other content providers and other countries. In particular, since the online provider we analyzed appears to have successfully migrated to a paid content, it is useful to consider which factors drive these results. Consumer, competitive and company considerations may all play a role, as displayed in table 9.
---- Insert Table 9 about here ----
First, the customer base growth at the time of the move from free to fee matters. Our rolling window analysis revealed that the move occurred after the free subscription series showed a strong growth trend, aka ‘momentum’. Management believes their investment in search engine optimization well before the move from free to fee was a strong driver of subscription growth– and we indeed find permanent effects of search engine referrals. As a result, the fee subscription membership was marketed to a large and rapidly growing group of free subscribers. Other content providers may have made this switch too early, e.g. before a substantial free membership base was created, consistent with the difficulty faced by some of the earliest movers for fee based content. For instance, Microsoft entered the online magazine business with Slate, which
unsuccessfully tried to charge subscriptions and now exists as a free site. Second, the subscription-based nature of the industry may matter: while 97% of online business content is subscription as compared to single sales, this situation differs for other
categories such as online music and greeting cards. Customer reaction to the move from free to fee may well differ in transactional versus subscription-oriented markets. Finally, individual customer considerations include price sensitivity and the perceived value for free content and fee content, which are all likely to be heterogeneously distributed in the (potential) customer population.
Second, competition may be an important driver of the revenue results of moving from free to fee. Negative effects follow from a high perceived value of competitive content, and its overlap with the free and fee content of the focal company, whereas a high competitive price may actually benefit the focal company. Our data provider faces a large number of competitors, some with substantial financial resources, even within the niche of marketing content. Most of these competitors follow an advertising income model, and one competitor recently announced a subscription model at a price that is an order of magnitude higher than that in our data. Several price cuts followed, presumably
because of market resistance, whereas our content provider has succeeded in upgrading many consumers to higher price levels. It is unclear whether our empirical results of net revenue gains would generalize to situations with different focal firm position (e.g. marginal versus dominant player), substantially more versus fewer major competitors and their choice of free versus for-fee content.
Finally, the company’s marketing-mix decisions may exert an important influence on the revenue outcome of moving from free to fee. Our results already point to the loss in free subscribers due to marketing actions aimed at converting free into paying
subscribers. Second, the small loss in new free subscriptions may be due to the content restriction decision: our content provider restricted only a portion (approximately 1/7) of the content and maintained a steady flow of interesting free content. Third, the price structure and level should matter: our data provider focuses on winning long-term (yearly) contracts and charges a yearly price close to the industry average for online business content. In contrast to the above-mentioned competitor, the focal company managed to maintain prices while growing paid subscriptions. More research is needed to confirm and operationalize the recommendation that, “the key is for companies
[providing Internet services] to set realistic fees and then gradually raise them” (USA Today 2002). Fourth, the growth in paid subscriptions is fairly well explained by several model variables such as search engine referrals and email advertising, which are widely used. However, the extent to which these are effective depends, in large part, to how well they are executed. In addition, firms use various other techniques to move free users to paid users, such as non-price promotional offers and advertising based “day-passes”, which our content provider does not employ, and these can be the subject of future research. Finally, other possible reasons for our content provider’s success include its effectiveness at hiring the right people to manage the transition and to manage the resulting cash flows.
In sum, as compared to the results for our data provider, we would expect lower revenue benefits for companies that (1) make the move from free to fee before
momentum in free subscriptions has materialized, (2) set prices too high compared to consumer willingness-to-pay for their content, (3) are up against a dominant competitor with better (perceived) content and/or lower price levels, (4) charge fees for all
(previously free) content and (5) fail to ramp up marketing communication efforts and execute them effectively.
Aside from the generalizability conditions, we note several areas for future research. First, our proxy ‘search engine referrals’ should be replaced with marketing control variables that drive this outcome variable. Data limitations also prevent us from analyzing the actions of competing content providers and their effects on the focal company, a situation typical for these kinds of company data sets. Moreover, we do not have usage data, which would allow us to assess whether the move from free to fee also reduced the frequency with which free users visits the site, and the number of pages they view. Likewise, we lack data on renewal and switch patterns for online content providers. As to our modeling approach, its focus on the aggregate level precludes an analysis of customer heterogeneity (e.g. in willingness to pay for content); an important area for future research. Finally, our models are reduced form, and thus the long-run impact calculations are subject to the assumption that the basic data-generating process does not change. While this is appropriate for “innovation accounting,” i.e., an account of what happened with the move from free to fee within our data sample (Franses 2005; van Heerde, Dekimpe, and Putsis 2005), the modeling approach is not suited for revealing structural aspects of customer and firm behavior.
A great deal of marketing research has examined how customers react to pricing when they have a reference price greater than zero. This has been valuable to our understanding of how customers react to products and services they expect to pay for. However, it is possible that future generations may expect certain products and services, especially those delivered by the Internet, to be free, and thus have a reference price of zero. As content providers on the Internet have found, this is a daunting possibility. Future researchers can help illuminate how to move people from free to fee. This research is just a first step in that direction.
References
Abraham, Magid M. and Leonard M. Lodish (1987),”Promoter: An automated promotion evaluation system”, Marketing Science, 6(2), 101–123.
Ailawadi, Kusum L., Donald Lehmann and Scott Neslin (2001), “Market response to a Major Policy Change in the Marketing Mix: Learning from Procter & Gamble’s Value Pricing Strategy”, Journal of Marketing, 65(1), 44-61.
Ariely, Dan and Kristina Shampan’er (2004),”Tradeoffs betweens costs and benefits: Lessons from “the price of 0.” Working paper, MIT, Cambridge, MA.
Bakos, Yannis and Erik Brynjolfsson (2000),”Bundling and competition on the Internet”, Marketing Science, 19(1), 63–82.
Bawa, Kapil and Robert Shoemaker (2004),”The effects of free sample promotions on incremental brand sales”, Marketing Science, 23(3), 345–363.
Brehm, Jack W (1966), A Theory of Psychological Reactance, Academic Press, NY. Bronnenberg, Bart J., Vijay Mahajan, and Wilfried Vanhonacker (2000),“The Emergence of Market Structure in New Repeat-Purchase Categories: The Interplay of Market Share and Retailer Distribution,” Journal of Marketing Research, 37 (February), 16–31.
Brynjolfsson, Erik, Yu Hu and Michael D. Smith (2003),”Consumer surplus in the digital economy: Estimating the value of increased product variety at online booksellers”, Management Science, 49(11),1580–1596.
Bucklin, Randolph E. and Catarina Sismeiro (2003),”A model of Web site browsing behavior estimated on clickstream data”, Journal of Marketing Research, 40(3), 249–267.