Study on the coverage,
functioning and consumer
use of comparison tools and
third-party verification
schemes for such tools
Final report prepared by ECME
Consortium
(in partnership with DELOITTE)
contract with the Consumers, Health and Food Executive Agency (CHAFEA) acting under the mandate from the European Commission. The content of this report represents the views of the contractor and is its sole responsibility; it can in no way be taken to reflect the views of the European Commission and/or CHAFEA or any other body of the European Union. The European Commission and/or CHAFEA do not guarantee the accuracy of the data included in this report, nor do they accept responsibility for any use made by third parties thereof.
Contents
PageExecutive summary
xiii
1
Introduction and background
37
2
Methodology
39
2.1 Mapping and evaluation of comparison tools 40
2.1.1 Identification of comparison tools 40
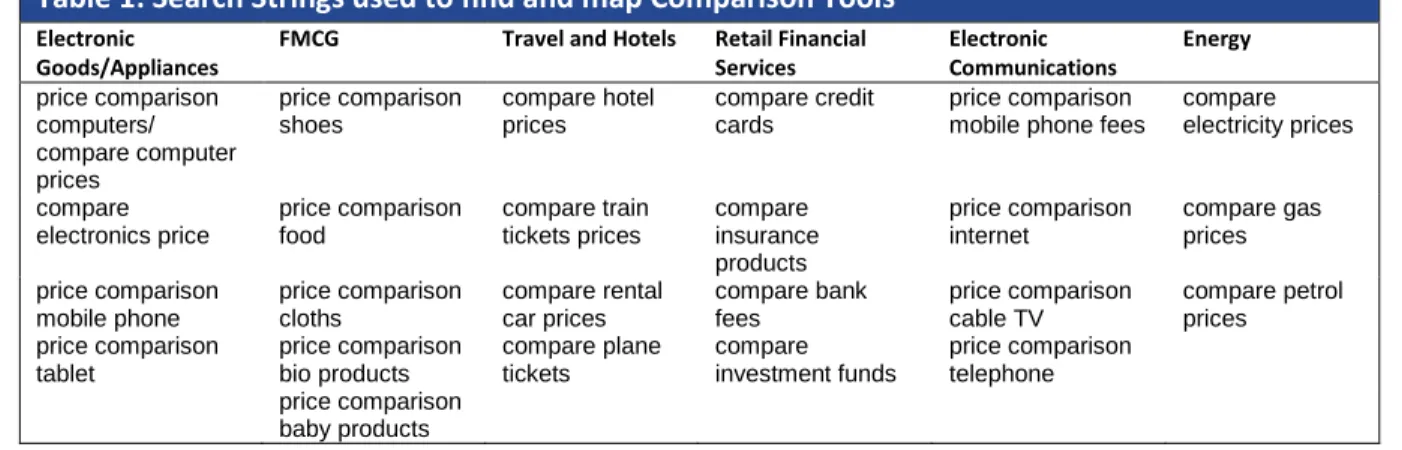
2.1.2 Notes on search strings 41
2.1.3 Evaluation of the comparison tools 41
2.1.4 Limits to the approach to the evaluation of the comparison tools 45 2.2 Methodology for mapping Third-Party Verification Schemes 45 2.2.1 Mapping and analysis of Third-Party Verification Schemes 46 2.2.2 Limits of the evaluation of Third-Party Verification Schemes 46
2.3 Methodology for consultation with stakeholders 46
2.4 Methodology of the consumer survey 47
2.5 Behavioural experiments 56
2.5.1 Experiment 1 56
2.5.2 Experiment 2 59
2.5.3 Experiment 3 66
2.6 Methodology of the mystery shopping exercise 69
2.6.1 Markets and countries covered in the exercise 69
2.6.2 Type of research 69
2.6.3 Number of price comparisons websites and mystery shops 70
2.6.4 Supplier website visits 70
2.6.5 Personalised pricing 70
2.6.6 Analysis of the results of the mystery shopping exercise 71
3
General perception of comparison tools
72
3.1 Usage and perception of comparison tools 73
3.1.1 E-commerce shortfalls 76
3.1.2 Comparison tool shortfalls 78
3.2 Decision-making biases and consumer behaviour in the context of comparison tools 83
4
Mapping of comparison tools and third-party verification schemes
86
4.1 Results from the mapping exercise 86
4.1.1 Breakdown of multi-sector comparison tools by sector combination 89 4.1.2 What do these results tell us about the commercial aspects of comparison
tools? 91
Contents
Page4.1.4 Ranking values given on comparison tools 93
4.1.5 Important consumer information available on comparison tools 96
4.1.6 The great unknowns 97
4.2 Further analysis of comparison tool revenue streams and sourcing of data 99
4.2.1 Revenue streams 99
4.2.2 Sourcing of data 103
4.2.3 Summary 105
4.3 Mapping and evaluation of comparison tool third-party verification schemes 107
4.3.1 Trustmarks for e-commerce websites 107
4.3.2 Sector and national initiatives to create third-party verification for comparison
tools 110
4.3.3 European initiatives to create third-party verification of comparison tools 112
4.3.4 Mapping of third-party verification schemes 114
4.3.5 Description of third-party verification schemes 116 4.3.6 Stakeholder perspectives of third-party verification schemes 124
4.3.7 Summary 133
5
Consumer perception and use of comparison tools
135
5.1 Awareness, frequency of use and motivations 135
5.1.1 Online purchasing 135
5.1.2 Awareness of comparison tools 139
5.1.3 Ways of getting informed about comparison tools 140
5.1.4 Frequency of using comparisons tools 142
5.1.5 Types of products/services for which comparison tools were used 144
5.1.6 Reasons for using comparison tools 146
5.1.7 Reasons for not using comparison tools 148
5.2 Consumer pathway to comparison tools 150
5.2.1 Online purchase intentions 150
5.2.2 Experiment 1 analysis 153
5.2.3 Results for the electricity sector 154
5.2.4 Results for the travel sector 166
5.3 Characteristics of importance for consumers 176
5.3.1 Most important characteristics of comparison tools 176
5.3.2 Observations from experiment 2 177
5.4 Consumer’s perception of comparison tools 186
5.4.1 Type of comparisons tools used 186
Contents
Page5.4.3 Consumers’ experiences when using comparison tools 191
5.4.4 Users’ perception of comparison tools 195
5.4.5 Most appropriate way to protect consumers when using comparison tools 198 5.5 Understanding and impact of third-party verification schemes 201 5.5.1 Characteristics that should be guaranteed by verification schemes 201 5.5.2 Most suitable organisation to run verification schemes 202 5.5.3 Most suitable organisation to run comparison tools 203 5.5.4 Observations from experiment 2 on the impact of verification schemes 204 5.6 Impact of comparison tools on purchasing decisions 214 5.6.1 Impact of comparison tools on the online purchase intention 214
5.6.2 Observations from experiment 3 215
6
Practical functioning of comparison tools and shortcomings identified
229
6.1 Feedback from consumers on main problems encountered 231 6.1.1 Types of problems encountered when using comparison tools 231
6.1.2 Consumer’s response when experiencing an issue 232
6.1.3 Reasons for not taking any actions to solve the issue encountered 233
6.2 Results of the mystery shopping 234
6.2.1 Business model and compliance with existing legislation 234
6.2.2 Accessibility and user-friendliness 244
6.2.3 Ranking and search functions 248
6.2.4 Quality of information provided 267
6.2.5 Personalised pricing 271
7
EU consumer law and comparison tools
273
7.1 List of applicable consumer protection legislation and official guidance documents 273
7.2 General Remarks on applicability 275
7.2.1 Business/trader 275
7.2.2 Public bodies 276
7.2.3 Consumer organisations 277
7.3 Horizontal measures 278
7.3.1 Unfair Commercial Practices Directive (+Guidance on UCPD – 2009) 278 7.3.2 Consumer Rights Directive and the Guidelines to the Directive (2014) 280 7.3.3 Misleading and Comparative Advertising Directive 281
7.3.4 E-Commerce Directive 281
7.3.5 Price Indication Directive 282
Contents
Page7.4 Vertical measures and sectoral legislation 283
7.5 Summary 286
8
Study conclusions and recommendations
288
8.1 Comparison of findings with MSDCT recommendations 288
8.2 Overall study recommendations 297
Annex 1: Consumer Survey - Sample Profile 304
Annex 2: Behavioural experiment 329
Tables, Figures and Boxes
PageTables
Table 1: Search Strings used to find and map Comparison Tools 41 Table 2: Evaluation Values used for Comparison Tools 43
Table 3: Country and language 49
Table 4: Country and panel 50
Table 5: Sample size 51
Table 6: Fieldwork dates 52
Table 7: Average survey time 53
Table 8: Information about weighting (EU28) 55 Table 9: Distribution of review statuses across link positions 58 Table 10: Distribution of generic texts across link positions 59 Table 11: Design Third-party verification, both sectors 63 Table 12: Design ranking options, electricity sector 65 Table 13: Design ranking options, hotel sector 65 Table 14: Number of CTs evaluated (number of evaluations in brackets) 70 Table 15: Number of unique pairs of e-commerce sites and CTs (number of evaluations in brackets) 71 Table 16: Most important criteria to improve Comparison Tools(N= 41) 82 Table 17: Comparison Tools offering comparisons in combined sectors 90 Table 18: Data gathering methods described by CT operators 105
Table 19: European trustmarks 109
Table 20: Third-party verification schemes in Europe 115
Table 21: Suggested criteria 129
Table 22: Shares choosing a link as first choice, electricity sector 155 Table 23: Results of conditional logit regression of first choice link, electricity sector 157 Table 24: Predicted likelihood that a link is chosen, electricity sector 159 Table 25: Results of logit regression of first or second choice link, electricity sector 159 Table 26: Predicted likelihood that a link is chosen as first or second choice, electricity sector 160 Table 27: Shares choosing a link as first choice by position and type, electricity sector, EU15 162 Table 28: Shares choosing a link as first choice by position and type, electricity sector, EU13 163 Table 29: Questions to construct the comparison website familiarity score 164 Table 30: Shares choosing a link as first choice, travel sector 166 Table 31: Results of conditional logit regression of first choice link, travel sector vs. electricity sector 168 Table 32: Results of conditional logit regression of first choice link, travel sector 169 Table 33: Predicted likelihood that a link is chosen, travel sector 170 Table 34: Results of logit regression of first or second choice link, travel sector 171 Table 35: Predicted likelihood that a link is chosen as first or second choice, travel sector 172 Table 36: Shares choosing a link as first choice, hotel sector, EU15 countries 173 Table 37: Shares choosing a link as first choice by position and type, hotel sector, EU13 174 Table 38: Design sort options, electricity sector 178 Table 39: Design sort options, travel sector 179
Tables, Figures and Boxes
PageTable 40: Share choosing each site under different sort option treatments, electricity sector 179 Table 41: Share choosing each site under different sort option treatments, hotel sector 183 Table 42: Share strongly agreeing with various statements about comparison tools (by country) 193 Table 43: Characteristics of comparison tools, % “good” (scores 1-3) (by country) 197 Table 44: Experiment design third-party verification, energy and hotel sector 206 Table 45: Share choosing each site under different verification treatments, electricity sector 206 Table 46: Share choosing each site under different third party verification treatments, travel sector 210 Table 47: Correlations between electricity deal attributes 221 Table 48: Effect on proportion that chose an electricity deal by sort method 221 Table 49: Results of conditional logit regression of first deal choice, electricity sector 223 Table 50: Correlations between hotel deal attributes 225 Table 51: Effect on proportion that chose a hotel deal by sort method 225 Table 52: Results of conditional logit regression of first deal choice, hotels sector 227 Table 53: Business information: Results by market 235 Table 54: Business information: Results by country 236 Table 55: Contact or business information found on CTs 237
Table 56: Source of income 237
Table 57: Where did advertising appear? 238
Table 58: Information provided: Results by market 239 Table 59: Information provided: Results by country 239 Table 60: Information on coverage: Results by market 240 Table 61: Information on coverage: Results by country 241 Table 62: Cross-border offers: Results by market 241 Table 63: Cross-border offers: Results by country 242 Table 64: Updating prices: Results by market 242 Table 65: Updating prices: Results by country 243 Table 66: E-commerce accreditation overview 243
Table 67: Ownership type overview 244
Table 68: "I have the feeling that I can trust this CT." 247 Table 69: "This PCW was easy to use." 247 Table 70: "This CT was easy to navigate." 247 Table 71: "It was easy to compare offers on this CT." 247 Table 72: "The provided quote on this CT was accurate according to the chosen parameters." 248 Table 73: "The provided quotes covered a satisfactory part of what is available on the market." 248 Table 74: "My overall impression of the CT was very positive." 248 Table 75: Ratings and customer reviews: Results by market 249 Table 76: Information on ratings and customer reviews: Results by market 249 Table 77: How were the reviews controlled? 250 Table 78: Broadband internet: When starting search, can input details on... 250 Table 79: Car insurance: When starting search, can input details on... 251 Table 80: Electricity: When starting search, can input details on... 252
Tables, Figures and Boxes
PageTable 81: Flat screen TV: When starting search, can input details on... 253 Table 82: Hotel: When starting search, can input details on... 254 Table 83: Perfume: When starting search, can input details on... 255 Table 84: Summary of initial list of quotes: Results by market 255 Table 85: Ranking and ordering options: Results by market 256 Table 86: Broadband internet: Default ranking based on... 257 Table 87: Car insurance: Default ranking based on... 257 Table 88: Electricity: Default ranking based on... 257 Table 89: Flat screen TV: Default ranking based on... 258 Table 90: Hotel: Default ranking based on... 258 Table 91: Perfume: Default ranking based on... 259 Table 92: Broadband internet: Reordering options 259 Table 93: Car insurance: Reordering options 260
Table 94: Electricity: Reordering options 260
Table 95: Flat screen TV: Reordering options 261
Table 96: Hotel: Reordering options 261
Table 97: Perfume: Reordering options 262
Table 98: Filtering options: Results by market 262 Table 99: Broadband internet: Filtering options 263 Table 100: Car insurance: Filtering options 263
Table 101: Electricity: Filtering options 264
Table 102: Flat screen TV: Filtering options 265
Table 103: Hotel: Filtering options 266
Table 104: Perfume: Filtering options 266
Table 105: Additional restrictions and costs for first 5 quotes: Results by market 267 Table 106: The selected product: Results by market 268 Table 107: Starting the application process: Results by market 269 Table 108: Additional restrictions and costs in the application: Results by market 269 Table 109: Comparison with supplier site: Results by market 270 Table 110: Price comparison CT versus supplier website: Results by market 270 Table 111: Multi-stakeholder dialogue on comparison tools report recommendations 288 Table 112: Frequency that links were shown to participants, electricity sector 329 Table 113: Frequency that links were chosen, electricity sector 329 Table 114: Correlations between links attributes, electricity sector 330 Table 115: Results of conditional logit regression of first choice link, electricity sector, EU15 330 Table 116: Results of logit regression of first or second choice link, electricity sector, EU15 330 Table 117: Results of conditional logit regression of first choice link, electricity sector, EU13 332 Table 118: Results of logit regression of first or second choice link, electricity sector, EU13 332 Table 119: Frequency that links were shown to participants, hotel sector 334 Table 120: Frequency that links were chosen, hotel sector 334 Table 121: Correlations between links attributes, hotel sector 335
Tables, Figures and Boxes
PageTable 122: Results of conditional logit regression of first choice link, hotel sector, EU15 335 Table 123: Results of logit regression of first or second choice link, hotel sector, EU15 countries 335 Table 124: Results of conditional logit regression of first choice link, hotel sector, EU13 countries 337 Table 125: Results of logit regression of first or second choice link, hotel sector, EU13 countries 337 Table 126: Number of participants to encounter third party verification options, electricity sector 339 Table 127: Number of participants to encounter third party verification options, hotel sector 339 Table 128: Number of participants per sort method/deal set, electricity sector 339 Table 129: Number of participants per sort method/hotel set, travel sector 339
Figures
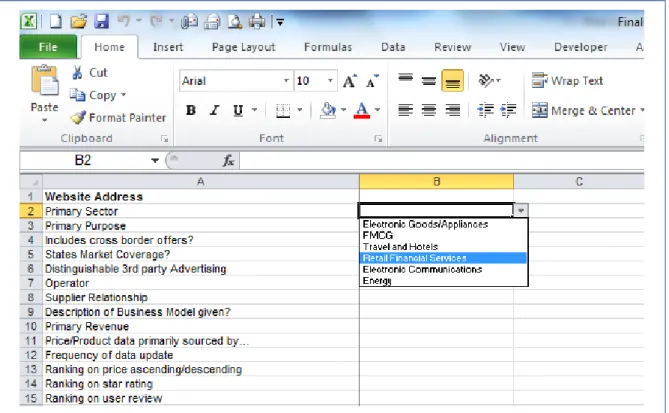
Figure 1: Example of pull-down menus adjacent to the evaluation criteria in the evaluation tool 42 Figure 2: Example experiment screen search results page, electricity 57 Figure 3: Example screen shot selection of comparion tool, electricity sector 60 Figure 4: Example screen shots of third-party verification 62 Figure 5: Example ranking options, electricity sector 64
Figure 6: Energy sector example screen 67
Figure 7:Products/Services that Price Comparison websites are used for (source: Consumer Futures) 73 Figure 8: Complaints received in relation to CTs? 75 Figure 9: Percentage of stakeholders with a positive perception of CTs 76 Figure 10: Main reason for most recent complaint relating to e-commerce (2009) 77 Figure 11: Does the reliability of CTs need improvement? (N= 46) 82 Figure 12: Breakdown of Price Comparison Websites per country 87 Figure 13: Multinational and mobile comparison tools 88 Figure 14: Comparison tool breakdown by sector 89 Figure 15: Comparison tool breakdown by operator according to the mapping exercise 92 Figure 16: Comparison tool website breakdown by services offered 93 Figure 17: Comparison tool website breakdown ranking values 94 Figure 18: Comparison toll website default rankings 94 Figure 19: Mobile Apps breakdown of ranking values 95
Figure 20: Mobile App default rankings 95
Figure 21: Provision of information on Comparison Websites 96 Figure 22: Provision of information on Mobile Apps 97 Figure 23: Background information on Comparison Tool Websites 98 Figure 24: Background information on Mobile Comparison Tools 98 Figure 25: Business model identified during mapping activities 102 Figure 26: Business model identified during the consultation (N= 52) 103 Figure 27: Third-party verification offers value to consumers (N= 49) 125 Figure 28: Third-party verification adding value to CT operators (N= 75) 125 Figure 29: Should a standardized EU third-party verification scheme be introduced? (N= 72) 126 Figure 30: Appropriate type of schemes (N= 46) 127 Figure 31: Mandatory criteria that should apply to participate in the verification scheme (N= 42) 128
Tables, Figures and Boxes
PageFigure 32: How to fund Third-Party Verification schemes (N= 41) 130
Figure 33: Penalty methods (N= 42) 131
Figure 34: Verification schemes should offer information about customer rights? (N= 47) 131 Figure 35: European Commission Involvement (N= 57) 132
Figure 36: Frequency of online shopping 136
Figure 37: Products/services bought online 137 Figure 38: Average number of different products/services bought online 138
Figure 39: Awareness of comparison tools 139
Figure 40: Ways of getting informed about comparison tools 140 Figure 41: Ways of getting informed about comparison tools (by country) 141 Figure 42: Frequency of using comparison tools (among all consumers) 142 Figure 43: Frequency of using comparison tools (among comparison tools users) 143 Figure 44: Types of products/services for which comparison tools were used 144 Figure 45: Types of products/services for which comparison tools were used (by country) 145 Figure 46: Average number of different products/services for which comparison tools were used 146 Figure 47: Main reasons for using comparison tools 147 Figure 48: Main reasons for using comparison tools (by country) 148 Figure 49: Main reasons for not using comparison tools 149 Figure 50: Purchasing behaviour (online vs. offline) 150 Figure 51: Type of research done before purchasing online 152 Figure 52: Share of consumers who searched using a price comparison website 153 Figure 53: Predicted likelihood that a link is chosen, electricity sector 158 Figure 54: Predicted likelihood that a link is chosen as first or second choice, electricity sector 160 Figure 55: Share that choose an advert/link carrying a review as their 1st choice, electricity sector 161 Figure 56: Shares chosing links in each position, electicity sector, EU15 and EU13 162 Figure 57: Additional share chosing each link when it carried a review, electicity sector, EU15/EU13 163 Figure 58: Average comparison website familiarity score by country 165 Figure 59: The effect of reviews and adverts on link choice for countries by comparison site
familiarity, electricity sector 165
Figure 60: Predicted likelihood that a link is chosen, travel sector 170 Figure 61: Predicted likelihood that a link is chosen as first or second choice, travel sector 172 Figure 62: Average share to choose an advert link and reviewed link as first choice, travel sector 173 Figure 63: The effect of reviews and adverts on link choice for countries by comparison site
familiarity, hotel sector 175
Figure 64: Most important characteristics of comparison tools 177 Figure 65: Average share that chose the comparion tool site that offered the most ranking options
by country, electricity sector 182
Figure 66: Average share that chose Site 3 by country, hotel sector 185 Figure 67: Type of comparison tools used most recently 187 Figure 68: Type of comparison tools used most recently (by country) 187 Figure 69: Functionalities of different types of comparison tools 189 Figure 70: Functionalities of different types of comparison tools (by country) 190
Tables, Figures and Boxes
PageFigure 71: Agreement and disagreement with various statements about comparison tools 192 Figure 72: Characteristics of comparison tools 196
Figure 73: Way of protecting consumers 199
Figure 74: Way of protecting consumers (by country) 200 Figure 75: Most important characteristics that should be guaranteed by verification schemes 202 Figure 76: Most suitable organisation to run verification schemes 203 Figure 77: Most appropriate organisation to run comparison tools 204 Figure 78: Average share that chose a site with verification across countries, electricity sector 208 Figure 79: Average share that chose a consumer body, Industry operator or public authority verified
site across countries, electricity sector 209 Figure 80: Average share that chose a site with verification across countries, hotel sector 212 Figure 81: Average share that chose a consumer body, industry operator or public authority verified
site across countries, hotel sector 213
Figure 82: Frequency that using a comparison tool results in a purchase 215 Figure 83:Example electricity deals presented to a participant 218 Figure 84: Example electricity deals presented to participants including an optimal deal 219 Figure 85: Proportion of participants that chose the best electricity deal as their first choice 220 Figure 86: Effect of ranking method on choice of optimal deal EU13 and EU15, electricty sector 223 Figure 87: Proportion of participants that chose the best hotel deal as their first choice 224 Figure 88: Effect of ranking method on choice of optimal deal EU13 and EU15, hotels 228
Figure 89: Frequency of problems 231
Figure 90: Main problems encountered 232
Figure 91: Consumers’ response when being faced with a problem 233 Figure 92: Reasons for not doing anything to solve the issue 234 Figure 93: Mystery shoppers’ evaluations on information provided 245 Figure 94: Mystery shoppers’ general impressions of the CT 246 Figure 95: Predicted likelihood that a link is chosen, electricity sector, EU15 331 Figure 96: Predicted likelihood that a link is chosen as first or second choice, electricity sector, EU15 331 Figure 97: Predicted likelihood that a link is chosen as first choice, electricity sector, EU13 333 Figure 98: Predicted likelihood that a link is chosen as first or second choice, electricity sector, EU13 333 Figure 99: Predicted likelihood that a link is chosen as first choice, hotel sector, EU15 336 Figure 100: Predicted likelihood that a link is chosen, hotel sector, EU13 336 Figure 101: Predicted likelihood that a link is chosen as first or second choice, hotel sector, EU13 337 Figure 102: Predicted likelihood that a link is chosen as first or second choice, hotel sector, EU13 338
Boxes
Box 1: Summary of main findings – General perceptions of comparison tools 72 Box 2: Summary of main findings – Mapping of comparison tools and terification schemes 86 Box 3: Accreditation or scheme owner and description 116 Box 4: Summary of main findings – Awareness, frequency of use and motivations 135 Box 5: Summary of main findings – Consumer pathway to comparison tools 150
Tables, Figures and Boxes
PageBox 6: Summary of main findings – Characteristics of importance to consumers 176 Box 7: Summary of main findings – Consumers’ perceptions of comparison tools 186 Box 8: Summary of main findings – Understanding and impact of verification schemes 201 Box 9: Summary of main findings – Impact of comparison tools on purchasing decisions 214 Box 10: Summary of main findings – Practical functioning of comparison tools 229 Box 11: Summary of main findings – EU consumer law and comparison tools 273
Glossary
Member State codes
BE Belgium BG Bulgaria CY Cyprus HR Croatia CZ Czech Republic DK Denmark DE Germany EE Estonia EL Greece ES Spain FR France IE Ireland IS Iceland IT Italy CY Cyprus LV Latvia LT Lithuania LU Luxembourg HU Hungary MT Malta NL Netherlands AT Austria PL Poland PT Portugal RO Romania SI Slovenia SK Slovakia FI Finland SE Sweden UK United KingdomExecutive summary
In March 2013 the Report from the Multi-Stakeholder Dialogue on Comparison Tools1 was presented at the European Consumer Summit. The report highlighted challenges and shortcomings in the functioning of comparison tools, particularly with regards to the transparency and impartiality of comparisons, the quality of information provided, the comprehensiveness and user-friendliness of comparison tools, the reliability of user reviews, consumer redress and enforcement of existing provisions.
In September 2013, Ipsos, London Economics and Deloitte were commissioned to conduct a study on the comparison tool sector in order to:
Explore consumer behavioural patterns in the use of comparison tools and their influence on consumers’ decision-making;
Conduct an extensive mapping exercise of the comparison tools available in the EU accompanied by a survey on consumer perception and experience of comparison tools (analysis by sector and by country);
Carry-out an analysis of existing accreditation and trustmark schemes for comparison tools;
Highlight how improvements can be made to ensure comparison tools are reliable, transparent and user-friendly and benefit consumers.
Methodology
The following tasks were carried out by the Ipsos, London Economics and Deloitte team:
Mapping and evaluation of comparison tools was carried out across the EU28 plus Norway and Iceland. A total of 1042 comparison tools across seven sectors were identified (electronic goods, fast moving consumer goods, energy, travel and hotels, retail financial services, electronic communications and multi-sector tools).
Mapping and evaluation of third-party verification schemes was also carried out across the EU28 plus Norway and Iceland. Nine third-party verification schemes specifically for comparison tools were identified: five were UK-based, and one each in France, Italy, Belgium and Ireland.
169 consultations, in total, were completed with comparison tool operators, industry bodies, regulators and consumer groups. These consultations were implemented using questionnaires distributed directly to the stakeholder groups across each of the 30 countries included in the study.
A consumer survey covering the 28 EU member States as well as Norway and Iceland was carried out. The survey was conducted online in the countries where online penetration is sufficient to ensure a good representation of the target population. It was administered using an online methodology in 26 of the 28 Member States, Norway and Iceland. In Cyprus and Malta, the survey was conducted using a computer aided telephone interviewing (CATI) method. The survey included a standard online questionnaire which lasted 10 minutes on average both online and via telephone. In total, 21,361 respondents completed the survey.
1
Comparison Tools: Report from the Multi-Stakeholder Dialogue:
An online behavioural experiment in 15 countries: Romania, Sweden, the United Kingdom, France, Denmark, Germany, Latvia, Italy, Slovenia, Hungary, Poland, the Netherlands, Greece, the Czech Republic and Croatia. The experiment tested (a) consumer choice of a comparison tool at the initial online search stage using a mock search engine; (b) consumer choice of a comparison tool from a short list; and, (c) consumer choice of a product or service on an individual comparison tool. The experiment was framed for the electricity sector and travel sector (hotels), and was run in conjunction with the consumer survey. In total, 12,000 respondents completed the experiment.
A mystery shopping exercise in 11 countries: the Czech Republic, France, Germany, Greece, Hungary, Italy, the Netherlands, Poland, Romania, Sweden and the United Kingdom. The aim of the mystery shopping exercise was to replicate, as closely as possible, real consumers’ experiences when it comes to comparing prices on price comparison websites in six different markets. Across the six markets, a total of 440 comparison tools were evaluated. Comparison tools, i.e. websites and search engines featuring price comparison and user-generated online reviews, play an increasingly important role in EU consumers’ decision-making. These tools come under various different names, for example, comparison tools are also known as aggregators, price comparison agents, shopping agents, and shopping robots (or shopbots for short)2. In this document, we will refer to them as comparison tools or price comparison websites, and these terms should also be understood as encompassing other aggregator services3 that provide some form of comparison functions other than price.
Key findings
Our study has made the following key findings:
General perception of comparison tools
Comparison tools are well established in the market, having grown considerably in number since the 1990s, and are frequently used by consumers.
Comparison tools are generally well perceived and considered an asset to consumers, and this perspective is shared by all stakeholders in the market to a greater or lesser extent.
Some shortfalls in the comparison tools sector are a result of overall shortfalls in the EU e-commerce sector, including barriers to cross-border trade, ability to develop certain comparison tool sectors or minimum market size.
However, the stakeholder survey shows there are some specific concerns in relation to comparison tools, although the overall reported incidence of consumer detriment to authorities and consumer organisations appears to be low.
Specific consumer detriments which have been highlighted include low levels of transparency regarding business model, how comparison tools actually make their revenues, frequency of price updates, as well as accessibility issues.
Full price publication, accuracy of offers and a guarantee of impartiality were considered to be the areas in most need of improvement by stakeholders.
2 Zhu, H., Madnick, S., Siegel, M. (2007) ‘Enabling Global Price Comparison through Semantic Integration of Web Data’, MIT Sloan School
Working Paper 4673-07, MIT Sloan School of Management.
3
Mapping of comparison tools and third-party verification
In the mapping exercise, a total of 1042 comparison tools across seven sectors were identified; the largest share of comparison tools were active in the travel/hotel sector (26%), followed by the retail finance sector (17%). Another 18% of comparison tools were labelled as “multi-sector” tools because they covered multiple sectors.
Comparison tool ownership and operation is overwhelmingly private sector-based across the EU (84% of tools identified in the mapping exercise); for 10% of comparison tools the operator could not be identified.
Comparison tools have a diverse range of business models and revenue streams, and in many cases comparison tools combine traditional revenue streams (advertising and commission) with newer forms of revenue (switching services).
However, less than half (37% - 45%) of comparison tools were willing to disclose details on their supplier relationship, description of business model or the sourcing of their price and product data (e.g. whether from the supplier or gathered independently from web sources). This lack of transparency is further amplified for smartphone apps.
Only 12% to 18% of websites disclosed information on the market coverage they enjoyed, their primary revenue or the frequency by which their data was updated.
On average, a majority of comparison tool operators update their data sources more than daily (51%), while a minority update their data daily (29%) or less than daily (20%).
Verification schemes are either guideline, code of conduct or accreditation based; with accreditation being the most rigorous.
Stakeholders are generally in favour of third-party verification, but also believe it should be coordinated at EU level.
Consumer perception and use of comparison tools
Awareness, frequency of use and motivations
40% of the consumers surveyed for this study said they had a good knowledge of comparison tools, while 48% had heard of such tools but were not really familiar with them. A minority had never heard of comparison tools. The proportion of consumers “knowing comparison tools quite well” ranged from 10% in Iceland to 55% in the UK.
Internet search engines were by far the most important source of information to learn about comparison tools (mentioned by 72%).
In total, 74% of consumers had used comparison tools – at least once – in the past 12 months; the highest proportions were observed in Slovakia (77%), Poland, Italy (both 78%), the Czech Republic (79%) and the UK (83%).
22% of consumers had used comparison tools at least once every two weeks in the past 12 months, 17% had used them once a month, 9% every two months and 25% once every three months or less frequently.
Comparison tools were mainly used to compare prices of electric or electronic appliances (mentioned by 63% of comparison tool users). A significant number of users also used comparison tools to compare price for plane or train tickets (43%) and hotel rooms (37%).
Comparison tool users used these tools because they offered them a quick way to compare prices (mentioned by 69%) and allowed them to find the cheapest price (68%).
47% of consumers who had not used comparison tools said they only bought products or services from websites they already knew, 34% compared prices across several websites they knew, and 36% preferred using general search engines rather than comparison tools.
Consumer pathways to comparison tools
Before making their most recent online purchase, 63% of comparison tool users surveyed had used a general search engine and 48% a price comparison website to find out more about the product/service they were planning to buy.
Consumer selection of comparison tools from online search engines is significantly influenced by link position on the search results page as shown by the first behavioural experiment. The higher positioned a link the more likely it is selected. For example, a first placed natural link was chosen almost twice as frequently as the second placed natural link.
Reviews also have an important effect on comparison tool selection. In the experiment, links that carried a review were chosen more than twice as frequently as those with no review. The higher a review rating (in terms of a star rating system) and the greater the number of reviews, the more effective was the review in increasing the likelihood a comparison tool was selected. Respondents that reported they were more familiar with comparison tools tended to choose links with reviews more than those who were less familiar.
On average, links that were presented as an advert were selected less frequently than those presented as natural links. However, adverts were still chosen by experiment respondents a substantial number of times, implying that paid-for links are an important pathway to comparison tools.
Characteristics of importance for consumers
By far the most valued characteristic of comparison tools was the price comparison aspect (mentioned by 79% of comparison tool users). 29% of comparison tools users also paid attention to easiness to navigate, while somewhat lower numbers attached importance to factors such as the use of user ratings/peer messaging (21%) and information about the product/service (21%).
Characteristics, such as the description of the business model or the provision of information on redress, were not considered very important by comparison tool users; for example, just 4% attached importance to the way the comparison tool is funded and 1% looked for information on redress.
When choosing between alternative comparison tool sites, sites that offered the consumer multiple ranking options were preferred in the experiment. Respondents tended not to choose sites that only offered a default ranking, but instead selected sites with between one to three additional ranking options.
Consumers’ perceptions of comparison tools
Price comparison websites were the most popular type of comparison tools among consumers surveyed; 73% of comparison tool users had used them recently. Search engines, however, were also important (48% had used them recently as comparison tool).
Although virtually all users agreed that price comparison tools allowed customers to compare prices, just 34% said they could also be used to find unbiased product information.
A very different result was found for search engines, while just 38% of users agreed they could be used to compare prices, almost twice as many (66%) said they could be used to find unbiased product information. A majority of users (62%) answered that multi-trader e-commerce platforms were mainly dedicated to buying products.
Vast majorities of consumers agreed that price comparison websites are the quickest way to compare prices (in total, 90% agreed), are easy to use (87%), are useful to find out information about specific products/prices (84%) and are useful to find customer comments or product reviews (79%). Nonetheless, not all perceptions were positive; 79% of consumers agreed that different price comparison websites showed different prices for the same product/service.
Among users of comparison tools, those thinking that such tools helped consumers save money or time or those agreeing that these tools helped consumers to make informed purchasing decision largely outnumbered those stating the opposite. A different picture emerged when asked about comparison tools’ transparency with regards to relationships with retailers featured (23% “bad” scores vs. 18% “good” scores).
EU13 respondents were more likely to emphasize positive characteristics of comparison tools; for example, while 38% of comparison tool users in the EU13 thought that these tools were reliable, this proportion dropped to 22% in the EU15. Comparison tool users in Cyprus, the Czech Republic, Malta and Slovakia had overall the most positive perception about comparison tools.
Understanding and impact of verification schemes
27% of consumers surveyed strongly agreed, and 48% somewhat agreed, that they trusted comparison tools more when they were affiliated with a third-party verification scheme.
Among respondents who reported that affiliation to a third-party verification scheme was one of the most important characteristics they looked for in comparison tools,
o 42% said that third-party verifications schemes should guarantee the impartiality of the comparison, and 28% thought they should guarantee the accuracy of the information presented.
o 59% thought that verification schemes should be run by a consumer organisation and 26% said that a national authority/regulator would be more appropriate.
When respondents in the experiment were offered the choice between comparison tools that carried no verification and ones that did, the sites that carried verification schemes were selected 3.5 times more often than the ones that did not.
In line with the findings of the consumer survey, respondents in the experiment tended to select sites that had verification provided by a public authority or consumer body over those that carried verification schemes provided by an industry body.
Verification schemes that included more extensive requirements were on average selected more often than those with lighter requirements.
Impact of comparison tools on purchasing decisions
35% of comparison tool users answered that the use of a comparison tool usually resulted in a purchase; just 8% said they rarely or never bought anything after using a comparison tool.
The experiment found that the ranking method and the product position on a comparison tool impacts consumer product choice.
o The sorting method used by comparison websites has an impact on the proportion of respondents in the experiment that selected the best deal. In the case of electricity, 79% and 76%, respectively, chose the best deal under the price sorting method and customer service method, compared to 49% when deals were sorted randomly. For travel, when deals were sorted by price and guest rating, 81% and 78% chose the best deal available compared to when deals were sorted randomly.
o The position of a deal on a webpage has a significant impact on the likelihood that the deal is chosen. The higher up the page a deal is placed the more likely it is chosen by participants.
o The way in which deals are ranked on a webpage has an effect on consumers’ choice of product. The proportion of participants that chose the cheapest electricity offer when the deals were sorted by annual cost was 29%. This compares to 22% or less when deals were sorted by other methods. The same is found for hotels. When hotels were ordered by lowest price a larger proportion of participants selected the cheapest room (39%) than when offers were ordered in any other way.
o When electricity deals were sorted by rate type (fixed rate deals at the top and flexible rate deals at the bottom), 65% of participants chose a fixed rate deal compared to 60% or less when deals were sorted in another way.
o For hotels, when rooms were ordered by guest score, 65% of participants chose the deal with highest guest score compared to 59% or less when ordered in another way.
o The effect of a given characteristic is found to be larger if deals are sorted according to that characteristic. For example, when electricity deals are ranked by annual cost then annual cost has a larger effect on first deal choice compared to when deals are ranked according to alternative methods (customer service, rate type, energy type or randomly).
Practical functioning of comparison tools and shortcomings identified
Feedback from consumers on main problems encountered
65% of users of price comparison tools surveyed had experienced at least one problem when using such tools; this figure ranged from 48% in the Netherlands to 83% in Greece.
The most commonly reported problem was the unavailability of a product on the seller’s website (32%); the problem was followed by issues with incorrect prices (21%) and incorrect product information (18%).
54% of these users who had experienced a problem decided to do nothing about it, 27% contacted the seller of the product and 17% the comparison tool provider or customer help. 39% of respondents who had done nothing about the problem encountered were convinced their action would have led to no result.
Mystery shopping
Business model and compliance with existing legislation
A majority of the mystery shoppers found information on the owner of the comparison tool; this figure varied from 63% for comparison tools dealing with perfumes to 78% for those dealing with broadband internet.
Comparison tools did not appear keen to divulge details on how they generated income; the proportion of shoppers finding information on income-generation remained below 37% across all markets. This is consistent with the mapping exercise.
11% of mystery shoppers could not find any contact details on the comparison tool that they evaluated.
Only 34% of the comparison tools surveyed provided information on how to file a complaint. Out of those, 34% contained a link to an ADR body or provided contact details on how to contact the ADR body.
28% of mystery shoppers reported that the website they evaluated contained a quality label or verification mark; 44% of shoppers found a “code of conduct” on the site and 30% a glossary to explain the main words and phrases.
In most markets, less than half of comparison tools identified the number of providers compared (e.g. 24% of comparison tools dealing with perfumes and 20% for flat screen TVs).
37% of comparison tools surveyed provided offers from abroad, with a large disparity across sectors (96% of comparison tools for hotels provided offers from abroad but only 7% of those comparing broadband offers did so – this difference can of course be explained by the – mostly – national nature of some sectors).
Although comparison tools seem rather diligent in their updating of prices (see mapping exercise), just 15% of them contained information on how the prices were updated; the highest rate was observed for comparison tools dealing with flat screen TVs (24%), while the lowest rate was found for comparison tools dealing with car insurances (7%).
Websites with a quality label generally scored better than non-accredited ones on most of the indicators measured; for example, a shopper of a website with a quality label was more likely to find information on the owner of the site (77% vs. 69%), how the site generates income (37% vs. 27%) or how to file a complaint (45% vs. 29%).
Ranking and search options
Customer reviews and ratings of providers/products were more common in some markets (e.g. hotel prices), but more rare in others (e.g. broadband internet and car insurances). Where reviews or ratings appeared, there was usually no explanation provided on how they were controlled.
A minority of comparison tools explicitly mentioned that customer reviews were controlled. Among these comparison tools, 45% explained that the site itself had the possibility to edit a review and 14% mentioned that the seller, trader or hotel had the possibility to react on a review. Another 37% of these comparison tools explained that reviews were controlled via a system of user accounts, 24% asked for contact details and 23% for a proof of payment.
None of the markets were particularly good at explaining how the initial list of quotes had been ordered; the worst performing comparison tools were found in broadband internet
and car insurance markets, where only 20%-22% of shoppers were notified about the ranking criteria used.
52% of search results were initially presented in price order; this figure, however, masks a large variation across markets (from 89% for comparison tools dealing with car insurances to 31%-34% for comparison tools dealing with perfumes, hotels and flat screen TVs).
There was also a lot of variability between the markets in terms of consumers being given the opportunity to reorder the initial search results, ranging from 36% for comparison tools dealing with car insurances to 89% for those dealing with hotels.
The proportion of comparison tools that offered consumers the possibility to filter the list of quotes on specific parameters varied from 33% for comparison tools dealing with car insurances to 85% for those dealing hotels.
Quality of information provided
68% of shoppers agreed that complete and detailed information was available on the comparison tool to start the purchasing process and 66% agreed that they had sufficient information to feel comfortable proceeding with the purchase, had they been a real customer.
When looking for the exact same product/booking and its price on the supplier website, 58% of comparisons showed no price difference between the supplier website and the comparison tool, 15% of shoppers reported that the product/booking was offered at a higher price on the supplier and 10% found a lower price on the supplier site. Finally, 18% of shoppers were not successful in finding the exact same product/booking or its price on the supplier website.
Personalised pricing
In the electric and electronic appliance sector, mystery shoppers also completed an exercise on personalised pricing. The aim of this exercise was to test whether e-commerce sites adapt their pricing according to the characteristics of the shopper.
Some proof was found that routing via a price comparison site affected the price of a product listed on the e-commerce site (this affected 7% of shoppers).
Little proof was found that the geographic location from where the consumer accessed the e-commerce site had an impact; 19% of mystery shoppers, however, could not complete this exercise due to issues when using a proxy server to access the e-commerce site.
87% of shoppers found the same price at two different points in time, 5% reported a price difference and 7% could not complete the exercise because they could no longer find the product or its price at the second point in time.
Legal analysis
There are at least 14 applicable items of consumer protection legislation and official guidance documents pertaining to Comparison Tools.
In the absence of a single legislative instrument governing this area, the regulatory coverage can lack coherence and be confusing to consumers and traders.
There are both horizontal and vertical (sectoral) legal instruments and initiatives which can be used to regulate the industry.
The application of the law depends on the status of the Comparison Tool operators, with commercial firms being the most heavily regulated. While it is possible to envisage public bodies and consumer organizations as potentially covered by consumer law, which would depend on their operation of the comparison tool (i.e. whether as an economic undertaking or a social function), the position is uncertain at the moment. An important distinction between social and economic (business) functions of these public bodies and consumer organizations needs to be considered.
The Unfair Commercial Practices Directive (UCPD) is the most crucial legislative measure in the Comparison Tool environment.
Articles 6, 7.1 and 7.2 of the UCPD suggest that Comparison Tools should display full prices, as well as provide information regarding their business model and any links with suppliers whose goods or services they feature.
Recommendations for comparison tools
Based on the findings of this study, the following list of recommendations for comparison tools has been drawn up. These recommendations encompass criteria that comparison tools should respect to improve their transparency, reliability and user-friendliness towards consumers. The recommendations are intended for all comparison tool operators regardless of technology, platform or primary business model (e.g. including search engines, multi-trader platforms, and apps as well as traditional comparison tool websites).
Transparency and impartiality:
1. Transparency about the business model: Comparison tools should be transparent about their business and financing models, including owners, shareholders and relationship with manufacturers, sellers or providers of the goods and services featured.
2. Impartiality of the comparisons: Comparison should be impartial and not be affected by any contractual relationship with the sellers, manufacturers or providers.
3. Sourcing of the data: Comparison tools should clearly explain the way in which they source data as well as the frequency with which it is updated. The time of the last update should be specified.
4. Criteria for ranking: Criteria used for the rankings should be clearly and prominently indicated, as well as, where relevant, any specific methodology used.
5. Information on coverage: Where realistic and practical, comparison tools should specify the coverage of the comparison in terms of sectors, number of sellers and geographical scope, particularly in the case of markets such as energy and communications which are often highly concentrated. However, this may not be practical for comparison tools who sell goods which are widely available or in highly diverse markets.
6. Authenticity of user reviews and user ratings: Comparison tools should take measures to ensure the authenticity of user reviews and ratings, and disclose the methodology used. Sellers should have the possibility to react to reviews and authors should be asked their consent before any review which does not violate the law or the comparison tool terms of use is removed.
7. Distinction of advertising: Any form of advertising should be explicitly marked as such and separated visually from the results. This includes sponsored user reviews and paid-for ranking.
8. Affiliation to verification schemes: Comparison tools which are members of schemes should declare the affiliation and display a logo, including a link to conditions of membership.
Type, quality and display of the information:
9. Relevance of the information: Information provided by comparison tools should be relevant for assessing and comparing offers from a consumer perspective. It should be written in simple language, avoiding complex legal and technical terms. This information should be layered.
10. Comparability: Comparison tools should display the same information in a uniform manner to ensure comparability. When the products or services are not identical, differences in their characteristics should be clearly mentioned.
11. Accuracy of the information: Comparison tools should ensure that the information displayed is exact, and that data is updated frequently and that errors are rectified immediately, to the extent possible.
12. Information on prices: Comparison tools should publish the full and final purchase price including any applicable charges, taxes etc. in accordance with existing legal obligations – and where such obligations do not apply, to the extent possible. Full prices, particularly those which may enter into force for services after any discounts, should also be clearly stated with full prominence.
13. Terms of purchase: Main terms of purchase should be specified, including availability, delivery time, main contract terms and special clauses etc.
14. Personalisation of the comparison: Comparison tools should always give the consumers the option to switch to view a ranking of offers in order of ascending price if this is not the default ranking. Comparison tools should aim at including multiple evaluation criteria to allow for a comprehensive comparison of products and services. They should integrate modifiable settings as well as search, filtering and simulation functions so consumers can satisfy personal preferences.
15. User-friendliness: Comparison tools should strive to employ a user-friendly and simple to use interface. Comparison results should be displayed on a single page if permissible. 16. Accessibility to the most vulnerable: Comparison tools should incorporate features that
make them more accessible to the vulnerable, the disabled and the elderly, for instance by following existing international guidelines or standards on accessibility.
Compliance and redress:
17. Display of contact details: Comparison tools should display contact details for consumers, including telephone number, address and email.
18. Compliance with existing legislation: Comparison tools should comply with existing consumer protection legislation, including those specific to the sectors they cover, as well as data protection legislation.
20. Access to redress mechanisms: Comparison tools should provide consumers with information on available redress mechanisms.
Recommendations for the Commission and Member States
21. An increase in coordinated enforcement of the relevant pieces of legislation on comparison tools, both at national and EU level, is required. To achieve a sustainable impact the objective of more and better enforcement, the issues pertaining to comparison tools should be put on the radar of enforcers, complaints of consumers should be collected, and sweeps (including at EU level in a coordinated way) on comparison tools should be undertaken.
22. To facilitate enforcement of existing legislation as well as fairness in application, the Commission should communicate how the existing legislation applies to comparison tools. The focus should notably be on the Unfair Commercial Practices Directive, but appropriate application of other instruments should also be considered.
23. To complement the existing legislative framework and highlight best practices, other guidance as necessary should be developed at EU level regarding comparison tools involving all stakeholders including the comparison tool industry.
24. Co-regulation, facilitated by the European Commission, should be considered between the comparison tool sector, consumer organisations, retailers, manufacturers and enforcers to develop a memorandum of understanding (MoU) or a Code of Conduct which formally develops, enshrines and adopts best practices in the comparison tool sector.
25. Comparison tool operators should agree to develop EU-wide verification schemes, drawing on agreed best practices and in particular dovetailing with the work of organisations currently involved in similar pan-European initiatives.
26. The value of existing schemes that already exist at national level should be recognised as best practices. All stakeholders should work together to see that such schemes and new initiatives develop in line with the recommendations in this report and any action developed at EU level.
27. Where public authorities decide to establish their own comparison tools, these comparison tools should be at the forefront of best practices adoption and promotion. 28. The private comparison tool industry should organise itself at EU level in order to fully
engage with stakeholders and policy makers and work with these groups to shape the standards for the comparison tool industry as well as assist in their refinement and adoption.
29. An awareness raising campaign on comparison tools should be conducted to inform consumers of how to best engage with comparison tools, what they should understand and what rights they have in relation to their transactions with comparison tools.
Synthèse
Le ‘Report from the Multi-Stakeholder Dialogue on Comparison Tools’4 a été présenté au Sommet européen de la consommation (European Consumer Summit) en mars 2013. Le rapport soulignait les défis et les manquements dans le fonctionnement des outils de comparaison, plus particulièrement en ce qui concerne la transparence et l’objectivité des comparaisons, la qualité de l'information fournie, la compréhensibilité et la convivialité des outils de comparaison, la fiabilité des avis des utilisateurs, les mécanismes de recours dont disposent les consommateurs et l’application des dispositions existantes.
En septembre 2013, Ipsos, London Economics et Deloitte ont été chargés de mener une étude sur le secteur des outils de comparaison en vue de :
Étudier les schémas de comportement des consommateurs dans le cadre de l’utilisation d’outils de comparaison et leur influence sur le processus décisionnel des consommateurs ;
Réaliser un exercice de cartographie étendu des outils de comparaison disponibles dans l’UE, accompagné d’une étude sur la perception des outils de comparaison par les consommateurs et sur l’expérience qu’ils ont de ces outils (analyse par secteur et par pays) ;
Effectuer une analyse des programmes existants d’accréditation et de labellisation pour les outils de comparaison ;
Indiquer comment procéder à des améliorations en vue de garantir la fiabilité, la transparence et la convivialité des outils de comparaison au profit des consommateurs.
Méthodologie
Les tâches suivantes ont été exécutées par l’équipe Ipsos, London Economics et Deloitte :
Les outils de comparaison ont été cartographiés et évalués dans l’UE des 28 plus la Norvège et l’Islande. Un total de 1.042 outils de comparaison à travers sept secteurs ont été identifiés (produits électroniques, produits de grande consommation, énergie, voyages et hôtels, services financiers de détail, communication électronique et outils multisectoriels).
Les programmes de vérification par une tierce partie ont également été cartographiés et évalués dans l’UE des 28 plus la Norvège et l’Islande. Neuf programmes de vérification par une tierce partie propres aux outils de comparaison, ont été identifiés : cinq programmes étaient basés au Royaume-Uni. La France, l’Italie, la Belgique et l’Irlande comptaient chacune un programme.
Un total de 169 consultations ont été réalisées avec des opérateurs d’outils de comparaison, des organismes sectoriels, des régulateurs et des groupes de consommateurs. Ces consultations ont été réalisées par le biais de questionnaires distribués directement aux groupes de parties prenantes dans chacun des 30 pays inclus dans l’étude.
Une étude couvrant les 28 États membres de l’UE ainsi que la Norvège et l’Islande, a été réalisée auprès des consommateurs. Cette étude a été menée en ligne dans les pays dans lesquels une pénétration en ligne est suffisante pour garantir une bonne représentation de la population cible. Elle a été menée par le biais d’une méthodologie en ligne dans 26 des 28
4 Comparison Tools: Report from the Multi-Stakeholder Dialogue:
États membres, en Norvège et en Islande. À Chypre et à Malte, l’étude a été menée par le biais d’entretiens téléphoniques assistés par ordinateur (CATI). L’étude comprenait un questionnaire en ligne standard d’une durée d’environ 10 minutes et ce, aussi bien en ligne que par téléphone. Au total, 21.361 répondants ont rempli le questionnaire.
Une expérience comportementale dans 15 pays : Roumanie, Suède, Royaume-Uni, France, Danemark, Allemagne, Lettonie, Italie, Slovénie, Hongrie, Pologne, Pays-Bas, Grèce, République tchèque et Croatie. L’expérience se rapportait (a) au choix d’un outil de comparaison par le consommateur au stade de la recherche en ligne initiale via un moteur de recherché simulé ; (b) au choix d’un outil de comparaison par le consommateur à partir d’une liste d’outils présélectionnés ; et, (c) au choix par le consommateur d’un produit ou service à partir d’un outil de comparaison individuel. L’expérience a été conçue pour le secteur de l’électricité et le secteur des voyages (hôtels), et a été menée conjointement avec l'étude auprès des consommateurs. Au total, 12.000 répondants ont participé à l’expérience.
Un exercice d’évaluation mystère dans 11 pays : République tchèque, France, Allemagne, Grèce, Hongrie, Italie, Pays-Bas, Pologne, Roumanie, Suède et Royaume-Uni. Le but de l’exercice d’évaluation mystère était de reproduire le plus fidèlement possible les expériences réellement vécues par les consommateurs en matière de comparaison de prix sur des sites Web comparateurs de prix dans six marchés différents. Un total de 440 outils de comparaison ont été évalués à travers les six marchés.
Les outils de comparaison, c’est-à-dire les sites Web et les moteurs de recherche proposant des comparaisons de prix et des avis en ligne générés par les utilisateurs, jouent un rôle de plus en plus important dans le processus décisionnel des consommateurs européens. Ces outils se présentent sous différents noms. Les outils de comparaison sont par exemple également connus en tant qu’agrégateurs, agents de comparaison de prix, agents d’achat et robots d’achat (ou shopbots en abrégé)5. Nous y ferons référence dans ce document en tant qu’outils de comparaison ou sites Web comparateurs de prix. Ces termes doivent également être compris comme englobant d’autres services d’agrégateur6 offrant des fonctions de comparaison autres que le prix.
Principaux résultats
Notre étude a mis en évidence les résultats suivants :
Perception générale des outils de comparaison
Les outils de comparaison sont bien ancrés dans le marché, leur nombre a considérablement augmenté depuis les années 1990 et ils sont fréquemment utilisés par les consommateurs.
Les outils de comparaison sont généralement bien perçus et considérés comme un atout par les consommateurs, ce point de vue étant partagé par toutes les parties prenantes du marché dans une plus ou moins grande mesure.
Certains manquements dans le secteur des outils de comparaison résultent de manquements généraux dans le secteur de l’e-commerce européen, y compris les obstacles au commerce transfrontalier, la capacité de développer des outils de comparaison dans des secteurs spécifiques ou la taille de marché minimale.
5 Zhu, H., Madnick, S., Siegel, M. (2007) ‘Enabling Global Price Comparison through Semantic Integration of Web Data’, MIT Sloan School
Working Paper 4673-07, MIT Sloan School of Management.
6