Retirement and Physical Activity
Analyses by Occupation and Wealth
Sukyung Chung, PhD, Marisa E. Domino, PhD, Sally C. Stearns, PhD, Barry M. Popkin, PhD
Background:
Older adults close to retirement age show the lowest level of physical activity. Changes in
lifestyle with retirement may alter physical activity levels. This study investigated whether
retirement changes physical activity and how the effect differs by occupation type and
wealth level.
Methods:
This longitudinal study used the Health and Retirement Study (1996 –2002), U.S.
population-based data. Analyses were conducted in 2007 and 2008. Physical activity was
measured by a composite indicator of participation in either work-related or leisure-time
physical activity. Fixed-effects regression models were used to account for confounders and
unobserved heterogeneity. The dependent variable was a composite indicator of
partici-pation in regular physical activity either at work or during nonworking hours.
Results:
Physical activity decreased with retirement from a physically demanding job but increased
with retirement from a sedentary job. Occupation type interacted with wealth level, with
the negative impact on physical activity of retirement exacerbated by lack of wealth and the
positive effect of retirement on physical activity enhanced by wealth.
Conclusions:
Substantial differences in the effect of retirement on physical activity occurred across
subgroups. As the number of people approaching retirement age rapidly increases,
findings suggest that a growing segment of the nation’s population may not sustain an
adequate level of physical activity.
(Am J Prev Med 2009;36(5):422– 428) © 2009 American Journal of Preventive Medicine
Introduction
P
hysical activity has a large number of important
effects on adult health, yet 60% of older
Ameri-can adults are physically inactive.
1–10Because a
large percentage of adults live 20 years or more after
retirement, it is important to understand how
retire-ment affects physical activity.
Retirement may provide both opportunities and
bar-riers for maintaining recommended levels of physical
activity. Retired people may have more time to allocate
to leisure activities such as walking and sports
partici-pation. However, reduced disposable income and the
loss of social contact may prohibit retirees from
partic-ipating in some leisure and social activities that are
largely physical in nature.
11The overall direction of
change in physical activity level with retirement is
ambiguous a priori.
Another complicating issue in predicting the effect
of retirement on physical activity relates to the varying
levels of physical demand across pre-retirement
occu-pations. The potential positive effect of retirement due
to increased leisure time may be reduced or reversed
for retirees from physically demanding occupations.
For these people, work-related activities may have
re-quired higher levels of physical demand than
leisure-time physical activities, and thus retirement potentially
reduces the overall physical activity level.
Wealth level may also interact with the effect of
retirement on physical activity in multiple ways. People
who have higher wage rates and are likely to be
wealthier may experience a substantial decline in
op-portunity cost of time with retirement, and thus may be
more motivated to engage in physical activity after
retirement. Wealthier people also have more financial
resources to support leisure activities after
retire-ment.
12Conversely, a lack of wealth could limit
par-ticipation in physical activities that were deemed
unaffordable.
To date, surprisingly few studies have investigated the
effect of retirement on physical activity, and none have
examined how the effect differs by occupation type and
wealth level. Findings of three previous studies
13–15are
inconclusive. One analysis
13that used cross-sectional
data from a United Kingdom study of white-collar
From the Palo Alto Medical Foundation Research Institute and Phillip R. Lee Institute for Health Policy Studies, University of California, San Francisco (Chung), San Francisco, California; the Department of Health Policy and Management (Domino, Stearns), and the Carolina Population Center and Department of Nutrition (Popkin), The University of North Carolina at Chapel Hill, Chapel Hill, North Carolina
Address correspondence and reprint requests to: Sukyung Chung, PhD, 795 El Camino Real, Ames Building, Palo Alto CA 94301. E-mail:chungs@pamfri.org.
workers found that leisure-time physical activity
de-creased as working hours inde-creased. Another study,
14conducted longitudinally in four communities in the
U.S. with a 6-year follow-up, showed an increase in
exercise participation among people who were not
continuously employed during the follow-up compared
to those who were continuously employed. A study
15conducted in the Netherlands used longitudinal data
with a 13-year follow-up and reported mixed findings,
concluding that retirement reduced physical activity
from work-related active transportation but increased
leisure-time physical activity. It is not clear, however,
whether the inconsistent findings arise from the
differ-ent sample represdiffer-entations or from varying definitions
of physical activity and retirement.
To further explore the effect of retirement on
par-ticipation in physical activity, this study addressed the
gap in the literature in several ways. First, physical
activity in this study encompassed both work-related
and leisure-time physical activities. Moderate activities,
including occupation activity and housework, make up
the largest part of daily activities
16and produce health
benefits such as improved functional ability,
particu-larly among older adults.
17–19Second, the definition of
retirement in this study was based on current
work-ing hours and did not rely on self-defined retirement
status. Third, a longitudinal survey was used that
tracked individuals every 2 years and collected
compre-hensive health and economic information. The data
allowed adjustment for confounding factors and
indi-vidual heterogeneity that are potentially associated with
retirement and physical activity. Fourth, the study
sam-ple was nationally representative and consisted of
peo-ple near retirement age during the last decade. Thus,
the findings of this study can be generalized to the
national level and can inform policy affecting Baby
Boomers reaching retirement age. Finally, the effect of
retirement was allowed to vary across groups—rather
than treating as homogeneous diverse groups with
varying occupation types and wealth level—to identify
the highest-priority population for public health
interventions.
Methods
Data
Data came from the Health and Retirement Study (HRS), a nationally representative panel survey of older adults that was launched in 1992. The HRS sample used in the present study represents birth cohorts from 1931 to 1947. The baseline interview was conducted in the home; follow-up interviews were conducted every 2 years, mostly by phone. Baseline response rates were approximately 80%, and re-interview participation rates were 92%–95%. The data are publicly available through the HRS website (hrsonline.isr.umich.edu). This study used observations from Waves 3– 6 (1996 –2002) in which the wording of the question eliciting information on
physical activity was exactly the same (n⫽42,140 interview observations from 12,582 individuals). The analysis was con-ducted in 2007 and 2008. Because the physical activity ques-tion was substantially changed beginning in 2004, later waves were not used.
Exclusions consisted of people who defined themselves as homemakers or who had not worked for more than 1 year at baseline (n⫽6869 interview observations; 815 individuals) and people who were currently not working but were looking for a job (n⫽1252 interview observations; 298 individuals), leaving 34,019 observations from 11,469 individuals for anal-ysis. These exclusions were necessary because the objective was to identify the effect of retirement from work rather than the effect of not working for any reason. The potential misclassification problem of some retirees reporting them-selves as homemakers was explored by also combining home-makers into the retired category. To examine the potential impact of classification error, another model that combined the homemakers and retired categories was examined; this model produced a result similar to the sample without homemakers. The HRS used rigorous cross-wave validations and imputation methods for income and wealth information, so no further exclusions were needed because of incomplete data on covariates.
Among the 11,469 people in the analysis sample, 13% (n⫽1534) were lost to follow-up. Although these people were less likely to be retired at baseline, they did not differ in the likelihood of physical activity compared to those who partic-ipated in all follow-up interviews, after adjusting for demo-graphic factors and health conditions. Thus, bias is unlikely in the estimates from attrition.
Variables
Physical activity was measured by a dichotomous variable based on this question:On average over the last 12 months, have you participated in vigorous physical activity or exercise 3 times a week or more? By vigorous physical activity, we mean things like sports, heavy housework, or a job that involves physical labor.
Working status was dichotomized as either retired or work-ing for each wave-specific observation.Retiredincluded those who were currently not working for pay and defined them-selves as retired. Because the analysis sample excluded obser-vations for which working status could not be categorized as either retired or working (e.g., homemakers, people looking for a job), the referent was a homogenous group of current workers. This definition allowed for a reversible retirement status. In the study sample, a subsequent interview deter-mined that 710 (7%) participants had returned to the work-force after retirement during the study period (1996 –2002). A significant shift occurred from working status into retired status during the study period: At baseline, 30% of the sample was retired, compared to 43% at the latest interview.
Individuals in the HRS reported separately their job title and type of work for both the current occupation and the previous longest occupation. Based on this information, a representative occupation type was assigned, based on the Standard Occupational Classification System.20 Occupation
types were classified as either sedentary or physically demand-ing. The classification was based primarily on the physical demands of either the current or the latest occupation type before retirement. If the respondent was not working, or if current occupation information was missing for the entire
study period, the previous longest occupation type was used for the classification. Occupations were classified according to the associated strength factor as defined in the Dictionary of Occupational Titles.21Using this system, the termsedentary
jobpertains to occupations with strength factors of sedentary or light, and the term physically demanding job pertains to occupations with strength factors of medium, heavy, or very heavy. Examples of occupation types classified as sedentary includemanagerial specialty operationandclerical, administrative support; examples of physically demanding occupations in-clude food preparation service and mechanics and repair. An alternative approach based on the self-reported physical demands of the occupation was not used in classifying occu-pation types because the self-reported physical demands of jobs could be highly subjective and might reflect individuals’ preferences for physical activity rather than providing an objective measure of occupation-specific physical demands.
Two categories of wealth level were created using the median of household wealth at baseline as a cutoff. House-hold wealth included equity in primary housing, other non-financial assets, and non-financial wealth. Survey weights were used in calculating the median.
To adjust for health problems that may affect the decision to retire22,23 as well as the level of physical activity, eight
indicators of the most common health problems were in-cluded: hypertension; diabetes; cancer (excluding skin can-cer); lung disease; arthritis; stroke; heart disease (heart attack, angina, or congestive heart disease); and limitation in an activity of daily living (ADL; bathing, eating, dressing, walking across a room, and getting in or out of bed). All health problems were self-reported and defined for each 2-year wave. Variables indicating socioeconomic factors were defined as follows: Age in years was measured as a continuous variable. Four mutually exclusive categories of race/ethnicity (non-Hispanic white, black, (non-Hispanic, and other race) were used. Two dummy variables were used for educational attainment, indicating either less than high school or some college, with the referent of high school graduation. Indicators of marital status included divorced or separated, widowed, and never married, with a referent of married. Total household income was included as a continuous variable.
Analytic Methods
Multivariate regression analyses were conducted with the primary covariate of interest—retired—and other covariates representing health problems and relevant socioeconomic factors. To model participation in physical activity as an outcome, logistic and linear regressions were conducted. The two methods produced virtually the same results, so results from the linear regressions are reported for easier interpre-tation. Huber–White SEs with an adjustment for clustering on individuals were used for all regressions.
To select consistent estimates as well the most efficient ones, ordinary least square (OLS) estimates and fixed-effects estimates were compared. Fixed-effects models used within-person variation over multiple periods of time for the estima-tion. Specifically, participation in physical activity at the current interview (t) was compared to the average physical activity of the person over multiple waves (1–T) to identify the effect of independent variables on changes in physical activ-ity. The Hausman specification test24 showed that
fixed-effects models that account for unobserved individual
heter-ogeneity were preferred to OLS that uses only cross-sectional relationships (p⬍0.001). The fixed-effects regression results are reported hereafter.
The effect of retirement on physical activity by occupation type and wealth level was explored with subgroup analyses. To examine this, the sets of coefficients for the overall sample and for the subgroups were compared, using F-tests.25
Ac-cording to the F statistics, the equivalence of overall coeffi-cients between the two occupation groups in the combined sample was rejected (p⬍0.001). Therefore, the subgroup analysis was preferred to a single regression using an interac-tion term ofretirement*occupation typein a combined sample. Similarly, subgroup analysis by wealth level was preferred to a combined sample analysis with an interaction term (p⬍0.001).
Because the regressions controlled for many factors, estimates with survey weights (not reported) were very similar to those reported here. All the analyses were conducted using the Stata statistical program, version 10.
Results
Sample Characteristics
The majority of the study participants were women
(53%); non-Hispanic whites (74%); with high school or
some college education (76%); and married (75%).
The average age was 60 years, and the average
house-hold income was $64,921 during the study period
(
Table 1
). About one third (34%) of the observations
were classified as retired. Among the observations with
valid information on either current or previous longest
occupation type (n
⫽
33,099; 97% of analysis sample),
54% of participants had jobs classified as sedentary, and
46% had jobs classified as physically demanding.
Among the health conditions examined, almost half
(49%) of the participants reported having arthritis.
Hypertension (44%), heart disease (16%), and
diabe-tes (14%) were also common health problems.
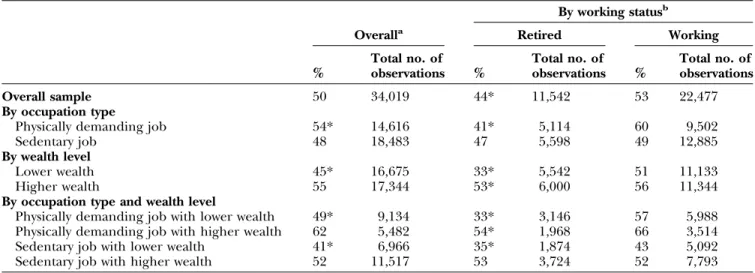
Physical Activity by Working Status
On average, 50% of people participated in regular
physical activity (
Table 2
). People who had worked or
were working at physically demanding jobs were more
likely to report participating in physical activity (54%)
than those in sedentary jobs (48%). People with higher
wealth were more likely to participate in physical
activ-ity (55%) than those with lower wealth (45%). All
differences were significant (p
⬍
0.01).
There was also an interaction effect between
occupa-tion type and wealth level. Among those who had
physically demanding jobs, people with higher wealth
were more likely to participate in physical activity than
people with lower wealth (62% vs 49%;
p
⬍
0.01).
Among those who had sedentary jobs, a similar
differ-ence was observed (52%: higher wealth vs 41%: lower
wealth;
p
⬍
0.01).
Retired people were less likely to participate in
regular physical activity (44%) than working people
(53%) in the overall sample (
p
⬍
0.01). The pattern was
consistent across all the subgroups defined by job type
and wealth level (
p
⬍
0.01) except for the sedentary-job
group (
p
⫽
0.07). The magnitude of the difference
between retirees and workers was much larger among
people who had or were working at physically
demand-ing jobs (19%) and among people with lower wealth
(18%) than among people with higher wealth (3%).
In the analyses of subgroups defined by both
occu-pation type and wealth status, retirees were less likely
than current workers to participate in physical activity,
with the exception of those with sedentary jobs and
higher wealth (
p
⫽
0.07). The difference in physical
activity between retirees and current workers was
larg-est (33% vs 57%) for those with physically demanding
jobs and lower wealth.
The Effect of Retirement on Physical Activity
After controlling for confounding factors and taking
account of unobserved heterogeneity using fixed
ef-fects, retirement did not have a significant effect on
physical activity in the overall sample (
Table 3
). Two
health conditions that may be disabling (stroke and
ADL limitation) were negative predictors of physical
activity. However, other health conditions that could be
associated with a lack of physical activity were not
significant predictors of physical activity. Physical
activ-ity declined significantly with increasing age.
Retirement did have an effect on physical activity in
certain subgroups, and this effect varied widely (
Table 4
).
Physical activity decreased with retirement from
physi-cally demanding jobs (a decrease of 7.5 percentage
points in the probability of participation;
p
⬍
0.01) but
increased with retirement from sedentary jobs (an
increase of 4.4 percentage points;
p
⬍
0.01). Physical
activity decreased with retirement among people with
lower levels of wealth (a decrease of 5.6 percentage
points;
p
⬍
0.01), but did not change with retirement
among people with higher levels of wealth (p
⫽
0.09).
Analyses of four subgroups defined by both
occupa-tion type and wealth status indicated an interacoccupa-tion
between occupation and wealth in how retirement
affected physical activity. For people in physically
de-manding jobs, physical activity decreased with
retire-ment only among those with a lower level of wealth (a
decrease of 10.4 percentage points;
p
⬍
0.01). For
peo-ple in sedentary jobs, physical activity increased with
retirement only among those with higher wealth (an
increase of 6.1 percentage points;
p
⬍
0.01).
Discussion
Substantial heterogeneity in the effect of retirement on
physical activity was found in groups defined by
occu-pation type. For retirees from physically demanding
occupations, retirement led to a decline in overall
physical activity level, suggesting that the loss of
work-related physical activity was not compensated by an
equivalent increase in leisure-time physical activity.
The role of wealth on the effect of retirement was
also striking. The likelihood of physical activity
partici-pation declined with retirement only in the
lower-wealth group, suggesting that heightened economic
constraints may have a greater impact on physical
activity than the increased availability of time during
retirement. Further, the wealth effect interacted with
occupation type, so that the negative effect of
retire-Table 1. Characteristics of Health and Retirement Studysample, 1996 –2002a Characteristics Frequencyb/ M (SD) DEMOGRAPHIC CHARACTERISTICS Age (years) 60.3 (4.78) Female 52.9 Race/ethnicity Non-Hispanic white 73.6 Black 16.1 Hispanic 7.9 Other race 2.2 Education ⬍High school 24.0 High school 41.8 Some college 34.2 Marital status Married 75.2 Divorced or separated 12.8 Widowed 8.9 Never married 3.0 Household income/$100K 0.65 (1.14)
MAIN INDEPENDENT VARIABLES
Retired 33.9
Health problems
Hypertension 44.3
Diabetes 13.5
Heart disease (angina, heart attack, heart failure)
15.8
Stroke 3.3
Lung disease 7.8
Cancer (except skin cancer) 8.6
Arthritis 49.3
Limitation in activity of daily living 9.1
SUBGROUPS
Occupation type of current or previous longest jobc
Sedentary 54.3
Physically demanding 45.7
Household wealth status (population median ($125K) as a cutoff)c
Higher wealth 51.3
Lower wealth 48.7
aStatistics are based on total wave-specific number of observations
(n⫽34,019) for time-varying characteristics. For time-constant person characteristics (including gender, race/ethnicity, and education cat-egory), statistics are based on the number of individuals (n⫽11,469).
bPercent unless otherwise noted
cThese two person-specific identifiers were used for subgroup
analy-sis. Statistics are based on the number of individuals (n⫽10,978 for occupation type;n⫽11,469 for wealth status).
ment from physically demanding jobs was exacerbated
by lower wealth, and the positive effect of retirement
from sedentary jobs was enhanced by greater wealth.
These findings suggest that existing disparities in
phys-ical activity by SES
26will widen as people retire.
Given the well-known health benefit of regular
phys-ical activity for older adults, the reduced physphys-ical
activity in retirement for this group may result in
disproportionately adverse health outcomes, which
could have important public health implications.
Sim-ilarly, a previous study
27showed that retirees from
physically demanding occupations were likely to gain
weight, while retirees from sedentary occupations did
not show a weight gain due to retirement. The data
used in that study also showed that the prevalence of
health problems associated with lack of physical activity
(e.g., diabetes, heart disease) was significantly higher
among retirees from physically demanding jobs than
among those from sedentary jobs (
Table 5
).
The role of wealth might be influenced by multiple
environmental factors favoring physical activity. Studies
on populations of varying ages show that SES is
associ-ated with environmental factors affecting an
individu-al’s physical activity, such as access to exercise facilities,
the availability of walking trails, and neighborhood
safety.
28 –30Pathways through which wealth affects the
physical activity of retirees merit further investigation to
better inform effective strategies to reduce the disparity
in their physical activity levels. Based on accumulated
evidence, public health policies may consider
increas-ing access to allow low-cost physical activity options,
such as walkable communities or public parks,
particu-larly in areas with a high concentration of lower-income
older adults.
The findings from the subgroup of people with
sedentary jobs for whom physical activity increased with
retirement are consistent with findings from some
previous studies
13–15using measures of physical activity
limited to leisure-time physical activity or exercise
par-Table 2. Participation in regular physical activity among retirees and workers, by occupation type and wealth levelBy working statusb
Overalla Retired Working
% Total no. of observations % Total no. of observations % Total no. of observations Overall sample 50 34,019 44* 11,542 53 22,477 By occupation type
Physically demanding job 54* 14,616 41* 5,114 60 9,502
Sedentary job 48 18,483 47 5,598 49 12,885
By wealth level
Lower wealth 45* 16,675 33* 5,542 51 11,133
Higher wealth 55 17,344 53* 6,000 56 11,344
By occupation type and wealth level
Physically demanding job with lower wealth 49* 9,134 33* 3,146 57 5,988
Physically demanding job with higher wealth 62 5,482 54* 1,968 66 3,514
Sedentary job with lower wealth 41* 6,966 35* 1,874 43 5,092
Sedentary job with higher wealth 52 11,517 53 3,724 52 7,793
aSignificance presented is the difference between subgroups: physically demanding job versus sedentary job, higher wealth versus lower wealth,
physically demanding job with lower wealth versus physically demanding job with higher wealth, and sedentary job with lower wealth versus sedentary job with higher wealth.
bSignificance presented is the difference between retired and working groups, for each subgroup.
*p⬍0.01 (based on Fisher’s exact test) no., number
Table 3. Effects of retirement on physical activity (fixed-effects estimates)
Dependent variable: participation in regular physical activity (0/1)
Independent variables Coefficient (robust SE)
Retired (ref: working) ⫺0.01 (0.01)
Demographic characteristicsa
Age ⫺0.01** (0.002)
Household income/$100K 0.002 (0.004)
Marital status (ref: married)
Divorced or separated ⫺0.02 (0.03) Widowed ⫺0.02 (0.02) Never married ⫺0.10 (0.09) Health problems Hypertension 0.004 (0.01) Diabetes 0.03 (0.02) Heart disease 0.002 (0.02) Stroke ⫺0.08* (0.04) Lung disease ⫺0.04 (0.03) Cancer ⫺0.04 (0.03) Arthritis ⫺0.02 (0.01) ADL limitation ⫺0.04** (0.02) Constant 1.11** (0.09) R2 0.59 Number of observations 34,019 Number of people 11,469
aTime-constant demographic characteristics, including gender, race/
ethnicity, and education, were not estimated in the fixed-effects model.
*p⬍0.05; **p⬍0.01
ticipation. This finding might occur because, for
peo-ple with sedentary occupations, work-related physical
activity constitutes a small fraction of overall physical
activity. For people with sedentary jobs, retirement
could provide an opportunity for adopting a
more-active lifestyle. Using a composite indicator of physical
activities during both working and nonworking hours,
the present study identified the contrasting effect of
retirement by pre-retirement occupation type, which
was overlooked in previous literature that examined
only leisure-time physical activity.
Limitations of the current study include the
possibil-ity of measurement error from the crude measure of
occupation-related physical activity. The data did not
contain detailed and objective information on the
physical demands of each individual’s occupation.
Physical demands may vary across jobs in one
occupa-tion category, and the physical demands of jobs in some
occupation categories may change over time. It is
particularly likely that physical demands have been
reduced in recent years among traditionally physically
demanding occupations; in this case, the true
differ-ence in the effect of retirement on overall physical
activity between physically demanding jobs and
seden-tary jobs, if measured with more accuracy, might be
even larger than the contrast reported here.
A few additional limitations of this study merit
dis-cussion and should be addressed in future studies. First,
participation in physical activity is self-reported and is
subject to reporting errors. However, there is no
theo-retical reason to believe, or empirical evidence to
indicate, that the reporting error is systematic, and thus
potential reporting errors may not have influenced the
findings. Second, this study did not provide
informa-tion on changes in the content or patterns of physical
activity with retirement; this next, important step of
using various measures of physical activity could help to
inform the design of specific interventions. Third, this
study used one definition of retirement that was based
primarily on current working status in each wave with
2-year intervals and was allowed to be reversed in future
waves. Thus, the timing of the effect of retirement in
this study is likely to be a short-term effect (that could
have happened during the first 2 years of retirement),
given the small percentage of people who stayed retired
throughout the entire study period. The contrast
shown by subgroups defined by occupation type, in
particular, may reflect the different re-adjustment
pat-tern from work to retirement. Fourth, occupation type
was treated as a given rather than a choice in order to
focus on the effect of retirement rather than
occupa-tion choice. This distincoccupa-tion might be critical in the
study of younger adults’ labor transitions and physical
activity, because people who tend to be physically active
may be more likely to opt for physically demanding
occupations.
31Finally, this study did not explore the
effects of reasons for retirement, which may have
differential effects on physical activity and other health
behavior.
32Instead, health conditions and individual
heterogeneities were controlled in order to estimate
the average effect of retirement regardless of health
problems. Future studies may explore the differential
effects of retirement among individuals retiring for
various reasons.
Table 4. Effect of retirement on physical activity by occupation type and wealth level (fixed-effects estimates)a
Dependent variable: participation in regular physical activity (0/1)
Subgroup Coefficient on retired SE No. of observations No. of people
Physically demanding job ⫺0.075* 0.018 14,616 5022
Sedentary job 0.044* 0.016 18,483 5956
Lower wealth ⫺0.056* 0.019 16,675 5880
Higher wealth 0.026 0.016 17,344 5589
Physically demanding job with lower wealth ⫺0.104* 0.025 9,134 3249
Physically demanding job with higher wealth ⫺0.039 0.026 5,482 1773
Sedentary job with lower wealth 0.01 0.028 6,966 2314
Sedentary job with higher wealth 0.061* 0.02 11,517 3642
aAll the covariates in the main regression, presented inTable 3, were retained. Coefficient estimates for other covariates vary little across
subgroups and were similar to those presented inTable 3. *p⬍0.01
no., number
Table 5. Prevalence of cardiovascular disease among retirees: comparison of frequencies by pre-retirement occupation type
Currently have following health problem: frequency %a
Pre-retirement occupation type Hypertension Diabetes Stroke Heart disease
Sedentary (n⫽5598) 49.7 15.3 5.0 20.0
Physically demanding (n⫽5114) 56.9 22.1 7.4 26.7
The number of people approaching retirement age
is rapidly increasing. This study suggests that this
grow-ing segment of the nation’s population may not sustain
an adequate level of physical activity and that
retire-ment would widen disparity in physical activity by
wealth status.
The authors thank Dr. Frank Sloan for his input on the earlier drafts.
No financial disclosures were reported by the authors of this paper.
References
1. He XZ, Baker DW. Body mass index, physical activity, and the risk of decline in overall health and physical functioning in late middle age. Am J Public Health 2004;94:1567–73.
2. Ballor DL, Keesey RE. A meta-analysis of the factors affecting exercise-induced changes in body mass, fat mass, and fat-free mass in males and females. Int J Obes 1991;15:717–26.
3. Irwin ML, Yasui Y, Ulrich CM, et al. Effect of exercise on total and intra-abdominal body fat in postmenopausal women: a randomized con-trolled trial. JAMA 2003;289:323–30.
4. Ross R, Dagnone D, Jones PJ, et al. Reduction in obesity and related comorbid conditions after diet-induced weight loss or exercise-induced weight loss in men. A randomized, controlled trial. Ann Intern Med 2000;133:92–103.
5. Miller TD, Balady GJ, Fletcher GF. Exercise and its role in the prevention and rehabilitation of cardiovascular disease. Ann Behav Med 1997;19:220 –9.
6. Barnes DE, Whitmer RA, Yaffe K. Physical activity and dementia: the need for prevention trials. Exerc Sport Sci Rev 2007;35:24 –9.
7. Giovannucci E, Ascherio A, Rimm EB, et al. Physical activity, obesity, and risk for colon cancer and adenoma in men. Ann Intern Med 1995;122: 327–34.
8. McAuley E, Elavsky S, Jerome GJ, et al. Physical activity-related well-being in older adults: social cognitive influences. Psychol Aging 2005;20:295–302. 9. CDC, Division of Nutrition and Physical Activity, National Center for
Chronic Disease Prevention and Health Promotion. Physical activity for everyone—recommendations. www.cdc.gov/nccdphp/dnpa/physical/rec-ommendations/index.htm.
10. USDHHS, Office of Disease Prevention and Health Promotion. Healthy People 2010.www.healthypeople.gov.
11. Bartley M. Unemployment and ill health: understanding the relationship. J Epidemiol Community Health 1994;48:333–7.
12. Robert S, House JS. SES differentials in health by age and alternative indicators of SES. J Aging Health 1996;8:359 – 88.
13. Mein GK, Shipley MJ, Hillsdon M, et al. Work, retirement and physical activity: cross-sectional analyses from the Whitehall II study. Eur J Public Health 2005;15:317–22.
14. Evenson KR, Rosamond WD, Cai J, Diez-Roux AV, Brancati FL, Atheroscle-rosis Risk in Communities Study Investigators. Influence of retirement on leisure-time physical activity: the Atherosclerosis Risk in Communities study. Am J Epidemiol 2002;155:692–9.
15. Slingerland AS, van Lenthe FJ, Jukema JW, et al. Aging, retirement, and changes in physical activity: prospective cohort findings from the GLOBE study. Am J Epidemiol 2007;165:1356 – 63.
16. Caspersen CJ, Powell KE, Christensen GM. Physical activity, exercise, and physical fitness: definitions and distinctions for health-related research. Public Health Rep 1985;100:126 –31.
17. Brach JS, Simonsick EM, Kritchevsky S, et al. The association between physical function and lifestyle activity and exercise in the health, aging and body composition study. J Am Geriatr Soc 2004;52:502–9.
18. DiPietro L. Physical activity in aging: changes in patterns and their relationship to health and function. J Gerontol A Biol Sci Med Sci 2001;56(S2):13–22.
19. Haight T, Tager I, Sternfeld B, et al. Effects of body composition and leisure-time physical activity on transitions in physical functioning in the elderly. Am J Epidemiol 2005;162:607–17.
20. Bureau of Labor Statistics, U.S. Department of Labor. Standard occupa-tional classification system. Washington DC: Office of Employment and Unemployment Statistics, 1980.
21. National Academy of Sciences, Committee on Occupational Classification and Analysis. Dictionary of occupational titles. Washington DC: U.S. Depart-ment of Commerce, Bureau of the Census, 1981.www.occupationalinfo. org.
22. Dwyer DS, Mitchell OS. Health problems as determinants of retirement: are self-rated measures endogenous? J Health Econ 1999;18:173–93. 23. McGarry K. Health and retirement: Do changes in health affect retirement
expectations? J Hum Resour 2004;39:624 – 48.
24. Hausman JA. Specification tests in econometrics. Econometrica 1978; 46:1251–71.
25. Chow GC. Tests of equality between sets of coefficients in two linear regressions. Econometrica 1960;28:591– 605.
26. Ford ES, Merritt RK, Heath GW, et al. Physical activity behaviors in lower and higher socioeconomic status populations. Am J Epidemiol 1991;133: 1246 –56.
27. Chung S, Domino ME, Stearns SC. The effect of retirement on weight. J Gerontol B Psychol Sci Soc Sci. In press.
28. Gordon-Larsen P, Nelson MC, Page P, et al. Inequality in the built environment underlies key health disparities in physical activity and obesity. Pediatrics 2006;117:417–24.
29. Estabrooks PA, Lee RE, Gyurcsik NC. Resources for physical activity participation: does availability and accessibility differ by neighborhood socioeconomic status? Ann Behav Med 2003;25:100 – 4.
30. Wilson DK, Kirtland KA, Ainsworth BE, et al. Socioeconomic status and perceptions of access and safety for physical activity. Ann Behav Med 2004;8:20 – 8.
31. Lakdawalla D, Philipson T. Labor supply and weight. J Hum Resour 2007;42:85–116.
32. Virtanen P, Vahtera J, Kivimäki M, et al. Labor market trajectories and health: a four-year follow-up study of initially fixed-term employees. Am J Epidemiol 2005;161:840 – 6.