Contribution of Cluster Relations to Food Competitiveness in the EU
Bert Vermeire and Xavier Gellynck
Ghent University, Faculty of Bioscience Engineering Division Agro-Food Marketing, Coupure Links 653
9000 Gent, Belgium
[email protected] ; [email protected]
Paper prepared for presentation at the 1st International European Forum on Innovation and System in Food Networks
Officially endorsed by the European Association of Agricultural Economists (EAAE), Innsbruck-Igls, Austria
February 15-17, 2007
Copyright 2007 by [Vermeire, Gellynck]. All rights reserved. Readers may make verbatim copies of this document for non-commercial purposes by any means, provided that this copyright notice appears on all such copies.
Contribution of Cluster Relations to Food Competitiveness in the EU
Bert Vermeire and Xavier Gellynck
Ghent University, Faculty of Bioscience Engineering Division Agro-Food Marketing, Coupure Links 653
9000 Gent, Belgium
[email protected] ; [email protected] 1. Introduction
The participation in regional networks is an important factor in explaining the food companies’ innovation capacity which – in turn - is an important driver of competitiveness (Gellynck et al., 2006a; Gellynck et al., 2007). Further, it is argued in cluster theory that intensive networking between related companies and other actors in a given region is a driver of competitive advan-tage of this region (Enright, 1998; Porter, 1998). In this paper the food cluster is understood as a set of geographically and socially embedded network relations based on a range of comple-mentarities and communalities between regional actors and enhancing the competitiveness of the regional food industry. Each cluster shows distinct patterns of learning and uses different sources of knowledge (Pittaway et al., 2004; Steiner and Hartmann, 2006). As such, clusters exist in different forms, characterised by distinct configurations of network relations.
By joining a network and taking part in a collaborative process with partners belonging to the network, the company is able to overcome internal restrictions (Camps, 2004; Daskalakis and Kauffeld-Monz, 2005; Janszen, 2002). Network configurations are diverse in character, dyna-mic and principally guided by the choices of partners and by the network infrastructure itself (Pittaway et al., 2004). Further, networks are considered to be embedded in the environment (Etzkowitz and Klofsten, 2005). This environment can cover different geographical scales of which the regional scale proves to be a significant one (Bunnell and Coe, 2001). Earlier research demonstrates that the company’s networking behaviour is important to explain its innovation capacity and competitiveness: it is the condition which has to be fulfilled to benefit from other regional external resources for innovation, such as the presence of a strong food chain, a com-petitive market or leading-edge facilities (Gellynck et al., 2006b; Gellynck et al., 2007). Further, networking relations are established with a diversity of partners. There is evidence that net-works are more effective where there is exchange of knowledge between systems, for example between different industrial sectors, regions or stakeholders (Foster et al., 2003; Kaufmann and Todtling, 2001). This is also acknowledged in cluster theory, where reference is made to net-works between concentrated groups of companies and a range of other organisations (Porter, 1996; Raines, 2001).
Following the important role of networking in innovation processes and the diversity of network relations existing within regional food clusters, our paper focuses on the question which net-work characteristics have the strongest relationship with the competitiveness of the regional food industry. In particular, this paper formulates an answer to this question based on the per-ception of the main stakeholders in the network: entrepreneurs, scientists, policy makers and network actors (understood as regional development initiatives and formal networks). This pa-per is structured as follows. In the following section the conceptual framework is described, lea-ding to the research question. In section three the research design and methodology are described. Afterwards, in section four the analysis and main findings are presented, leading to the conclusions in section five.
2. Conceptual framework
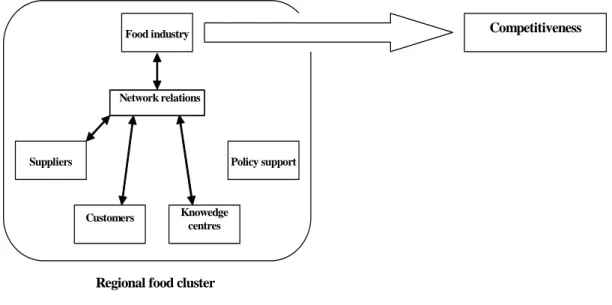
The conceptual framework describes the regional food network as a bundle of relations bet-ween the food industry and its main regional suppliers, customers (the regional market), know-ledge centres and regional policy makers. Networking between the stakeholders enhances the integration of internal and external resources by food companies, aiming at increasing compe-titiveness and innovation (Camps, 2004; Pittaway et al., 2004). As illustrated in figure 1, the food network is a constituting element of the regional food cluster. The food cluster is under-stood as a range of actors whereby network relations establish the interactions between the ac-tors. Consequently, a well performing network contributes to the competitiveness of the food industry. The following paragraphs describe the different elements depicted in the conceptual framework.
Figure 1. Conceptual framework
Food competitiveness and the cluster
While the impact of the individual company’s networking behaviour on its innovation processes and competitiveness can easily be measured, this becomes more difficult when the focus is on the effect of regional networking as a whole on the competitiveness of the region. This is illu-strated by theoretical perspectives on the cluster. The cluster is understood as ‘a geographically proximate group of companies and associated institutions in a particular field, linked by com-monalities and complementarities’ (Porter, 1996). In literature the cluster is described as a ‘self-reinforcing network of not just companies, but a range of other organisations – including rese-arch institutes, universities, financial bodies and public sector agencies – which is characterized by high levels of both competition and collaboration’ (Raines, 2001). The positive impact of the cluster relates to its potential to create a pool of knowledge and streams of knowledge between the actors, resulting in an increasing innovation competence of the companies and of the region as well as in increased competitive advantage on the global stage (Asheim and Coenen, 2005; Enright, 1998; Lagnevik et al., 2004; Porter, 1998). However, this benefit can not be presuppo-sed, as the cluster’s competitiveness may vary according to the degree and type of development (Engelstoft et al., 2006; Folta et al., 2006). In a critical review of this model, Martin and Sunley (2003) describe a number of problems attached to the notion of competitiveness as it is used in
Competitiveness
Policy support Suppliers
Knowedge centres
Regional food cluster Customers
Food industry
cluster theory: first, while this notion has a clear meaning at company level, it becomes incre-asingly difficult at an aggregated level. It is argued that nations and regions do not compete in the way companies do. Second, the terms ‘competitive advantage’, ‘competition’ and ‘produc-tivity’ are used interchangeably, being strongly related, yet clearly distinct concepts. Third, Porter’s cluster model combines ideas from different theoretic perspectives, such as agglome-ration theory and social network theory. As a result, the empirical data can be interpreted in dif-ferent ways and only a generalised notion of the benefits of clustering is supported.
Consequently, there is no clear theoretical grounding to determine which indicators can be used to estimate the benefits of regional networking in clusters and hence innovation. In Porter’s Diamond it is stated that four interrelated factors determine the competitive strength: factor con-ditions, demand concon-ditions, related and supporting industries and firm strategy, structure and rivalry (Porter, 1998). The idea is that nations will succeed in industries where the Diamond is most favourable. In line with the distinction made by Buckley et al. (1988) between perfor-mance, potential and process in studying competitiveness, Porter’s Diamond explains the po-tential and process of enhancing competitiveness, rather than measuring actual performance (Gellynck, 2002). However, in this research an indicator is required which quantifies competi-tiveness whereby explanations are investigated by a number of variables referring to the inten-sity of network relations. As such, a performance measure is preferable. In scientific literature, a large variety of competitiveness measures are described such as factor costs, added value, in-vestments, innovation and R&D, productivity, profitability, terms of trade or even social goals such as employment and inflation. The focus in this paper is on value added which is a classic indicator of the company’s overall international competitiveness (Hitchens et al., 1998; Ooghe et al., 2006). Thereby two broad value added measures are used, namely the value added per employee and the share of the value added of the food industry in the regional GDP. The use of these variables is described in detail in section 4. Concluding, it must be stressed that investiga-ting the relation between value added and regional network relations makes abstraction of other drivers of value added, on the one hand, and of other effects of regional networking on the other.
Relations in the regional food network
In this paper four types of network relations are distinguished. First and second are the relations of the food companies within the food supply chain whereby supplier- and customer relations are distinguished (Bourlakis and Weightman, 2004; Viaene and Gellynck, 2000). These relati-ons take place in the integrated process by which raw materials are manufactured into final pro-ducts, then distributed and delivered to customers (Beamon, 1999). Traditionally, the food-industry is held to be supplier-push while in recent times the rising influence of market factors has made the food industry more demand-pull (Rama and Alfranca, 2003). The supply chain relations associated with the latter view deal with fulfilling needs and wants of the market, ba-sed on the exchange of skills, resources and competences (Viaene and Gellynck, 2000). Third, industry-science links (ISL) refer to knowledge exchange between knowledge centres and companies through various proxies such as licensing, spin-off activities, academic publi-cations or research partnerships (Kaufmann and Todtling, 2001; Veugelers and Cassiman, 2005). Further, university-based technology-transfer organizations play an important role in coordinating these transfers (Debackere and Veugelers, 2005). There is evidence that the presence of strong ISL’s has a positive impact on the performance and innovativeness of the company (Fey, 2005). On the other hand, there seems to be a gap between high scientific per-formance on the one hand and industrial competitiveness on the other, especially in Europe. This gap, mainly attributed to low levels of ISL’s, is known as the ‘European paradox’ (Cassi-man and Veugelers, 2002).
Fourth, regional policy support is a factor in enhancing the innovation capacity of the food in-dustry (Raines, 2001; Todlting and Trippl, 2005). The regional institutional context embeds knowledge and allows knowledge creation through enhancing interaction between the available physical and human resources (Malmberg and Maskell, 2006). This leads to the assumption in regional policy that if the external environment is able to offer positive contributions for know-ledge creation and innovation, companies will incorporate this and increase their competitiven-ess and innovative capacity (de Noronha Vaz, 2004). Cluster policies in Europe have emerged during the last decade (Raines, 2001) and regional policy received an important impulse by the European Commission, listing regional policy (besides other policies) in the Green Paper on In-novation in 1995 (Kaufman & Wagner, 2005) as necessary to strengthen the competence for in-novation. However, it must be stated that regional policy action depends of the instruments provided by higher public authorities (i.e. national and EU government) and that measures taken by higher authorities influence regional food industry as well. Therefore, regional policy relati-ons concern the relatirelati-ons with policy makers on different levels, affecting the regional reality.
Research question
Earlier research demonstrated the importance of regional networking in food innovation proces-ses at company level (Gellynck et al., 2007) and at the level of the regional food cluster (Lagne-vik et al., 2004; Malmberg and Maskell, 2006). Relations between different cluster stakeholders have a positive effect on the competitiveness of the regional food industry. However, the que-stion rises to what extent the intensity of relation differ within each cluster and what may be the relation of different relations with the food industry’s competitiveness. This paper explores dif-ferences in the perception of relations between food companies and regional policy support, knowledge centres, suppliers and the regional market. In particular it is analysed whether diffe-rences in network relations lead to different degrees of competitiveness among regions
3. Methodology
The research relies on primary data collection among stakeholders of regional food networks in the EU. First, a quantitative survey is conducted to estimate the importance of the network re-lations described in previous section. Second, qualitative data are gathered to explain the obser-vations using the Delphi-method. The analysis took place within the context of Food
Innovation Network Europe1 (FINE). This project has the aim to develop regional strategies to
increase RTD in the food industry in a consortium of eight EU regions with a strong agro-food profile. In this context quantitative survey data were collected and a Delphi-round was held pro-viding qualitative insights to explain the findings from the survey.
The research area comprises 7 regions participating in FINE. As such, the selection of the sam-ple relies on the presence of a strong regional food industry, responding to intense network re-lations between food stakeholders. These regions are Castilla y Leon (ES), Øresund (S+DK), East-Netherlands (NL), Rogaland (N), East- and West-Flanders (B), Scotland (UK), Wielkopol-ska (PL) and Emilia-Romagna (I). The food industry in the sample represents a value added of 13 billion € (in 2003) which is 7,2 % of the total value added generated in the EU-25 (181 bil-lion €). Further, the regions house an important meat processing sector (including dairy and ani-mal feed production) which corresponds to a strong agricultural meat sector. Other observed food specialisations are beverages (beer, wine, whisky), fish products and functional foods (Vermeire et al., 2007). The value added of each of the regions is presented in Source: FINE. Wielkopolska is identified as an outlier and consequently removed from the sample as the
tural differences with the other regions might distort the analysis. In all other regional food in-dustries the value added per employee is higher than the EU-25 average for the food industry.
Source: FINE
Figure 2. importance of the regional food industry,2003, in value added per employee (€) and
employment share (%)
The respondents belong to the following categories: (1) food companies are understood as in-dustrial food and beverages processing companies, (2) knowledge centres which generate food-related knowledge and manage the mechanisms to transfer it to food companies through ISL’s. (3) Regional policy makers, (4) regional development specialists and (5) representatives of for-mal regional networks functioning as platforms where the different other stakeholders interact. Sample characteristics are described in the table below (Table 1. Description of the sample, in number of respondents and %). It is observed that all groups are sufficiently represented. Food companies and knowledge centres are stronger represented (24%) compared with the other sta-keholders. In Emilia-Romagna the knowledge centres are overrepresented (50% of the respon-dents) while in Øresund the same holds true for the food networks (33% of the responrespon-dents).
Table 1. Description of the sample, in number of respondents and %
Food company Knowledg e centre Policy maker Regional Developm ent Food network Total Castilla y Leon 3 3 1 2 2 11 Emilia-Romagna 2 5 2 0 1 10
East- &
West-Flanders 3 3 2 1 2 11 East-Netherlands 4 3 2 3 2 14 Øresund 3 2 4 1 5 15 Rogaland 2 1 2 3 1 9 Scotland 2 2 1 3 2 10 Total # 19 19 14 13 15 80 Total % 24 24 18 16 19 100 10000 20000 30000 40000 50000 60000 70000 80000 90000
Cast illa y Leon Emilia-Ro magna
Oost & W est -V laanderen
Oost -Nederland
Øresund Rog aland Scot land W ielko polska
0 0,5 1 1,5 2 2,5
added value per em ployee s hare of population em ployed in food indus try Value added (Th. €) Average EU25 % of inhab-itants
To test the conceptual framework described in section 2 data are collected in a structured survey and subsequent Delphi-rounds.
First, the survey measures the perception of regional food stakeholders of the strength of net-work relations. Data collection is based on a structured questionnaire among 80 food stakehol-ders in 7 EU regions, thereby the perception of cluster relations is measured by indicating the agreement with statements about cluster relations on a seven-point Likert scale. The statements are defined in a discussion round among the project partners. All statements describe the strength of the relation between the food industry and the other stakeholders in the cluster, re-spectively food suppliers, customers, knowledge centres and regional policy makers. The state-ments are depicted in Table 3. Description of the factors labelled as cluster relations. The interviews were conducted in May-June 2006.
Second, additional data about the observed statistical correlations are provided by a qualitative research stage whereby the partner regions in the FINE network organise a Delphi round (Car-son et al., 2001; Malhotra, 2004; MDF, 2004). In this method, summaries of the responses to the structured questionnaires are provided to the regional stakeholders, who are requested to give a critical evaluation of the results. These evaluations are summarized and afterwards re-distributed for a second and third evaluation round. As such, the evaluations of the regional sta-keholders provide additional information about the perception of cluster relations. In the survey, items are measured on the same scale, thus permitting comparison between the regions. The items resulting from Delphi-round however can not be weighed against each other. Consequent-ly they are not used to explain the difference between low and high competitive regions but re-present perceptions of the cluster relations providing additional explanations of the scoring behaviour of the respondents.
4. Analysis
The analysis starts by clustering the regions in terms of their competitiveness. Next, the set of variables is restructured into five factors using factor- and reliability analysis. These factors cor-respond with network relations which are further investigated through discriminant analysis, whereby the ability of the factors to predict the regional competitiveness is tested.
High- and low competitive food regions
The 7 regions are divided into two subsets with similar degree of food competitiveness through hierarchical cluster analysis (Ward’s method – squared Euclidean distance) . Two input-varia-bles are used for this purpose: value added per employee and the share of population employed in the food industry. First, value added per employee is a classic indicator of the company’s la-bour productivity and its overall international competitiveness (Ooghe et al., 2006; Ooghe and Van Wymeersch, 1985). Further, this indicator is very useful to measure competitiveness at an aggregated level (Traill and Pitts, 1998). Value added expresses the value the food industry adds to the economy (Sloman, 2003). In micro-economic terms value added is the difference between the company’s turnover and its purchases of materials and services. However, it must be taken into consideration that a high value added per employee margin can have other explanations than competitiveness: the value added margin will increase if the company is stronger vertically integrated and if it has a higher capital intensity (Ooghe and Van Wymeersch, 1985). The se-cond variable is the share of the value added of the food industry in the regional GDP (which is the total sum of the value added produced in a given territorial unit). As such, this variable refers to the degree of specialisation in food production, relative to the total economic activity in the region. The use of this variable as an indicator of competitiveness is based on the presupposition
in cluster theory that specialisation leads to increased interaction and learning with a potential positive impact on the food industry’s competitiveness (Lin et al., 2006; Maskell, 2001; Porter, 1996). Interpreting this variable it must be taken into consideration that the specialisation in food industry might be explained by the relative weakness of other sectors.
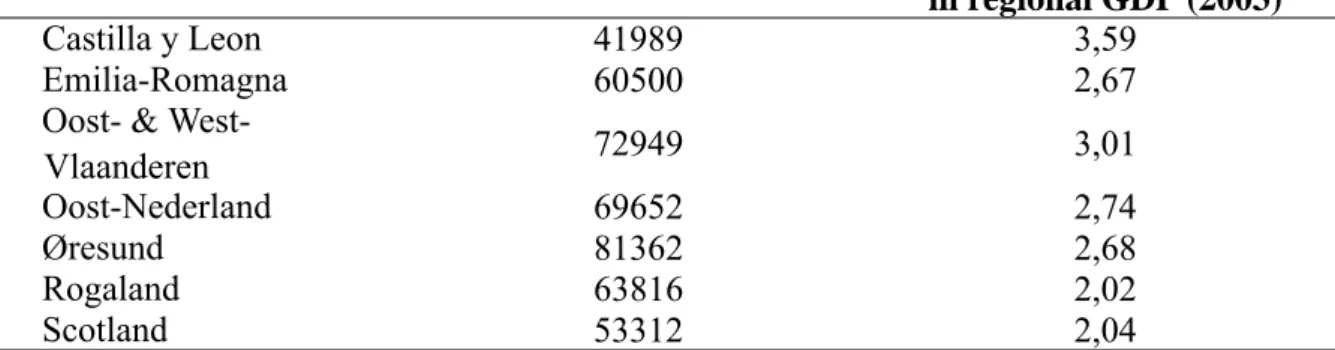
Table 2. Description of the cluster variables
Source: FINE
The analysis results in a two-cluster solution labelled low and high competitive clusters. East-and West-FlEast-anders, Øresund East-and East-NetherlEast-ands are separated as one cluster. Observing the high value added/employee rates (figure 2) this cluster is labelled high competitive. The second cluster consists of the regions Scotland, Castilla y Leon, Emilia-Romagna and Rogaland and is labelled low competitive. However, it must be kept in mind that a low competitiveness score does not imply that the region is not performing at all. In contrary, it is observed that in each of the regions the value added per employee is higher than the European average.
Identifying cluster relations
The theoretical framework defined a number of regional network relations bearing the focus of this research. To measure these relations a list of variables was composed by a group negotiation process between experts belonging to regional development agencies and researchers in each of
the regions1. First, the main regional network relations are described. Second, variables are
at-tributed to the relations by discussion in small groups. Third, the variables are presented to the whole group and further refined until consensus is achieved. In this way, a collection of varia-bles is obtained serving as indicators for network relations in the cluster. The relation between the variables is analysed through factor analysis and reliability analysis. Factor analysis is used to reduce the set of variables to a few underlying factors, explaining the correlations among the variables (Malhotra, 2004). The set of factors will then be used as independent variables in
mul-tivariate analysis. Reliability analysis (Cronbach’s α) is used complementary to verify the
inter-nal consistency (being free from random error) of the factors (Malhotra, 2004). A number of five factors is fixed observing the Scree plot and eigenvalues) which results in a satisfactory le-vel of variance explained (70%). Table 3. Description of the factors labelled as cluster relations shows the five factors that are calculated. Loadings less than 0.5 are omitted in order to get a
clear picture. The α-values are higher than 0.6, indicating reliable scales for each of the factors.
Value added per employee (in €, 2003)
% of value added food industry
in regional GDP (2003)
Castilla y Leon 41989 3,59
Emilia-Romagna 60500 2,67
Oost- & West-
Vlaanderen 72949 3,01
Oost-Nederland 69652 2,74
Øresund 81362 2,68
Rogaland 63816 2,02
Scotland 53312 2,04
1. Partners in the FINE network are the Development Agency East Netherlands (the Netherlands), Øresund Food Network (Denmark/Sweden), Stiftelsen Rogalandforskning and Rogaland Fylkeskommune (Norway), Ghent University (Belgium), Aster and Centuria RIT (Italy), Poznan Science and Technology Park (Poland), Scottish Enterprise (UK), Cartif (Spain).
Table 3. Description of the factors labelled as cluster relations
Extraction method : Principal Component Analysis (PCA) Rotation method : Varimax
Factor loadings less than ,500 are omitted Bartlett’s test of sphericity: ,000 KMO measure of sampling adequacy: ,705
Observing the variables with high factor loads, the factors are interpreted and labelled. Factor 1 (policy focus on the food industry), 2 (supplier link) and 5 (regional market) can unambiguously be related to the cluster relations. The extraction of factors 3 and 4, however, indicates the non-correlation between industry-science links, on the one hand, and food companies and education on the other hand. However, not all variables have a straightforward relation with the factor. In the survey, three variables refer to the link with policy makers at the regional, national and EU level. Table 3. Description of the factors labelled as cluster relations indicates that these varia-bles load on different factors: links with policy makers at the regional and national level load – as expected – on the factor ‘policy focus on food industry’, while the link with regional EU po-licy is associated with supplier links. A possible explanation lies in the strong European em-phasis on Agricultural policy, influencing the relationship between the food industry and the agricultural sector as its main supplier.
Policy focus on food industy (1) (α = ,881)
Supplier link (2) (α = ,777)
Statement loadingFactor Statement loadingFactor
Regional policy (on different policy levels) acknowledges
the importance of the food industry ,860
There is a strong link between regional food companies and
regional service providers ,747
Regional policy acknowledges the importance of R&D in
the food sector ,850
There is a strong link between regional food companies and regional producers of non-agricultural raw materials ,717 Regional policy makers acknowledge the importance of the
regional food industry ,842
There is a strong link between regional food companies and regional producers of investment goods ,717 Regional policy focuses on specialised subsectors in the
regional food sector ,783
Regional EU policy acknowledges the importance of the
regional food sector ,602
Regional policy acknowledges the importance of R&D in
specialised subsector in the regional food sector ,767
There is a strong link between regional food companies and
regional agriculture ,593
Regional policy at member-state level acknowledges the
importance of the regional food sector ,581 Industry-science link (3)
(α = ,767)
Education (4) (α = ,776)
Statement loadingFactor Statement loadingFactor
Food companies sufficiently address regional knowledge
centres in their R&D activities ,838
Regional education institutes produce technical workers with the right capabilities for food industry ,762 In the region there is a good transfer of knowledge from
knowledge centres to food companies ,728
Regional education institutes produce science workers with the right capabilities for food industry ,752 Knowledge centres sufficiently take initiatives to support
food companies in their R&D activities ,701
There is a strong link between regional food companies and
regional wholesalers ,726
Regional market (5) (α = ,673)
Statement loadingFactor There is a strong link between regional food companies and
retailers located in the region ,831
There is a strong link between regional food companies and
regional purchasing companies ,725
There is a strong link between regional food companies and
Cluster relations and food competitiveness
Through discriminant analysis a prediction is made of the membership of the respondents of a high- or low competitive food region based on their perception of network relations (De Pels-macker and Van Kenhove, 2005; Malhotra, 2004). This provides insight in the strength and di-rection of the association between intensity of a network relation and the regional food competitiveness. Table 4. Structure matrix depicts the structure matrix, which is understood as a function predicting cluster membership (i.e. competitiveness). The validity of the structure matrix is demonstrated by the significant Wilk’s Lambda and satisfactory canonical correlation. Furthermore, the function has the power to correctly predict the cluster membership of 78,9% of the cases, which is about 29 % higher than at-random allocation (1 chance out of 2, i.e. 50%). This can be considered a good score (Malhotra, 2004).
Table 4. Structure matrix
Canonical Correlation: ,669 Wilk’s Lambda: ,000 Classification result: 78,9%
The coefficients of the factors lead to a number of findings. Scores are interpreted and compared with the strategic perspectives formulated through Delphi-rounds.
First of all, the high coefficient of education reveals that regional food stakeholders who expe-rience strong links between the food industry and education are predominantly located in the high competitive food regions. As such, the link between education and food industry is stron-gly associated with the competitiveness of the food region. Education is thereby important for providing human capital with the right capabilities for food industry, in particular with scientific capabilities for R&D and technical capabilities for the implementation of new processes and in-novations. Indeed, comparing this finding with the results from the Delphi-rounds a decrease in the availability and quality of human capital is perceived. As such, the problems are not situated in a discrepancy between scientific and technical skills, but in a lacking attention for business management in the education system. As such, there is a need for business training, focussing on aspects such as marketing, finance, human resource management and supply chain manage-ment. As such the main challenge of education lies in reinforcing entrepreneurship. Furthermore it is argued that low average wages lead to low attractiveness of career opportunities in the food industry.
Of second importance, related with the education link, the strength of ISL’s is associated with regional food competitiveness. The perception of the knowledge transfer and cooperation bet-ween companies and scientists are a strong predictor of the competitiveness of the region. This is confirmed by the Delphi-round, where it is observed that knowledge transfer is generally im-proving but nevertheless insufficient. In particular, better knowledge transfer should permit firms to respond better to new consumer trends (related with changing demographic trends such as ageing populations and single-parent households), changes in legislation (eg. food safety) and technological developments in other sectors such as medicine and biotechnology.
Obvious-Factors Coefficients
Education ,916
Industry-science link ,379
Supplier link ,272
Regional market -,228
ly, education and science are strongly linked to each other. However it must be kept in mind that these factors are, by definition, not correlated among themselves, which suggests that their re-lation with competitiveness is different. A possible explanation was provided in the Delphi-round where it is suggested that the role of education lies in building a regional human capital characterised by good entrepreneurial skills and mentality, which is general knowledge with a strong tacit content. For the scientific perspective, alternatively, the challenge lies in better va-lorising the specialised knowledge through technology transfers or spin-offs.
The third and fourth coefficient are the regional market and supplier link. The structure matrix reveals that the relation between competitiveness is perceived different with customers, on the one hand, and suppliers, on the other hand. While strong supplier links are moderately positive associated with regional competitiveness, a negative correlation is demonstrated with strong re-gional market links. The negative correlation between supplier links and market links is in line with the classic perspective on the food-industry being ‘supplier-oriented’: integrating, mo-difying and recombining technologies and processes delivered by upstream industries (Rama and Alfranca, 2003). However, the negative and limited impact of regional market links is in contrast with the view on the food industry as being increasingly market oriented, characterised as ‘demand-pull’(Viaene and Gellynck, 2000). A possible explanation for the negative associa-tion of regional market links lies in the globalisaassocia-tion of retail sector. As such, the present retai-lers predominantly are large, international players, forcing producers to continuously adapt their products to changing needs (Lagnevik et al., 2004). This finding is also in line with earlier re-search results indicating that companies will increase their innovation competence through in-tense networking within the region (amongst others with suppliers) while expanding their market orientation (Gellynck et al., 2007).
The fifth coefficient deals with the presence of policy support towards the food industry in par-ticular. There is no correlation between the perception of policy support and food competitiven-ess, which indicates that the perception of policy support towards the food industry is not perceived differently between high- and low competitive food regions. Observing the loading variables, this factor refers to the presence of vertical measures aimed at the food industry in particular. This is in line with Porter’s statement that government should support clusters throu-gh the development of specialised factor conditions (1998). This point of view is shared partly by the European Commission, stating that industrial policy primarily has a horizontal character but has to take into account the specific context of particular sectors and the opportunities and challenges that they face (Beckeman and Skjöldebrand, 2005). The findings show no significant difference between high and low competitive clusters in their perception of vertical policy sup-port, however this factor received the highest mean score by each of the clusters which confirms that vertical policy support is perceived important.
5. Conclusion
This paper analysed the perception of cluster stakeholders in 7 EU regions with a strong agro-food profile, investigated in the context of the FINE-network. The results confirm the existence of a ‘European paradox’ in the food industry. Education and industry-science links are identi-fied as main explanations for the difference between clusters in low and high competitive food regions. Thereby possible positive effects of the strong scientific knowledge base on food indu-stry competitiveness are hampered by poor levels of knowledge transfers. Thereby the strategic orientation of EU food regions draws attention to the need of educating general entrepreneurial skills on the one hand and of stimulating the transformation of scientific knowledge in business ideas on the other.
The comparison of the perception of network relations between high and low competitive food regions points at the importance of relations between food industry and science and education primarily. However, it should be kept in mind that the data reflect the position of the cluster
members, but does not express the actual intensity and quality of the network relations as the findings rely on subjective appraisals. The strength of this research is that reliable findings were established about complex and embedded network relations on a highly aggregated level. However, this implies that the conclusions need to be refined further, analysing the relation bet-ween different practices in education and science on the one hand and regional competitiveness on the other hand. Other research steps involve the verification of the conclusions with ‘hard’ data, both on the level of the European Union as on the level of particular regions or subsectors.
6. Literature
Asheim, B.T., Coenen, L., 2005, Knowledge bases and regional innovation systems:
Compa-ring Nordic clusters. Research Policy34, 1173-1190.
Beamon, B.M., 1999, Measuring supply chain performance. International Journal of Operations
& Production Management19, 275-292.
Beckeman, M., Skjöldebrand, C., 2005, Clusters/networks promote food innovations. Journal
of Food EngineeringAccepted for publication.
Bourlakis, M., Weightman, P. 2004. Food supply chain management (Oxford, Blackwell Publi-shing).
Buckley, P., Christipher, L., Prescott, K., 1988, Measures of international
competitiveness: A critical survey. Journal of Marketing Management4, 175-200.
Bunnell, T.G., Coe, N.M., 2001, Spaces and scales of innovation. Progress in Human
Geogra-phy25, 569-589.
Camps, T., 2004, Chains and networks: theory and practice. , In: Camps, T., Diederen, P., Hof-stede, G.J., Vos, B. (Eds.) The emerging world of chains & networks. Bridging theory and practice. Reed Business Information, 's Gravenhage.
Carson, D., Gilmore, A., Perry, C., Gronhaug, K., 2001, Qualitative marketing research. Sage Publications, London.
Cassiman, B., Veugelers, R. 2002. Complementarity in the innovation strategy: internal R&D, external technology acquisition, and cooperation in R&D (IESE Research Division), p. 21.
Daskalakis, M., Kauffeld-Monz, M., 2005. Trust and knowledge in the behavioural dynamics of innovation networks. In: Paper presented on the 4th European Meeting on Applied Evolutionary Economics, Utrecht.
De Pelsmacker, P., Van Kenhove, P., 2005, Marktonderzoek. Pearson Education, Amsterdam. Debackere, K., Veugelers, R., 2005, The role of academic technology transfer organizations in
improving industry science links. Research Policy34, 321-342.
Engelstoft, S., Jensen-Butler, C., Smith, I., Winther, L., 2006, Industrial clusters in Denmark:
Theory and empirical evidence. Papers in Regional Science85, 73-97.
Enright, J., 1998. The globalization of competition and the localization of competitive advan-tage: policies towards regional clustering. In: Workshop on the globalization of multina-tional enterprise activity and economic development, Strathclyde, Scotland.
Etzkowitz, H., Klofsten, M., 2005, The innovating region: toward a theory of knowledge-based
regional development. R & D Management35, 243-255.
Fey, C.F., 2005, External sources of knowledge, governance mode, and R&D performance.
Journal of Management31, 597-621.
Folta, T.B., Cooper, A.C., Baik, Y., 2006, Geographic cluster size and firm performance.
Jour-nal of Business Venturing21, 217-242.
Foster, M., Meinhard, A., Berger, I., 2003, The role of social capital: bridging, bonding or both? Ryerson University, Toronto.
Gellynck, X., 2002, Changing Environment and Competitiveness in the Food Industry. Ghent University, Ghent.
Gellynck, X., Vermeire, B., Viaene, J. 2006a. Innovation and networks in the food sector: im-pact of regional factors. In International European Seminar on Trust and Risk in Business Networks (Bonn, Germany).
Gellynck, X., Vermeire, B., Viaene, J., 2006b, Innovation in the food sector: regional networks
and internationalisation. Journal on Chain and Network Science6, 21-31.
Gellynck, X., Vermeire, B., Viaene, J., 2007, Innovation in food firms: contribution of regional networks within the international business context. Entrepreneurship & Regional De-velopment (accepted for publication).
Hitchens, D., Birnie, J.E., McGowan, A., Triebswetter, U., Cottica, A., 1998, Investigating the relationship between company competitiveness and environmental regulation in Europe-an food processing: results of a matched firm comparison. Environment Europe-and PlEurope-anning A 30, 1585-1602.
Janszen, F. 2002. Systeemdynamische analyse van innovatie in ketens en netwerken (ISIS Consortium), p. 58.
Kaufmann, A., Todtling, F., 2001, Science-industry interaction in the process of innovation: the
importance of boundary-crossing between systems. Research Policy30, 791-804.
Lagnevik, M., Sjöholm, I., Lareke, A., Östberg, J., 2004, The dynamics of innovation clusters. A study of the food industry. Edward Elgar, Northampton.
Lin, C.H., Tung, C.M., Huang, C.T., 2006, Elucidating the industrial cluster effect from a
sy-stem dynamics perspective. Technovation26, 473-482.
Malhotra, N., 2004, Marketing research. An applied orientation. Prentice Hall, New Jersey.
Malmberg, A., Maskell, P., 2006, Localized learning revisited. Growth and Change37, 1-18.
Martin, R., Sunley, P., 2003, Deconstructing clusters: chaotic concept or policy panacea?
Jour-nal of Economic Geography3, 5-35.
Maskell, P., 2001. The theory of geographical agglomeration - minimum requirements and a knowledge-based suggestion. In: Third Congress on Proximity, Paris.
MDF 2004. The tango for organisations. 40 tools for institutional development and organisa-tional strengthening (MDF training & consultancy).
Ooghe, H., Van Laere, E., De Langhe, T., 2006, Are acquisitions worthwhile? An empirical study of the post-acquisition performance of privately held Belgian companies. Small
Business Economics27, 223-243.
Ooghe, H., Van Wymeersch, C., 1985, Financiële analyse van ondernemingen. HE Stenfert Kroese, Antwerpen.
Pittaway, L., Robertson, M., Munir, K., Denyer, D., Neely, A., 2004, Networking and innova-tion: a systematic review of the evidence. International Journal of Management Reviews 5-6, 137-168.
Porter, M., 1996, On Competition. Harvard Business School Publishing, Boston. Porter, M., 1998, On the competitive advantage of nations. Macmillan, London.
Raines, P. 2001. The cluster approach and the dynamics of regional policy-making. In Regiona and industrial policy research paper (Glasgow, European Policies Research Centre). Rama, R., Alfranca, O., 2003, Introduction: innovation in the food industry and biotechnology.
Journal of Biotechnology5, 213-221.
Sloman, J., 2003, Economics. Fifth Edition. Prentice Hall, Essex.
Steiner, M., Hartmann, C., 2006, Organizational learning in clusters: A case study on material
and immaterial dimensions of cooperation. Regional Studies40, 493-506.
Todlting, F., Trippl, M., 2005, One size fits all? Towards a differentiated regional innovation
Traill, B., Pitts, E., 1998, Competitiveness in the food industry. Blackie Academic & Professio-nal, London.
Vermeire, B., Gellynck, X., Bartoszek, P., Rijswijk, L. 2007. Strategic objectives for de-veloping innovation clusters in the European food industry FINE, ed. (Ghent, Ghent Uni-versity).
Veugelers, R., Cassiman, B., 2005, R&D cooperation between firms and universities. Some em-pirical evidence from Belgian manufacturing. International Journal of Industrial
Organi-zation23, 355-379.
Viaene, J., Gellynck, X., 2000, Innovation in SMEs and its impact on regional development: the case of the food industry, In: Deschoolmeester, D., De Steur, D., Gillis, K., Schamp, T. (Eds.) Entrepreneurship under Difficult Circumstances: an inventory of best practices and entrepreneurship challenges at the beginning of the 21st century. Vlerick Management School, Gent.