KEY DRIVERS OF PRODUCER TRUST FOR SOURCES AND METHODS OF ACCESSING MANAGEMENT INFORMATION
by
GRACE TUCKER
B.S., Kansas State University, 2009
A THESIS
submitted in partial fulfillment of the requirements for the degree
MASTER OF SCIENCE
Department of Agriculture Economics College of Agriculture
KANSAS STATE UNIVERSITY Manhattan, Kansas
2012
Approved by: Major Professor Glynn Tonsor
Copyright
GRACE TUCKERAbstract
Accessing new management information is crucial for the effective management of an operation in any industry. Beef producers are no exception to this as producers are exposed to numerous risks. The use and implementation of new management information by producers can assist in managing the operation to limit a producer’s risk exposure. The beef industry in the United States today is comprised of a large number of small producers, and operations can be categorized into three segments - cow-calf, stocker/backgrounder and feedlot. Identifying and understanding the characteristics of beef producers assists in the effective design, development, and delivery of educational materials and new information.
In 2008, a National Stocker Survey was conducted to collect data from producers nationwide on operation characteristics and production practices as they related to the stocking and backgrounding of calves. The survey was comprised of 10 areas which focused on all aspects of production during the stocker phase. Included in the survey was a section on
communication and education, where producers were asked to indicate their level of trust for the 14 sources and 11 methods where by management information might be accessed.
The primary objective of this thesis is to identify specific producer and operation
characteristics that are key drivers of producer trust for a number of sources and methods where producers may access management information. The factor analysis procedure was utilized to determine the underlying common factors which represented the sources and methods that are used to access management information. Multivariate tobit regression analysis was used to determine the influence producer, operation, and management characteristics had on trust for the underlying factors which represent the sources and methods of information.
Summary statistics from this research provide relevant information and show the average level of trust survey respondents have in the sources and methods included. While the models were unable to identify key producer, operation, and management characteristics that are significant drivers of trust, the results of these models do provide insights that may be useful in guiding future research. Producer trust for a number of the sources and methods will likely continue to shift as new technology continues to be integrated into the beef operations and new information is discovered.
iv
Table of Contents
List of Figures ... vi
List of Tables ... vii
Acknowledgements ... viii
Dedication ... ix
Chapter 1 - Introduction ... 1
1.1 - Background on Information Importance ... 1
1.2 – Objectives ... 6
1.3 – Organization of Thesis ... 7
Chapter 2 - Literature Review ... 8
2.1-Introduction ... 8
2.2 – Management Information Access ... 8
2.3 - Summary ... 16
Chapter 3 - Survey and Data Summaries ... 17
3.1 - Introduction ... 17
3.2 - Survey Contributors and Data Collection ... 17
3.3 - Cattle Management and Operation Practices ... 20
3.4 – Health Management Section ... 28
3.5 – Communication and Education Section ... 30
3.6 – Supplemental Survey Results ... 34
3.7 – Summary ... 38
Chapter 4 - Analysis and Results ... 39
4.1- Introduction ... 39
4.2 – Statistical Significance of the Means ... 39
4.3 – Factor Analysis ... 42
4.5 – Producers Trust in Sources of Accessing Management Information: Model Specifications ... 50
4.6 - Producers Trust in Methods of Accessing Management Information: Model Specifications ... 65
v
4.7 – Summary ... 77
Chapter 5 - Conclusions ... 78
5.1 – Summary of Study ... 78
5.2 – Limitations of Study ... 79
5.3 – Suggestions for Future Research ... 80
References ... 82
Appendix A - National Stocker Survey ... 85
Appendix B - Supplemental Survey ... 91
Appendix C - National Stocker Survey (Question #62) Tests of Statistical Significance ... 92
Appendix D - K-State Conferences Survey (Question #2) Tests of Statistical Significance ... 93
Appendix E - National Stocker Survey (Question #63) Tests of Statistical Significance ... 94
Appendix F - K-State Conferences Survey (Question #3) Tests of Statistical Significance ... 95
vi
List of Figures
Figure 3-1. Operation Classification ... 23
Figure 3-2. Respondent’s Management Title... 24
Figure 3-3. Age of Respondents ... 25
Figure 3-4. Percentage of Annual Gross Income from Stocker/Backgrounder Operation ... 26
Figure 3-5. Years Actively Purchased/Managed Stocker/ Backgrounder Cattle ... 27
Figure 3-6. Frequency a Producer Consults with a Veterinarian ... 29
vii
List of Tables
Table 3-1. National Stocker Survey Response Rate ... 19
Table 3-2. Management and Operation Summary Statistics ... 21
Table 3-3. Number of Head Owned/Managed (2002-2006) and Expected Number of Head (2007-2008) ... 28
Table 3-4. Health Section Summary Statistics ... 28
Table 3-5. Communication and Education Section Summary Statistics ... 31
Table 3-6. Level of Trust for Sources by Percentage of Respondents ... 33
Table 3-7. Level of Trust for Methods by Percentage of Respondents ... 34
Table 3-8. Supplemental Survey Summary Statistic ... 35
Table 3-9. Level of Trust for Sources by Percentage of Respondents ... 37
Table 3-10. Level of Trust for Methods by Percentage of Respondents ... 38
Table 4-1. Eigenvalues of the Correlation Matrix for Question 62 (Sources) ... 44
Table 4-2. Rotated Factor Pattern for Question 62 (Sources) ... 45
Table 4-3. Eigenvalue of Correlation Matrix for Question 63 (Methods) ... 47
Table 4-4. Rotated Factor Pattern for Question 63 (Methods) ... 48
Table 4-5. Likelihood Ratio Test Results ... 56
Table 4-6. Model Fit Test Results (McFadden's Adjusted Pseudo-R2) ... 57
Table 4-7. Multivariate Tobit Model Results for Sources ... 60
Table 4-8. Likelihood Ratio Test Results ... 70
Table 4-9. Goodness of Fit Test Results (McFadden's Adjusted Pseudo R-Squared) ... 71
Table 4-10. Multivariate Tobit Model Results for Methods ... 73
Table C-1. Paired T-Test for Question 62 (Sources) ... 92
Table C-2. Wilcoxon Signed-Rank Test for Question 62 (Sources) ... 92
Table D-3. Paired T-Tests for Question 2 (Sources) ... 93
Table D-4. Wilcoxon Signed-Rank Test for Question 2 (Sources) ... 93
Table E-5. Paired T-Test for Question 63 (Methods) ... 94
Table E-6. Wilcoxon Signed-Rank Test for Question 63 (Methods) ... 94
Table F-7. Paired T-Test for Question 3 (Methods) ... 95
viii
Acknowledgements
I would first and foremost like to thank my major professor Glynn Tonsor, for his assistance throughout my entire research project. Without his invaluable guidance and assistance, this research project wouldn’t have been possible. His time, support, and encouragement were greatly appreciated, and reminded me that this research project was a learning experience. I would also like to recognize and thank the members of committee Kevin Dhuyvetter and Michael Langemeier. Their willingness to serve on my committee and provide guidance throughout my research project was greatly appreciated.
I would also like to recognize and acknowledge the love and support that my parents have shown to me throughout my academic endeavors. My parents have taught me the value of hard work and dedication, and for this I will be forever grateful. Their support and
encouragement have continually motivated me to pursue my goals and dreams. I would also like to recognize and thank my friends for always being willing to listen and provide me with an encouraging word.
Finally, I would like to thank my fellow graduate student colleagues. Their support and suggestions kept me motivated and reminded me that this entire process was a learning
experience. The friendships and laughter I have been able to share with my colleagues along this journey have truly been appreciated.
ix
Dedication
Growing up a on small family farm I learned the value of hard work and dedication from my parents. This work is dedicated to my parents Ed and Peggy for always believing in me, encouraging me throughout my academic endeavors, and for instilling a passion for the beef industry in me.
1
Chapter 1 - Introduction
1.1 - Background on Information Importance
"Knowledge is of two kinds: We know a subject ourselves, or we know where we can find information about it." These are the remarks of Dr. Samuel Johnson, an English writer, who commented on the importance of knowledge and our ability to find new information. This statement can be translated to reflect the importance knowledge and information have for producers when making management decisions. Obtaining and accessing information assists producers in making effective management decisions.
On many operations knowledge of management practices is often passed down from generation to generation. Producers sometimes make management decisions based on knowledge they gained from the generation before them, who passed the livestock operation down to them. While production skills can be learned from previous generations, incorporating information that is being discovered through research is important. Accessing new information plays a pertinent role in the adoption of new technology and management practices.
Producers today face a broad array of risks and management decisions related to the operation. Decisions may be made following advice from other producers, information gained through educational materials, and outreach programs. Useful new information related to management, financial risk, nutrition, marketing, and other topics related to beef enterprises is discovered daily through research. Disseminating new information and conclusions from research is a crucial step in the process. Several institutions and organizations across the United States are charged with communicating new information to the public. Recognizing the sources and methods producers use to access new information, aids educators in the effective
development and delivery of educational materials and programs.
Beef producers may rely on multiple sources to access new management information. The type of information a producer wishes to access may influence the source a producer uses to locate the information. Sources producers will possibly use to access new management and technology information from include: sales representatives, veterinarians, order buyers and other producers. The level of trust a producer associates with each source will affect which source they consult for new information. The type of source producers’ use to access new information likely varies across different types of operations.
2
Producer and operation characteristics likely will affect a producer’s choice in accessing new information. A producer who operates a cow-calf operation and sells calves at weaning will perhaps access and use management information differently than a producer who operates a cow-calf and stocker operation where calves are retained beyond weaning. Producers who derive a larger share of personal household income from the beef operation likely will dedicate further time to accessing new information. Dedicating additional time to accessing new management information will assist a producer in the adoption of new management practices or technology. The amount of time a producer devotes to searching for new information likely will be
influenced by whether or not the operator is employed off the farm. Consideration to the length of time a producer has spent raising cattle likely will influence a producer’s decision to access new information. Additionally, producers who are decreasing the size of their operation may access new information differently. While the access of new information does not guarantee the successful adoption of new practices, accessing new information is critical. Accessing new information may be vital in the effective management of the operation.
Besides understanding the sources producers utilize to gather new information, a producer may have a preference regarding the method in which they receive new information. Understanding the methods producers use to access new information is an important
consideration for educators when designing, developing, and delivering educational resources and outreach programs.
There are several methods educators utilize to communicate new information to
producers. Typical methods used for delivering or providing access to new information include, workshops, meetings, print publications, and online. Producers trust for a specific method of accessing new information will depend on how comfortable a producer is accessing information using this method. While the utilization of technology by producers on many operations has increased in the last decade, examining producers trust for electronic forms compared to published forms of accessing information could assist educators with the delivery of new management information. Consideration to the methods producers have preference for
ultimately will increase the effectiveness of all educational materials and programs. Accessing new information is important for producers involved in any segment of cattle production.
Cattle production in the United States is typically categorized by three phases of production that includes cow-calf, stocking or backgrounding, and finishing. The
3
stocker/backgrounding growing phase of cattle production is an integral phase in cattle production, as calves are placed into intensive growth programs to prepare them to enter the finishing phase. Proper nutrition and health management during the stocking segment of production is essential for insuring calves are ready to enter the feedlot system. As cattle
production has experienced increasing input costs, effective management practices have become even more important in managing the costs of production and maintaining profitability. Besides being confronted with rising production costs, stocker producers traditionally have had a small margin window to earn a profit (Peel, 2006). This referring to the small profit margin occurring between the initial purchase price and the price the animal will sell for as a feeder (Peel, 2006). Therefore, managing input costs and financial risk through effective management decisions is crucial. Through the access of new information on technology and management practices, producers can make informed management decisions.
1.1.1- Characteristics of Beef Producers
The characteristics of beef operators in the United States were analyzed as part of USDA-ARMS survey in 2008. Three different types of producers were considered to reflect the types of production beef producers are involved in. The three types of producers included were cow-calf, cow-calf/stocker and cow-calf/feedlot producers. Cow-calf operators were found to be the oldest age group of the three types considered. The average age for cow-calf producers was 61 years, compared to 59 years for cow-calf/stocker operators, and 56 years for calf/feedlot operators (USDA-ARMS, 2008). The cow-calf producers also comprised the largest percentage of producers over 65 years of age (42%) compared to cow-calf/stocker (34%) and cow-calf/feedlot (21%) producers.
The survey also considered whether producers were employed by an off-farm job and their level of education. Over 40% of cow-calf operators indicated they worked off the farm in 2008 (USDA-ARMS, 2008). This was compared to 34% and 20% of calf/stocker and cow-calf/feedlot producers, respectively. Only 23% of cow-calf operators had completed college compared to 29% and 27% of cow-calf/stocker and cow-calf/feedlot operators, respectively (USDA-ARMS, 2008).
4
1.1.2 - Defining Stocker Producers
Beef calves are typically weaned at 400 to 700 pounds. Following weaning most calves will enter a growth program to prepare them to enter the finishing phase of production. The size of the calves at weaning will influence the type of preconditioning operation they will enter. Preconditioning refers to the vaccination, nutrition and health management program young calves enter following weaning. In a recent study of cow-calf operations in the United States, about 60% of the operations marketed cattle at weaning or shortly after (McBride and Matthews, 2011). In the National Animal Health Monitoring System (NAHMS) survey, half of the cow-calf operations surveyed indicated they sold calves at weaning (USDA-APHIS, 2010a).
While some cow-calf producers retain calves through the growing phase, many producers will sell calves at weaning. Young calves sold following weaning typically enter a stocker operation prior to entering the feedlot. A stocker or backgrounder producer is defined as a person who raises cattle from approximately 400 to 800 pounds. Stocker producers will then either sell calves prior to entering the finishing phase of production or retain ownership into the feedlot.
The terms stocker or backgrounder producer refer to producers involved in the growing phase of production. These terms are used to refer to different methods of preparing cattle to enter the finishing phase. Stocking and backgrounding programs vary widely across the country depending upon feed resources available in the region and season of the year. Stocker calf diets will include a combination of warm and/or cool season forages, concentrates, and mineral supplements to meet the nutritional needs of the animal to achieve growth (Peel, 2003). These growth programs are designed to prepare the animal to enter the finishing phase of production as a feeder calf. (Peel, 2003)
1.1.3 – Stocker Production in the United States
Data collected during the 2007 Census of Agriculture indicated there were 2.2 million farms in the United States of which about 35% (765,000) had beef cattle (USDA-ERS, 2007). The United States beef cattle industry encompasses a large number of small farms. Data from the 2007 Census of Agriculture revealed that over 50% of these beef enterprises had fewer than
5
20 head of cattle (USDA-ERS, 2007). The 2007 Census also revealed that about 612,000 (80%) of farms had fewer than 50 head of beef cows.
A 2008 study of beef producers by the USDA-ARMS focused on beef operations that consisted of more than 20 head of beef cows. This resulted in a 53% reduction in the number of beef cattle enterprises as reported in the 2007 Census of Agriculture (USDA-ERS, 2007). In the 2008 study, beef producers were classified into three production segments - calf only, cow-calf/stocker and cow-calf/feedlot. As a result, approximately 360,000 beef operations were included in the 2008 survey of operations with herds larger than 20 head. Of the 360,000 surveyed, 47% were cow-calf operations, 44% cow-calf/stocker and 9% were cow-calf/feedlot operations (USDA-ARMS, 2008).
A large number of the beef operations were considered cow-calf/stocker operations (USDA-ARMS, 2008). The average peak inventory for cow-calf/stocker operations was 123 head of beef cows and 88 calves weaned in 2008, which was shown to be statistically different from the group classified as cow-calf only operations (USDA-ARMS, 2008). The cow-calf operations on average had a peak inventory of 79 head of beef cows and weaned 57 calves (USDA-ARMS, 2008). The total value of farm production was the largest for cow-calf/feedlot operations and averaged about $280,000 in 2008 (USDA-ARMS, 2008). However, the total gross cash income for cow-calf/stocker operations was $143,793 and $62,384 (43%) came from the beef enterprise (USDA-ARMS, 2008).
Animal health management is extremely important to stocker and backgrounding producers. Stocker calves may be exposed to several stressors prior to arrival at a stocking or backgrounding operation. These stressors may include, but are not limited to, being shipped significant distances, sold through multiple auctions, commingled with groups of cattle from other regions, or improper management. Some producers will immediately run calves through an intensive receiving program. A receiving program is the manner in which producers handle cattle upon their arrival at the operation. Some producers will then immediately place the animals on a vaccination program, often times developed following consultation with a
veterinarian. The receiving program is designed to deliver intensive health management to the calves upon arrival at the operation to prevent diseases caused by stress and bacteria while the animal has a weakened immune system due to a wide variety of stressors.
6
1.2 – Objectives
The main objective of this research is to understand how producer and operation
characteristics relate to the level of trust a stocker producer has for various sources and methods new information may be accessed from. Understanding the characteristics of how a producer’s level of trust varies will facilitate the design, development, and delivery of new information. Specific objectives include the following:
1. Identify the demographic characteristics of stocker and backgrounding producers. This includes age, off-farm employment, income derived from the cattle operation, the number of years producers have either owned or managed cattle, operation size, segment of production, and type of operation.
2. Determine if producers’ average trust in management information significantly varies between sources. Additionally, determine if specific operation characteristics impact a producer’s level of trust in a source for obtaining management information.
3. Determine if producers’ average trust significantly varies across methods of receiving management information. Additionally, determine the impact specific operation characteristics have on producers’ level of trust for each method.
To accomplish the objectives outlined above, data collected from the National Stocker Survey and a supplemental survey of Kansas beef producers will be analyzed. The National Stocker Survey instrument was developed by BEEF magazine. The smaller supplemental survey was developed for the purpose of this research and distributed to Kansas beef producers and related industry personnel at conferences held at Kansas State University. The three conferences the supplemental survey was distributed at were the K-State Beef Conference, Risk and Profit Conference, and Stocker Field Day. Data regarding producers’ trust for sources and methods of receiving management information were focused on in the surveys. The overarching goal of the research was to determine if there were differences in the producers’ level of trust for various sources where management information is accessed. Along with examining differences in producers’ level of trust for sources of information, differences in producers’ level of trust for methods through which management information is obtained was analyzed.
7
Research and data collected within the stocker/backgrounder segment of the beef industry are fairly limited. Many of the studies that have been conducted within the beef industry have focused on the cow-calf and feedlot sectors of the industry. The lack of research conducted within this segment of the industry may partially be due to the difficulty of defining
stocker/backgrounder producers, partially due to the variations in the weaning time of calves. The USDA has limited data regarding the number of stocker/backgrounder producers there are in the United States. Furthermore, it is difficult to estimate the number of stocker/backgrounder producers because many producers’ decisions to retain ownership of calves following weaning will vary from year to year, and may be dependent on available feed resources or market prices, among other possibilities.
Findings and information discovered through this research will benefit sales representatives, extension faculty and programs, and others who wish to communicate new information to cattle producers. Extension faculty and programs benefit from the research as it aids in the design and development of educational programs and materials. This research will ultimately help companies and organizations with the effective design, development, and delivery of new information. This research will hopefully be able to contribute to and expand upon the current knowledge available on stocker/backgrounder producers.
1.3 – Organization of Thesis
The thesis will be organized into 5 chapters. This chapter provides an introduction and overview to the layout of the thesis. Chapter 2 focuses on the review of literature as it pertains to this research project. Previous studies will be examined that relate and facilitate in the
understanding of the sources and methods producers utilize to access new management information. Characteristics that influence producers in the adoption or non-adoption of management practices as they pertain to variables used in this study will also be covered. Chapter 3 focuses on the data sources and presents the summary statistics and results from the survey instruments used. The summary statistics for all of the relevant survey questions will be presented following the order they appeared on the survey instruments. Chapter 4 is devoted to presenting the results of the analysis procedures. Definitions of variables used in the models will also be discussed. Chapter 5 will focus on the implications of this study and the conclusions.
8
Chapter 2 - Literature Review
2.1-Introduction
This chapter will provide a review of literature related to the use of information by beef producers. Particular focus will be given to the review of the sources and methods producers use to access new information. The literature will cover how farm and operator characteristics impact the sources and methods producers use to access new management information. Literature regarding computer and internet usage by producers related to the access of new information will also be covered. The literature reviewed will show the impact information has on the adoption and non-adoption of technology and management practices.
2.2 – Management Information Access
2.2.1- Sources and Methods of Management Information
The cooperative extension service was formally created under the Smith-Lever Act of 1914, and served as a way for land-grant universities to educate the people of society through the research being conducted at the universities. The extension service has worked to serve the public through formal and non-formal educational programs, publications, and specialized expertise in areas of crop and livestock production, economics, finance, consumer sciences and 4-H programs. A large focus of the extension service has been on serving the needs of
agricultural operators. Some farm operators may utilize the extension service as a primary source for accessing new information. The extension service is generally very accessible to farmers, because a majority of states maintain an extension office in every county. The level of services offered and expertise of the staff does vary by location. Additionally, while there are variations in the expertise of the staff by location, perceptions of the extension service may vary by geographic location. While extensive research on the value of the extension service to producers has not been conducted, some research in this area has been done. Some researchers have attempted to identify factors that impact sources and methods producers utilize to access new information.
9
The University of Florida extension service examined the characteristics of small farm operations and their preferred information sources and channels for receiving information (Gaul et al., 2009). The survey used in this research examined characteristics related to farm size, gross annual farm income, and the number of years producers had been farming. The extension service felt that there was a definite need for information targeted at small farmers. By
understanding the demographics of small farmers, research information could be directed specifically to meet the needs of these operators.
Previous research conducted in Florida found that producers typically relied on multiple sources for attaining new information (Vergot et al., 2005). While some producers were not aware of the education opportunities available through the Cooperative Extension Service, many producers indicated they were utilizing and benefiting from the information provided by the Extension Service. Understanding the characteristics of producers utilizing the Extension
Service and those not using it, allows extension educators to develop programs and tools to better reach producers. Research in the Florida area showed that extension programming and
information needed to be provided through several channels to reach the targeted audience (Gaul et al., 2009).
Many of the producers indicated they strongly preferred traditional methods of information delivery. Producers surveyed in the 2008 survey indicated they used county meetings/field days the most and found them to be helpful (Gaul et al., 2009). Several of the producers in the survey utilized local county extension newsletters and information found in extension publications. A majority of producers in the survey did not use the Florida extension service websites to obtain information (Gaul et. al, 2009).
Gaul et al. (2009), asked producers to indicate how often they relied on and used a number of sources to access new information. The three sources most relied on by respondents included, other farmers (25%), commercial publications (23%), and direct contact with extension agents (23%). The survey also considered producers preferences for timing of educational programs and producers’ willingness to travel to attend extension program (Gaul et. al, 2009).
As the economy has forced budgets to be reduced, the need and value of maintaining an extension office in every county has been questioned. As options must be considered to handle a tightening budget, the consideration of levying taxes to support and maintain local extension offices has been considered in some areas. In a recent survey, farmers’ willingness to trade
10
distance and taxes was examined as respondents selected between a number of staff and office design profiles (Diekmann et al., 2012). The responses were split into small and large sized operations. Large sized farms ($100,000-$499,999 and $500,000 and larger) had a stronger preference for local extension offices over small sized farms. Results indicated small farm operators were less likely (4.20%) to select an extension office staffed with a specialist compared to the large farm operators. The large farm operators were 4.40% more likely to select an
extension office staffed with a specialist with advanced expertise on a subject. Furthermore, a farmer’s likelihood of selecting an office increased when the office was shared with additional services (USDA offices or meeting places). For both small and large sized farms, the presence of the extension office being located in a building that was shared with other services was positive and significant. The distance of the extension office from the farm was also considered, to understand farmers’ willingness to trade distance and expertise level of office staff. The researchers related distance with the additional services and advanced expertise variables and neither were significant for small or large sized farms. Farmers also indicated a willingness to pay additional taxes to support the extension office. In return farmers expected the wealth of educational programs and services provided to increase (Diekmann et al., 2012).
Galindo-Gonzalez and Israel (2010) used a questionnaire to collect data on usage and overall satisfaction of extension services. Three main attributes related to extension were included in the questionnaire: quality of experience, outcome of the experience, and
demographic attributes of the respondents. These attributes were examined as they related to delivery methods used by the extension service. Respondents with a higher education level preferred individual, higher cost methods of contact as compared to respondents with only some high school or high school graduates. Age of participants was significantly associated with the type of contact that respondents had with the extension service. Younger respondents (less than 35 years of age) were more likely to attend planned programs as compared to visiting or calling the extension office. Older respondents (65 years and older) preferred personal contact with extension personnel via telephone calls or office visits as compared to younger respondents (Galindo-Gonzalez and Israel, 2010).
11
2.2.2 - Computer and Internet Usage by Producers
A study conducted in the southeast between university and extension personnel at land grant institutions in 2003 examined the use of computers and the internet by producers. The survey targeted two distinct groups, beef and peanut producers. The sample was comprised of the leaders in each respective industry. The survey focused on how producers accessed new information related to the business (Hall et al., 2003). The survey respondents were placed into one of five diffusion-adoption stages considered by the researchers. These five stages included: innovators, early adopters, early majority, late majority, and non-adopters.
The results indicated that slightly over 40% of the survey participants were using the internet to search for farm business information. This group of producers was considered to be innovators or early adopters for using the internet to acquire information related to the farm business. Producer age was the leading factor found to influence computer and internet adoption among respondents (Hall et al., 2003). About 25% of the producers were non-adopters and did not have access to a computer either at home or work. Another 22% of the sample was late majority stage adopters; which meant this group had access to a computer on a regular basis but did not have an internet connection.
Respondents were asked to indicate the highest level of education completed. Previous research has indicated education level has an influence on computer and internet usage by producers (Rogers, 1995). Producers in the innovator and early adoption categories were most likely to have completed a college education. However, it was surprising to also find that several of the respondents who fell into the late majority category were also college graduates. This suggested education was likely not a sole determining factor in adoption behaviors of the respondents in this survey (Hall et al., 2003).
The sample respondents were grouped into three age categories. The categories included were: 18-44, 45-54, and 55 years and older. These categories were chosen due to the age
distribution of respondents comprising the sample. Choosing these age categories was not surprising since the sample consisted of farm industry leaders. In the survey 52% of the early adopters group was under the age of 45 and using the internet for the farm business.
Additionally, 58% of the innovators group was using the internet for the farm business and was under the age of 45. Therefore, age was considered to be a contributing factor in the adoption practices and the use of the computer and internet for farm business (Hall et al., 2003).
12
2.2.3 – Producer Willingness to Pay for Information
Agribusiness organizations often use willingness to pay (WTP) estimates as a
measurement for estimating consumer demand in the market. Calculation of producers WTP estimates can be particularly useful in estimating the demand for a new product or service. While a majority of WTP experiments focus on consumer demand for a good or service, a similar approach can be used to estimate producers’ WTP for goods and services. Estimating producers’ WTP for products, services, or information can be very useful for feed and
pharmaceutical companies who are engaged in direct selling to producers; this is done using a profit maximization function subject to a production function constraint (Lusk and Hudson, 2004).
Some previous studies have examined producers’ WTP for the use of services,
information, and decision aids. For crop producers, weather information can be invaluable as a decision aid regarding planting, pesticide application, and harvest. Using weather information as the focus, Kenkel and Norris (1995) estimated producers’ WTP for mesoscale weather
information since weather can have devastating impacts on crops. The results indicated farmers’ WTP for weather data was very low (Kenkel and Norris, 1995). The variables that represented money spent on agricultural publications, full versus part-time operations, gross sales, use of irrigation, and weather-related crop income losses all significantly impacted producers’ WTP for raw data weather information. Part-time farmers were willing to pay more (about $0.55) for mesoscale weather information, and farmers with higher gross sales were only willing to pay about $0.01 more for raw weather data (Kenkel and Norris, 1995).
Kenkel and Norris (1995) also considered producers’ WTP for raw data with value added information. For the model with value added information, gross sales, use of irrigation, and weather-related crop income losses were significant. While these variables were significant, the impact that each variable had on producers’ WTP for the data was small. While the focus of this study was on producers’ WTP for weather information, similar implications are likely regarding producers’ WTP for management information. The results suggested producers will likely access and use available information, and they prefer to access it at little or no charge.
13
2.2.4 – Information Influence on Consumer Behavior
Numerous studies in the past have analyzed consumers’ willingness-to-pay (WTP) based on information presented to the consumer. In a recent WTP consumer based study, consumers WTP for nanotechnology in orange juice was measured (Roosen et al., 2011). Consumers were asked to indicate their WTP for orange juice fortified with vitamin D using nanotechnology processes. Consumers were provided information in three areas linked to nanotechnology. The three areas included health, society, and environment. Three consumer groups were considered in the study and different methods of information access were imposed on each group.
When consumer groups were allowed to choose the order in which information was imposed, a preference for information related to health compared to societal and environmental information was evident (Roosen et al., 2011). This indicated that the type of knowledge provided by the information and the condition the information was accessed under affected the value consumers had for the information (Roosen et al., 2011). As a result, specific types of information influence consumers’ decisions in different ways.
While a majority of studies related to WTP based on information imposed are limited to consumer behavior; these studies may likely have similar implications related to a producer stand point. Similar effects regarding the order information is imposed and the effects this would have on producers’ decisions is likely consistent. Information on a particular topic may vary in relevance for different types of producers. The order new information is imposed may likely affect producer decision-making related to the adoption of new technology. The information could potentially influence producers WTP for the adoption of new technology. While a
majority of this type of research has focused on consumer behavior, similar implications are like evident for producers.
2.2.5 – Adoption and Non-Adoption of Management Practices
Access to management information in previous studies was shown to influence the adoption of management practices and new technologies. Several studies have examined producer characteristics and the influence they have on the adoption of best management practices. A producer’s decision to adopt specific recommended or best management practices may be influenced by several factors. Producers’ decisions associated with the adoption of
14
management practices have several implications for educators. Understanding the effect specific producer characteristics have on the adoption of new management practices and technology aids educators in the development of educational materials. Several studies have noted the significant impact information access has on producer decision making.
In one study, income was shown to influence a producer’s decision in the adoption of range management practices (Kim, Gillespie, and Paudel, 2004). A positive relationship between household income generated by the agricultural operation and the likelihood to adopt recommended management practices has been seen in several studies. In a recent study of Oklahoma producers, how dependent a producer was on the income generated by the operation was significant (0.01 level) in the adoption of management practices related to stocking rates, marketing lot types, the use of risk management tools, and the development of a business plan (Johnson et al., 2010).
Examining the effect farm size, producer education, and age have on the sources and the methods a producer uses to access information provides insight into the factors that affect farm adoption of practices. The size of an operation and the profitability of adopting management practices influence most producers’ adoption decisions. Specifically, farm size in several studies has impacted producers’ decisions on management practices. In a survey of Oklahoma beef producers, both farm size and education level had a positive impact on the adoption of new management practices (Vestal et al., 2006). However, in the same survey age negatively impacted a producer’s decision related to the adoption of management practices (Vestal et al., 2006). The researchers felt information regarding the influence these characteristics had on producers’ adoption of management practices provides educators with a better understanding of how to package information and target specific groups of producers (Vestal et al., 2006).
In a recent survey of Oklahoma stocker producers, the level of education a producer had attained significantly influenced their decision to adopt three of the six management practices measured in the assessment. A producer’s level of education was shown to be statistically significant (0.05 level) and have a positive impact on the use of implants by stocker operations (Johnson et al., 2010). For producers who attended some college or were college graduates, education was statistically significant (0.05 level) and had a negative impact on their decision to use risk management tools (Johnson et al., 2010). For the producers who had some college education but had not earned a degree, education was statistically significant (0.10 level) in the
15
development of a business plan (Johnson et al., 2010). Farm size was significant in the adoption of five of the six management practices considered. Three levels of farm size were measured; small (less than 100 head), medium (100-500 head), and large (more than 500 head). In this case, size significantly influenced medium sized operations in the adoption of management practices related to stocking rate (0.05 level), intramuscular injections (0.05 level), marketing lot type (0.05 level), and risk management tools (0.01 level) (Johnson et al., 2010). Farm size was a significant factor in the adoption and use of implants (0.05 level), stocking rate (0.05 level), marketing lot type (0.05 level), and risk management tools (0.05 level) for large operations (Johnson et al., 2010). Operator age was significant in the adoption of three of the six
management practices. For producers who were 50 years old or older, age was significant and had a negative impact on their likelihood to adopt recommended management practices related to intramuscular injections (0.10 level), marketing lot types (0.05 level), and development of a business plan (0.01 level) (Johnson et al., 2010).
Understanding the impact farm characteristics have on the adoption of management practices benefits educators and assists in the design, development, and delivery of education materials. Understanding the lag associated with the implementation and adoption of
management practices on beef enterprises allows educational programs to be tailored to specific groups of producers. These findings have allowed educators to recognize the differences associated with preparing these educational programs materials for various producer groups. Overall, each of these studies has demonstrated the importance access to new information has on the adoption of management practices and new technology.
While numerous studies have considered characteristics that affect the adoption of
management practices and technology, several studies have examined the reasons why producers choose not to adopt recommended management practices. In the case of some operations the adoption of certain technology or management practices may not be economically feasible or not applicable to the operation. Yet on many operations a lack of knowledge, information, and education have been linked to non-adoption. In some studies producers have been asked to identify their reasons for not adopting best management practices. One of these studies focused on the reasons beef producers chose not to adopt 16 best management practices. The second most cited reason for non-adoption was unfamiliarity with the practices, which was also linked with less contact with agricultural organizations (Gillespie, Kim and Paudel, 2003). This
16
response suggested a disconnect existed between the research and information that reached producers. This study also linked a low income dependency by the producer on the operation, a lack of higher education, and little contact with educational outreach programs as other reasons for non-adoption of best management practices (Gillespie, Kim and Paudel, 2003).
2.3 - Summary
Exposure to new information has been revealed in several studies as a crucial link in the adoption of new management practices and technology. Understanding the sources and methods beef producers employ to acquire information allows for effective distribution of new
information. Understanding how producers use different sources and methods to acquire management information allows materials and educational programs to be developed to better meet the needs of the specific types of producers who utilize them. Recognizing how specific types of producers access and utilize information, allows for the targeted delivery of new information, and research findings. Effective communication of new information assists producers with the adoption of new technology, recommended management practices, and in making decisions that ultimately affect the profitability of their operations. Relating the characteristics of the operations to the trust producers have for sources and methods where management information will be accessed benefits educators. Efficient dissemination of management information assists educators and others in developing, directing, and delivering pertinent new information to beef producers.
17
Chapter 3 - Survey and Data Summaries
3.1 - Introduction
This chapter will summarize the survey and provide summary statistics for relevant survey questions. Section 3.2 will discuss the organizations who contributed to the survey along with information about the data collection. Sections 3.3 to 3.5 will summarize the data provided in the relevant sections of the survey. The survey questions focused on 10 areas related to stocker/backgrounder management practices. Summary statistics for the questions that will be used in analysis for this research will be provided in the following tables and charts. Section 3.6 will report the summary statistics for the supplemental survey. Section 3.7 will summarize the chapter.
3.2 - Survey Contributors and Data Collection
The 2008 National Stocker Survey was a joint project, primarily between BEEF
Magazine, Elanco, and Kansas State University. Faculty from the Animal Sciences and Industry Department at Kansas State University partnered with representatives from BEEF Magazine and Elanco to make the collection of data possible. A complete copy of the survey questions can be found in Appendix A.
The data collected from this survey provide useful information for each of these partners in different aspects. Each of these partners brings unique interests to the table. BEEF Magazine is a national published magazine focused on beef production. BEEF Magazine publishes issues on a monthly basis, which is received by producers in all areas of beef production as well as beef related industries. BEEF Magazine also publishes several newsletters both electronically and in print that are targeted at specific types of beef producers. BEEF Magazine also maintains a strong presence online in several social media outlets (BEEF Magazine, 2012).
Kansas State University is a land-grant university located in the Midwest. The university has an extensive focus not only on student education, but also on research and extension. The Animal Sciences and Industry and Agricultural Economics departments have faculty members who are dedicated to research and extension. The Kansas State Universities Research and Extension program serves residents in all 105 Kansas counties. The faculty educates residents
18
through the use of extension meetings, workshops, conferences, print publications, electronic newsletters, websites, and online media outlets (Kansas State University, 2012).
Elanco is a global animal health company that is part of Eli Lilly and Company. Elanco serves to improve and enhance the health of animals. The company works to enhance the health of animals, and benefit the lives of people through research and the use of innovative products. The company strives to enhance and improve animal health through safe and environmentally friendly practices. Elanco maintains a customer base that includes veterinarians, farmers and livestock producers, animal nutritionists, pet owners, and consumers. Elanco communicates with their customer base through printed materials, the company website, and online social media services (Elanco, 2011).
In addition to the three main survey contributors, other universities from across the United States provided valuable knowledge, resources, and feedback to make the survey and data collection possible. Representatives from these universities provided their input and knowledge to help make the survey possible. The other university partners included: Auburn University, Iowa State, Mississippi State, North Carolina State, Oklahoma State, Texas A&M, University of Florida, University of Missouri, University of Nevada, and Western Kentucky.
A mailing list for the survey was constructed from a database of producers provided by BEEF Magazine. The survey was mailed to 16,200 producers from all regions of the United States. The surveys were mailed during October 2007, and official data began to be collected by October 31, 2007. A majority of the responses were received by January 3, 2008; about 100 surveys were received after this date. There was a total of 2,248 usable survey responses received (approximately a 13.9% response rate). Survey responses were received from producers in 44 of the 50 United States. Over half of the total responses were received from states located in the Midwest and Southwest regions of the country. Table 3.1 displays which states are represented in the responses from each region, the number of responses received from each region, and the portion of the total responses represented by each region.
19
Table 3-1. National Stocker Survey Response Rate
Region N
Percentage of Total Responses
Midwest (IA, IL, IN, KS, MI, MN, MO, NE, OH, & WI) 614 27.3%
Southwest (AZ, MN, OK, & TX) 566 25.2%
West (CO, ID, MT, ND, SD, & WY) 374 16.6%
Southeast (AL, AR, FL, GA, KY, LA, MS, & TN) 347 15.4%
Far-West (CA, NV, OR, UT, & WA) 194 8.6%
Mid-Atlantic (DE, NC, NH, NY, MD, ME, PA, SC, VA, VT, & WV) 153 6.8%
Total 2248
The survey asked producers to answer questions regarding their operations related to stocking and backgrounding practices. The survey questions were divided into 10 subject areas. These areas included: management/operation, procurement, receiving, receiving
nutrition/management, health, nutrition, marketing, risk management, communication/education, and potential limiting factors. For this particular research project not all of the subject areas addressed in the survey were related and useful. The survey statistics are provided for the relevant questions.
Additional supplemental data was collected during the summer and fall of 2011. The supplemental data was collected using a one page survey that took producers approximately 5-7 minutes to complete. The questions in the survey were similar to questions asked on the 2008 National Stocker Survey. The supplemental survey was distributed at three conferences held on the Kansas State University in Manhattan, Kansas. These conferences included the K-State Beef Conference hosted by the Kansas State Animal Sciences and Industry Department on August 16, 2011; Risk and Profit Conference hosted by the Kansas State Agricultural Economics
Department on August 18, 2011; and Beef Stocker Field Day hosted by Kansas State Animal Sciences and Industry Department on September 22, 2011. Conference attendees at each of the conferences were given the one page survey when they checked-in and asked to return the completed survey to a collection box at the registration table at each conference. A copy of the survey that was distributed is located in Appendix B.
20
The K-State Beef Conference had approximately 70 attendees. A total of 29 usable survey responses were obtained. A majority of the conference attendees responding to the survey indicated they were cow-calf producers. The Risk and Profit Conference had
approximately 110 attendees. The Risk and Profit conference was not specifically focused on the beef industry. As a result the survey did not pertain to as many conference attendees and a fewer responses were obtained. At the Beef Stocker Field Days there were approximately 80 conference attendees. A total of 28 usable survey responses were received. After distributing the survey at the three conferences a total of 91 usable survey responses were received.
3.3 - Cattle Management and Operation Practices
This section covers the questions asked on the National Stocker Survey related to the management and operation practices of the respondents beef enterprise. These questions reflect information related to the characteristics of the operations. The questions, variable definitions and summary statistics are provided in tables. Each survey section used for this research study will appear in separate tables in later sections. Table 3.2 will provide the summary statistics for selected questions from the management and operation practices section of the National Stocker Survey.
21
Table 3-2. Management and Operation Summary Statistics
Survey Question Variable N Most Common Response Mean Standard Deviation Q1 Description of Operation (1=100%
Stocker/Backgrounder, 2= Stocker with Cow/Calf, 3=Stocker/backgrounder with Feedlot, 4= Stocker/Backgrounder with Cow/Calf and Feedlot
2248 2 2.09 0.81
Q2 Off Farm Job (1=No, 2=Yes) 2221 1 1.26 0.44
Q3 Farm Row Crops (1=No, 2=Yes) 2188 1 1.40 0.49
Q4 Run Stockers or Background Cattle Year Round (1=No, 2=Yes)
2179 2 1.54 0.50
Q5 Operator Title (1=Owner, 2=Manager, 3=Owner and Manager, 4=Other)
2238 3 2.08 0.98
Q6 Age of Operator (1=<25, 2=25-34,3=35-44, 4=45-54, 5=55=64, 6=>64)
1987 6 4.70 1.19
Q7 Type of Operation (1=Family, 2=Corporate)
1966 1 1.07 0.25
Q8 Percentage of Annual Gross Income from Stocker/Backgrounding Operation (1=0%, 2=1-25%, 3=26-50%, 4=51-75%, 5=76-100%)
1941 3 3.31 1.07
Q9 Number of Years Purchased/Managed Stockers (1=5 yrs. or less, 2=6-10 yrs., 3=11-20 yrs., 4=21-30 yrs., 5=31-40 yrs., 6=Over 40 yrs.)
1903 3 3.70 1.52
Q10A Stocker/Backgrounders owned/managed in 2002 (1=0, 2=1-199, 3=200-499, 4=500-999,5=1,000-2,499, 6=2,500-4,999, 7=5,000-6,999, 8=7,000-9,999, 9=10,000-19,999, 10=20,000 or more) 2164 7 2.95 1.31 Q10B Stocker/Backgrounders owned/managed in 2003 (1=0, 2=1-199, 3=200-499, 4=500-999,5=1,000-2,499, 6=2,500-4,999, 7=5,000-6,999, 8=7,000-9,999, 9=10,000-19,999, 10=20,000 or more) 2156 2 2.97 1.31 Q10C Stocker/Backgrounders owned/managed in 2004 (1=0, 2=1-199, 3=200-499, 4=500-999,5=1,000-2,499, 6=2,500-4,999, 7=5,000-6,999, 8=7,000-9,999, 9=10,000-19,999, 10=20,000 or more) 2167 2 3.01 1.31
22
Table 3.2. Management and Operation Section Summary Statistics (continued)
Survey Question Variable N Most Common Response Mean Standard Deviation Q10D Stocker/Backgrounders owned/managed in 2005 (1=0, 2=1-199, 3=200-499, 4=500-999,5=1,000-2,499, 6=2,500-4,999, 7=5,000-6,999, 8=7,000-9,999, 9=10,000-19,999, 10=20,000 or more) 2183 2 3.03 1.33
Q10E Stocker/Backgrounders owned/managed in 2006 (1=0, 2=1-199, 3=200-499, 4=500-999,5=1,000-2,499, 6=2,500-4,999, 7=5,000-6,999, 8=7,000-9,999, 9=10,000-19,999, 10=20,000 or more) 2191 2 3.04 1.34 Q10F Stocker/Backgrounders owned/managed in 2007 (1=0, 2=1-199, 3=200-499, 4=500-999,5=1,000-2,499, 6=2,500-4,999, 7=5,000-6,999, 8=7,000-9,999, 9=10,000-19,999, 10=20,000 or more) 2191 2 3.07 1.34 Q10G Stocker/Backgrounders owned/managed in 2008 (1=0, 2=1-199, 3=200-499, 4=500-999,5=1,000-2,499, 6=2,500-4,999, 7=5,000-6,999, 8=7,000-9,999, 9=10,000-19,999, 10=20,000 or more) 1898 2 3.12 1.41
Q14 Average length of time you typically own/manage a group of
stockers/backgrounders (1=30 days or less, 2=31 to 60 days, 3=61 to 90 days, 4=91 to 120 days, 5=121 to 180 days, 6=181 to 240 days, 7=More than 240 days)
2193 5 5.06 1.45
A majority of the producers responding to the National Stocker Survey were cow-calf producers with a stocking/backgrounding operation. This group of producers comprised 1,490 (66.3%) of all of the responses (Figure 3.1). The cow-calf producer category was followed by 402 (17.9%) respondents describing their operations as solely stocker/backgrounder operations. Additionally, 245 (10.9%) operated a stocking/backgrounding operations with a cow-calf and feedlot operations and 110 (4.9%) of respondents operated feedlot with stocker/backgrounding operations.
23
Figure 3-1. Operation Classification
402 1490 110 245 0 500 1000 1500 2000 100% Stocker/ Backgrounder Stocker/ Backgrounder with Cow-Calf Stocker/Backgrounder with Feedlot Stocker/Backgrounder with Cow-Calf and Feedlot
Number of Operations Ty pe s of O pe ra ti ons
The majority of the survey respondents indicated their operations were their source of full-time employment, 73.8% (1,638 of survey respondents) did not have off-farm jobs. A majority of the operations responding to this survey were not diversified crop and livestock operations. Of the producers responding, 60.3% (1,320 of survey respondents) indicated they did not farm row crops. This indicated that producers responding to this survey would possibly engage in more intensive management practices, as more time was focused on the livestock operation. The survey respondents were asked whether they ran stocker and backgrounders year round. Over half (54.5%) of the respondents responded that they ran stockers and backgrounders year round. There were 992 respondents who said they did not run stockers and backgrounders year round on their beef operations.
Respondents were asked to indicate their title with regards to their beef operations. In this sample, 50.6% (1,131 of survey respondents) designated their title as both the owner and manager of the operation. This was followed by 44.4% (991 of survey respondents) indicating their title as the owner of the beef operation. Additionally, there were 102 and 14 respondents who specified their title as manager or other, respectively. Other titles respondents specified included administrative and financial. These results are displayed in figure 3.2.
24
Figure 3-2. Respondent’s Management Title
Owner 44% Manager 5% Owner and Manager 50% Other 1%
The majority of the survey respondents were 45 years old or greater. The largest age group participating in this survey identified themselves as 64 years or older (31.6%). The 55-64 years category followed (28.6%), and the 45-54 years of age was the third largest category (23.7%). There were only 14 respondents who indicated they were under 25 years old. Due to the composition of the age of the producers participating in this survey, age will likely have a significant impact on producers trust for the sources and methods considered in the subsequent models. Figure 3.3 displays a breakdown of the producers by the age categories identified on the survey.
25
Figure 3-3. Age of Respondents
< 25 years 1% 25-34 years 5% 35-44 years 11% 45-54 years 24% 55-64 years 29% > 64 years 32%
Most (93.3%) of the participants in this survey described their operation as a family operation rather than a corporate operation. Interestingly, of the producers participating in the survey, 566 of the respondents (29.2%) said that they derived 26-50% of the annual gross income from their stocker/backgrounding operations. The second highest response was 1-25%, with 558 (28.7%) respondents marking this choice. The third highest category was 51-75%, which included 465 responses (24.0%).
26
Figure 3-4. Percentage of Annual Gross Income from Stocker/Backgrounder Operation
0 558 566 465 352 0 100 200 300 400 500 600 0% 1-25% 26-50% 51-75% 76-100% N um be r of P rod uc e rs
Percentage of Annual Gross Income
In the survey, the respondents were asked to share how many years they had actively purchased and managed stockers/backgrounders. Given the earlier reported information regarding the age of the producers participating in the survey, it was not surprising to see the highest number of responses, 425 (22.3%) fell within the 11 to 20 years category. This was closely followed by the 21-30 years category (22.1%) and the 31 to 40 years category (18.5%). These three categories combined for 1,197 of the total responses to this question. Since a majority of the survey respondents have over 10 years of experience in this sector of the
industry, this potentially will influence the trust producers have in various sources and methods of management information.
27
Figure 3-5. Years Actively Purchased/Managed Stocker/ Backgrounder Cattle 5 yrs. or Less 10% 6-10 yrs. 12% 11-20 yrs. 22% 21-30 yrs. 22% 31-40 yrs. 19% Over 40 yrs. 15%
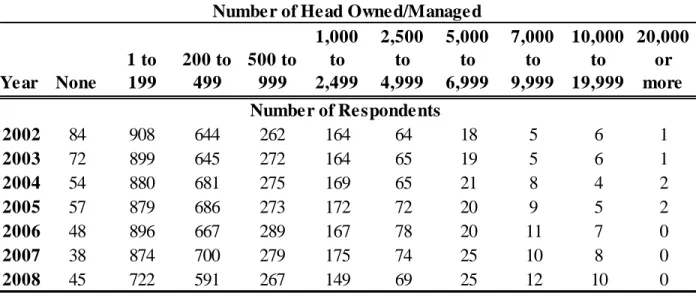
To obtain information regarding the size of the operations participating in the survey, respondents were asked to indicate the number of stockers/backgrounders annually marketed. Respondents indicated the number of stockers/backgrounders they had owned or managed for the five years prior to the survey (2002-2006) and how many they expected to manage for the next two years (2007 and 2008). As table 3.3 indicates, the largest majority of producers responding to the survey owned or managed less than a 1,000 head of stockers/backgrounders. During 2002-2006, over 70% of respondents owned or managed 500 head or less of
stocker/backgrounders. Table 3.3 displays the full results, and the number of respondents who responded to each category regarding the number of head of stocker/backgrounders they owned or managed or expect to own and manage during 2002-2008.
28
Table 3-3. Number of Head Owned/Managed (2002-2006) and Expected Number of Head (2007-2008) Year None 1 to 199 200 to 499 500 to 999 1,000 to 2,499 2,500 to 4,999 5,000 to 6,999 7,000 to 9,999 10,000 to 19,999 20,000 or more 2002 84 908 644 262 164 64 18 5 6 1 2003 72 899 645 272 164 65 19 5 6 1 2004 54 880 681 275 169 65 21 8 4 2 2005 57 879 686 273 172 72 20 9 5 2 2006 48 896 667 289 167 78 20 11 7 0 2007 38 874 700 279 175 74 25 10 8 0 2008 45 722 591 267 149 69 25 12 10 0
Number of Head Owned/Managed
Number of Respondents
3.4 – Health Management Section
This section covers the questions asked on the health section of the survey. Respondents were asked questions regarding their decisions related to health management of their beef operations. The questions in this section focused on producers’ use of veterinarians,
vaccinations, implants, and the handling of illness. Summary statistics provided in this section cover questions used in later analyses and are provided in table 3.4.
Table 3-4. Health Section Summary Statistics
Survey Question Variable N Most Common Response Mean Standard Deviation Q44 Consult with Veterinarian (1=Never.I
don't use a veterinarian, 2=Only in an emergency, 3=Once a year, 4=A couple times a year, 5=Once a month, 6=On every group of cattle)
2030 4 3.73 1.44
29
In the health management section of the survey, respondents were asked specific questions regarding their use of implants and specific vaccines among several other questions related to health management. Survey respondents were asked how frequently they consulted a veterinarian regarding questions related to health management. The largest portion of the respondents indicated they consulted with a veterinarian a couple times a year (35.4% of respondents). The second highest response choice was only in an emergency (30.4% of respondents). Figure 3.6 represents how frequently producers who responded to the National Stocker Survey consulted a veterinarian.
Figure 3-6. Frequency a Producer Consults with a Veterinarian
Never 2% Only in an emergency 30% Once a year 2% A couple times a year 36% Once a month 17% On every group of cattle 13%
Vaccinating cattle is very important for managing their health and maintaining performance. Even though a majority of the respondents to the National Stocker Survey indicated they only consulted a veterinarian a couple times during the year or only in an emergency, a large majority of producers vaccinated their cattle. Of the 2,053 respondents responding to this question, 94.3% of respondents indicated they vaccinated their calves. The results for this question are shown in Figure 3.7.
30
Figure 3-7. Vaccination of Stocker Calves
1937 116 0 500 1000 1500 2000 2500 Yes No Number of Producers V ac ci na te
3.5 – Communication and Education Section
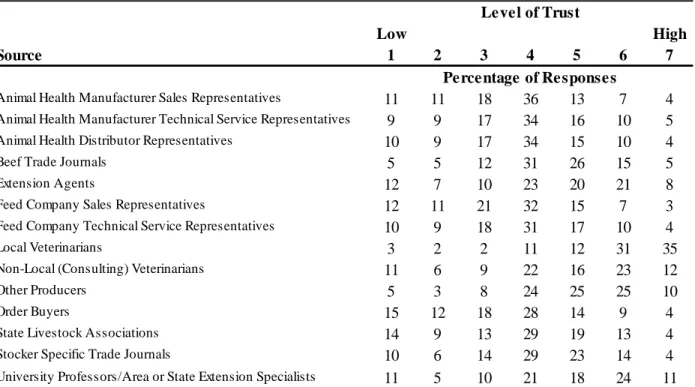
In this section of the National Stocker Survey, respondents were asked questions related to communication and education. As previous studies included in the literature review indicated, exposing producers to new information is critical for the adoption of new management practices and technology. Understanding the level of trust producers have for different sources that they use to acquire management information is important for effective delivery of new information. Survey respondents to the National Stocker Survey were asked to indicate their level of trust for 14 sources and 11 methods for receiving stocker management information. Using a 1 to 7 (low to high) Likert scale, producers indicated their level of trust for each choice. The summary statistics of producers’ responses to the questions regarding their level of trust for the sources and methods are provided in table 3.5.
31
Table 3-5. Communication and Education Section Summary Statistics
Survey Question Variable N Most Common Response Mean Standard Deviation Q62A Trust in animal health manufacturer sales
reprsentative (1=Low to 7=High)
1858 4 3.66 1.51
Q62B Trust in animal health technical service reprsentative (1=Low to 7=High)
1799 4 3.86 1.53
Q62C Trust in animal health distributor reprsentative (1=Low to 7=High)
1787 4 3.81 1.53
Q62D Trust in beef industry trade journal (1=Low to 7=High)
1838 4 4.34 1.43
Q62E Trust in extension agents (1=Low to 7=High)
1820 4 4.27 1.78
Q62F Trust in feed company sales representative (1=Low to 7=High)
1814 4 3.60 1.51
Q62G Trust in feed company technical service representative (1=Low to 7=High)
1739 4 3.81 1.53
Q62H Trust in local veterinarian (1=Low to 7=High)
1964 7 5.78 1.44
Q62I Trust in non-local (consulting) veterinarian (1=Low to 7=High)
1608 6 4.43 1.83
Q62J Trust in other stocker producers (1=Low to 7=High)
1760 6 4.77 1.49
Q62K Trust in order buyers (1=Low to 7=High) 1711 4 3.57 1.64
Q62L Trust in state livestock association (1=Low to 7=High)
1701 4 3.86 1.67
Q62M Trust in stocker specific trade journal (1=Low to 7=High)
1685 4 4.08 1.56
Q62N Trust in university professors/area or state extension specialists (1=Low to 7=High)
1794 6 4.43 1.81
Q63A Trust in email-electronic newsletters(1=Low to 7=High)
1627 4 3.43 1.81
Q63B Trust in face-to-face discussions(1=Low to 7=High)
1817 6 5.05 1.38
Q63C Trust in medium meeting/seminar
(between 10 and 30 participants) (1=Low to 7=High)
1712 4 4.37 1.53
Q63D Trust in large meeting/seminar (more than 30 participants)(1=Low to 7=High)
32
Table 3.5. Communication and Education Section Summary Statistics (continued)
Survey Question Variable N Most Common Response Mean Standard Deviation Q63E Trust in podcasts (from internet) (1=Low
to 7=High)
1518 1 2.90 1.60
Q63F Trust in printed brochure (1=Low to 7=High)
1705 4 3.79 1.47
Q63G Trust in printed magazine (1=Low to 7=High)
1825 4 4.25 1.38
Q63H Trust in printed newsletter (1=Low to 7=High)
1775 4 4.26 1.38
Q63I Trust in printed technical bulletin (1=Low to 7=High)
1704 4 4.26 1.51
Q63J Trust in small meeting/seminar (less than 10 participants) (1=Low to 7=High)
1669 4 4.37 1.61
Q63K Trust in website-the internet (1=Low to 7=High)
1602 4 3.61 1.71
In the National Stocker Survey question 62 asked producers about the level of trust they had for 14 sources, some variation in the level of trust is apparent when looking at the mean for each of the choices presented. Most producers placed average trust (response of 3, 4, or 5) on information from animal health sales, technical service, and distributor representatives; beef industry trade journals; extension agents; feed company sales, and technical service
representatives; order buyers; state livestock associations; and stocker specific trade journals. Most producers placed a high level of trust (response of a 6 or 7) in local veterinarians, non-local veterinarians, other stocker producers, and university professors/area or state extension
specialists. Producers likely may place a higher level of trust in these sources, because of how frequ