Effective Tax Rates in Transition
By: Vlad Ivanenko
William Davidson Institute
Working Paper No. 378
Effective Tax Rates in Transition.
(The Evidence from the Input-Output Table 1995 for Russia) By Vlad Ivanenko1
May 2001
Abstract: The paper addresses the question of effective tax rates for Russian economic sectors in
transition. It presents a detailed account of fiscal environment for 1995 and compares statutory obligations with reported tax liabilities. The paper finds that taxation did not contribute to recession, as some observers believed at the time. It extends research by questioning the role that inflation played distorting revenue structure. When the costs of intermediate inputs are adjusted for inflation, many sectors have negative residual revenue, which is indicative of recession. Yet, modeling tax changes to correct the situation does not produce positive results, for the tax share in the cost structure of many sectors is small and cannot compensate for inflation.
JEL Code: H3, P2
Keywords: Taxation in transition, Russian fiscal system
One of the questions that generated heated debates during Russian transition from the planned to market economy of 1991-98 referred to the overall burden of taxation.2 The Soviet planned economy was considered inefficient by many observers who believed that, after the government had lifted administrative controls, Russian GDP would grow. The prolonged recession that followed the liberalization was puzzling and economists searched for explanations. Some argued that statutory tax rates were so high that business operators did not have incentives to produce. This explanation implied that Russia had to lower corporate tax rates in order to stop the recession. In addition, it provided an
intellectual justification for tax avoidance.
In this paper, we shall try to test whether the allegation of incentive-incompatible taxation is correct. The idea is to compare the residual revenue net of actually reported taxes for different economic sectors with the would-be revenue if taxes were paid according to
1
Dept. of Economics, SSC 4004, the University of Western Ontario, London, N6A 5C2 Canada. E-mail: <vivanenk@uwo.ca>. The author is grateful to Knick Harley and Dmitry Pospielovsky of the University of Western Ontario and Alexander Ustinov of the Economic Expert Group affiliated with the Russian Ministry of Finance for valuable comments. Usual caveat applies.
2
The origin for the belief that taxation was high is not clear. There is an apparent resemblance of Russian right-wing critique and general libertarian skepticism regarding government programs. For example, FIPER [1998, ch. 4] states that Russian tax rates are higher than in the West and, therefore, should be reduced. Arguably, the policy of Washington Consensus with its emphasis on lowering marginal tax rates (while exp anding tax bases) promoted general belief in Russia that taxes should be slashed. Left-wing economists came to the same idea. They thought that taxation stifled the incentive to produce. For example, the Economic Report of the Russian Academy of Science (published in May 1997 in Moscow, obtained through private communications) recommended “to reduce the tax burden promoting growth and investment”.
It is possible that expert suggestions were somewhat misinterpreted. Lopes-Claros and Alexashenko [1998] state that the situation was paradoxical: government saw its revenue falling while taxpayers complained about the high tax burden. What many observers apparently had in mind maintaining that taxes were high was that effective rates differed substantially among taxpayers generating complaints.
statutory rates.3 To construct the test, we need to address several problems. First, the concept of business incentive has to be defined. General literature considers that firm’s objective is to maximize economic profit, but defining costs in transition is not a straightforward exercise. Second, data on tax bases are scattered across several
publications that are incompatible in some respects. It is necessary to define a single data set, to which it is possible to add new information in a consistent manner. Finally, a thorough account of the Russian fiscal environment is unavailable. It is imperative to search through numerous governmental acts and regulations to construct a model of how taxes are legally administered.
The paper consists of four chapters. Chapter 1 addresses general problems related to our research. We dwell on the definition of business incentive in transition and choose a period under investigation. Chapter 2 introduces the Russian fiscal legislature for that period. We discuss the evolution of the legal system and identify what corporate taxes to include in our analysis. Chapter 3 presents a test for compatibility of taxation with
economic objectives of taxpayers. We find that full compliance with the existing tax laws does not alter business behavior for the majority of firms. The last chapter provides a counter- factual experiment with costs being adjusted to inflation. We observe that most of the industries are better off contracting if business operators assess the cost of
intermediate inputs at its replacement value that we use to arrive at real costs of
intermediate inputs. Yet, the reduction of statutory rates to actually paid levels does not change the situation qualitatively with the major exception of oil and gas mining.
1. General Computational Problems
The production theory views firms as “black boxes” able to transform inputs into outputs according to particular production functions. Under this definition, the objective of firms is either to maximize profits or to minimize costs.4 We restrict our attention to the problem of profit maximization.
The usual definition of profit is the difference between revenue at producer’s prices and economic costs. In general, the costs include the value of intermediate inputs, wage-related expenses, cost of capital, and other expenses wage-related to business activity such as taxes on production. We retain the general definition with the exception of the cost of capital that is assumed to be zero. The reason for exclusion is threefold. First, most of the capital assets in transition were created in the Soviet period with the state being the ultimate payer. During privatization, the ownership of state assets was transferred to individuals either gratis (voucher privatization) or at fire sale prices (closed auctions). Thus, the initial cost of capital assets was low and in the period under consideration owners could ignore the problem of capital replacement considering the cost of capital to
3
The test that we are conducting does not amount to a counter-factual experiment. To find what profits would be if a different tax schedule was applied, we have to assess its impact on quantities and prices. Fortunately, it is possible to avoid problems associated with the construction of a computable general equilibrium (CGE) model since our approximation to CGE delivers unambiguous results.
4
Both problems yield the same results given that technologies exhibit decreasing returns to scale and firms are price-takers (see Mas -Colell, Winston, and Green [1995, p. 139]). Both assumptions are usually acceptable in the literature and we adopt the same line.
be zero for all practical purposes. Second, the ownership in transition was weak and there was a serious principal-agent problem. Managers used their insiders’ knowledge making decisions that were not in the best interest of owners, for example stripping assets. Coupled with the fact that many production facilities stayed idle and investment fell manifold, it is reasonable to conclude that the cost of capital played a marginal role in transition.5
If we exclude the economic cost of capital from consideration, we arrive at the concept of gross accounting profit as our indicator of the incentive to produce. The next step is to choose an appropriate data set.
Among alternative approaches that compute tax rates, we have chosen that of Fullerton [1996]. He uses a Leontieff input-output matrix to evaluate the impact of environmental taxes on output prices across economic sectors. Two assumptions are critical in his analysis. First, the substitution of factors of production is not allowed. This fixes factor demand irrespective of prices. Second, final demand stays the same. Thus, consumers are the ones who eventually pay extra charge for environmental taxes. Both assumptions are justified by the question that Fullerton asks. The problem is not to determine what happens with the output, which stays the same, but how taxes are distributed across consumers. We use similar assumptions in our analysis.
The present study uses an input-output matrix for 1995 that the Russian State Statistical Committee (GKS) recently published (see GKS [2000a]). This is the first comprehensive table that has been constructed for the post-Soviet Russia. We introduced several
amendments into the original data that are important for our purposes. Sectors “Oil and gas mining and oil processing”, “Transportation and communication”, and “Banking and general management” were disaggregated into their respective components. The
disaggregation allowed us to use additional information. For example, taxation of fuels is administered by different rules and this distinction would be lost if we assessed the sector by the composite tax rate. Similarly, transport and banking margins should be added to the respective sectors and not to their composites, which distorts sectoral revenue structure. Appendix A explains the methodology of adjustments in details.
2. Tax System of Russia 1995
After the collapse of the USSR, the Russian tax system experienced a period of dramatic and spontaneous changes that came to the end with the enactment of the second part of the Tax Code in 2000. For the first time in a decade, the fiscal legislature is based on a single document. That was not the case in 1995. Then various federal and provincial laws, government edicts, presidential decrees were parts of the fiscal landscape. The reason for such legal mosaic was twofold.
5
Finally, the general method of evaluation of the economic cost of capital is based upon the value of real interest rate, which is hard to compute for Russia in transition. Methodology for finding the cost of capital is described in King and Fullerton [1984]. In addition, the value of capital cost allowances (CCA) may approximate the cost of capital allowing to switch to the conventional economic profit. We do not use this approach either because data on CCA are scarce.
First, when Russia seceded from the Soviet Union in 1991, it retained the Soviet fiscal system by default. Its structure was pathetically incompatible with the new market economy and urgent measures to correct for revealed deficiencies were necessary. To understand taxes that evolved, we have to dwell on few features of the former tax system.
The Soviet taxation targeted approximately the same bases as elsewhere (revenue, corporate property, payroll, corporate profit, and mining) but the process of their
determination was different. Most prices, wages, and profit were set administratively with the state determining qualitative targets. Taxes were interconnected with other elements of the state management and did not have an independent meaning.
After the system of administrative controls over revenue structure was dismantled in 1992, previously hidden economic imbalances appeared. The government had foreseen the need for adjustment and introduced a number of tax innovations before the transition to market economy began. However, the scope of administrative and budgetary problems was larger than expected. Literally overnight, some taxes proved to be excessive and had to be replaced or abandoned. To patch the holes, laws were introduced in haste, creating a legal nightmare for a tax practitioner.
Second, after Russia left the USSR, its several provinces experimented with quasi-independence. One of the main bones of contention became the ownership of tax revenue. The federal government insisted that its tax laws had preeminence over provincial legislation. The latter disagreed. After lengthy negotiations, the center and provinces came to tax agreements that reflected the political balance of that time. They were by no means symmetrical across territories and further complicated the picture. Coupled with the fact that business participants successfully lobbied for various tax exemptions, the modeling of the Russian tax system of 1995 is not a trivial exercise by many counts.
Before we proceed it is important to determine what “tax” means. The paper follows the definition that is provided by the Russian legislature6. It defines a tax as a mandatory payment to state budgets and state-controlled funds resulting from business activity. This definition includes other contributions that are usually not considered to be taxes.7
According to the Law 2118-1 dated December 27, 1991 “On the Foundations of the Tax System in the Russian Federation” (with amendments on July 1, 1994), there are 16 federal, 4 regional, and 23 municipal taxes. The Budgetary Classification8 itemizes 42 taxes. Moreover, several extra-budgetary funds were not included in the consolidated budget. It is obvious that such a multitude of taxes is unmanageable. In our analysis, we limit consideration to those taxes, on which data are available and which have fiscal importance.
6
The Federal Law N 2118-1 dated December 27, 1991 “On the Foundations of the Tax System in the Russian Federation”, with amendments on July 1, 1994 .
7
Like Canada Pension Plan.
8
See the Order of the Ministry of Finance N 177 dated December 29, 1994 “On the Budgetary Classification of the Russian Federation”.
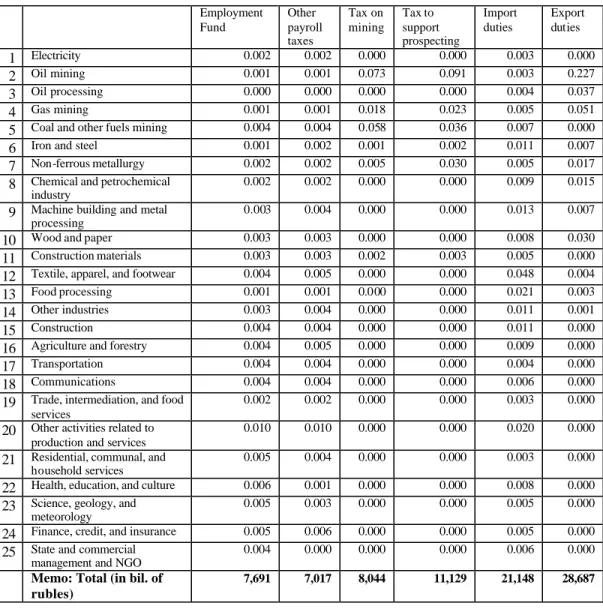
The data on tax collection in Russia 1995 are hard to find. “Finance in Russia” (GKS [1998d], tables 2.3, 2.20-30), despite the title, contains highly aggregated numbers on tax collection. SITE [2000] has monthly series on some additional taxes. The estimates of federal taxes are available in the Law N 212-FZ9 but they are projections for 1995 made in December of that year. FIPER [1998, chapter 4-1] provides a table but its sum of taxes differs from that in GKS [1998d, table 2.3]. Another detailed account of tax collection is in IET [1997, Chapter 1-5] but it includes in general tax revenue targeted budgetary funds, which are apparently double-counted. Data on several taxes not available elsewhere were kindly provided by Alexander Ustinov of the Economic Expert Group. Unfortunately, the possibility of data cross-checking is severely limited and Table 1 is an approximation. It lists taxes and respective recipients of fiscal revenue for 1995.10
We have chosen 19 taxes for modeling including almost all taxes that collect more than 2,000 billion rubles of revenue.11 Smaller taxes are selected if their base is similar to that of a larger tax. Legal documents have been collected through Internet, with the main source being the legal database supported by the Russian firm “IST”.12 The collected information includes data on tax bases, rates, and exemptions. It has been possible to verify that the documents were in force in 1995 and to trace legal changes that occurred throughout that year for most taxes. Appendix B contains references to laws and
regulations that we use in this paper.
3. Reported Structure of Costs and Revenue with Actual and Statutory Tax Collection
We start with the observation of corporate purchasing and sales as it is reported in the input-output matrix (GKS [2000a]). Table 2 contains columns of cost items, subsidies, and profit that are expressed as shares in total output at consumer’s prices. The sums of intermediate costs are taken from the matrix with the exclusion of the expenses on
household production. The total for the latter is found as the difference between its output and numbers for “mixed profit”, which combines both business profit and wages of household producers. We assume that the technological structure of intermediate consumption for households is identical with that for corporate sector and assign the same shares to each input. The matrix aggregates labor expenses inclusive of mandatory social contributions, which we treat as taxes in this paper. The shares of wage bill and
9
The Federal Law N 212-FZ dated December 27, 1995 “On Amendments in the Law on the Federal Budget for 1995” .
10 The general methodology of calculating residual taxes is as follows. Usually, reports on tax revenue
make aggregation according to its budgetary code (see numbers in the utmost left column) but some items are reported in a different combination. Then it is possible to deduct particular items as the difference between two sums and the rest is divided among the remaining taxes. We take the weights from revenue for the first 9 months of 1997 (which is reported by the Center of Economic Conditions of the Federal
Government, see http://www.prime-tass.ru/free/Analitik/Sprav/CEK/Nal/Nal.htm). The tax to support educational establishments is not mentioned in the classification, so it claims all tax revenue under the budgetary code 10203 (“Other payroll taxes”).
11
Land taxes and rental payments for state-owned land are omitted because the distribution of land ownership and the use of state-owned land among sectors is unavailable.
12
Table 1: Estimated fiscal revenue 1995, by taxes (in billion of rubles). Tax Federal budget Provincial and municipal budgets Extra-budgetary funds Total Revenue Source
10101 Corporate income tax 40,995 76,619 117,614 SITE
10102 Personal income tax 3,250 33,178 36,428 IET
10200 Payroll taxes, including 4,345 4,345 IET
10201 Transportation tax 2,200 2,200 FIPER
10202 Targeted fees to support police, urban
maintenance, education and other municipal needs
711 711 Residual, share 1997 10203 Tax to support educational establishments 1434 1434 Residual, share 1997
10301 Value-added tax on domestic products 60,160 24,543 84,702 IET
10302 Value-added tax on import 10,545 10,545 Ustinov
10303 Excise taxes, including 17,681 6,383 24,064 SITE
x01-2 Alcoholic beverages 1,200 5,694 6,894 Ustinov
x12 Natural gas 7,486 7,486 Ustinov
x13 Raw oil 8,963 8,963 Ustinov
10304 Special tax to support the most important economic sectors
7,266 3,618 10,883 IET
10305 Tax on the sale of fuels and lubricants 6,312 6,312 GKS
10306 License fee for the right to produce, store, bottle, and wholesale liquors
662 662 Law on Budget 95
10307 License fee for the right to sell liquors 438 438 FIPER, residual
10308 Other license and registration fees 420 680 1,100 FIPER, share 1997
10309 Taxes on vehicles, including 5,248 5,248 GKS
x01 Tax on automobile road users 4,754 4,754 GKS
x02 Tax on vehicle’s ownership 229 229 GKS
x03 Taxes on the sales road vehicles 265 265 GKS
10401 Personal property tax 233 233 Residual, share 1997
10402 Corporate property tax 15,790 15,790 IET
10403 Estate and gift tax 30 30 Residual, share 1997
10404 Tax on operations with securities 831 71 902 IET
10501 Tax on mining 1,174 5,583 6,756 IET
10503 Fee on use of seabed and sea resources 50 50 Residual, share 1997
10504 Tax to support prospecting 1,683 604 2,287 IET
10505 Fee on pollution and disposal of industrial garbage
37 100 137 Residual, share 1997
10506 Lumber profit tax 150 150 Residual, share 1997
10508 Fee on the industrial use of water 100 100 Residual, share 1997
10509 -13
Land taxes and rental payments for land 187 3,079 3,266 IET
10601 Import duties 8,469 4 8,473 IET
10603 Export duties 15,685 24 15,709 IET
10704 Tax to support residential housing 12,285 12,285 Ustinov
10705 Advertising tax 150 150 Guess, share 1997
Pension Funds 73,709 73,709 GKS
Social Insurance Fund 15,979 15,979 GKS
Mandatory Medical Insurance Fund 8,951 8,951 GKS
Employment Fund 4,810 4,810 GKS
Sum 175,356 188,057 108,697 472,110 SITE
Total tax revenue 175,345 189,035 108,697 473,077 SITE, GKS (funds)
Sources: GKS [1998d], SITE [2000], IET [1996], FIPER [1998], Alexander Ustinov [Economic Expert Group, private communication]. Residual share means that aggregated data are itemized taking shares as reported in tax collection data for 1997.
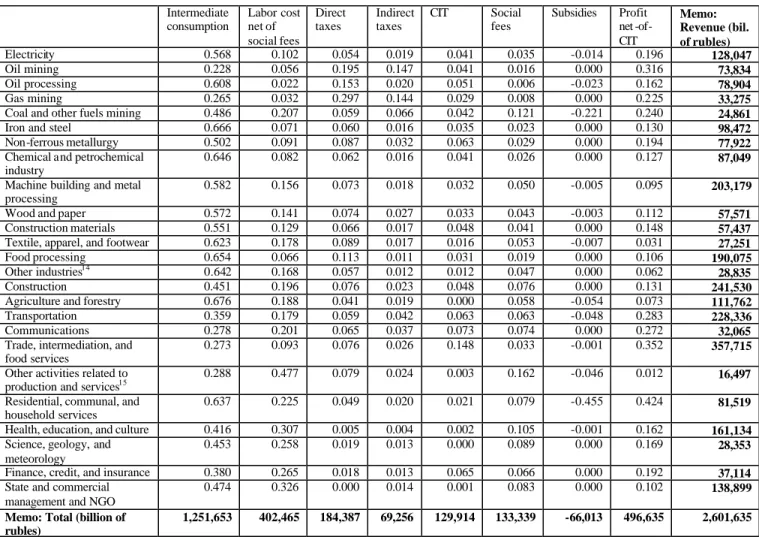
contributions are deduced from the sectoral cost structure as reported in GKS [1998d, tables 3.14, 3.16]. To avoid methodological differences, we consider relative numbers.13 The matrix contains separate direct taxes and totals for indirect taxes. We should note that numbers stand for assessed taxes and not actual payments, which are smaller. Data on state subsidies are from the matrix. The residual between aforementioned costs and output represents the profit gross of CIT, which is present in the matrix. We approximate CIT numbers with our calculations on statutory CIT adjusted to meet the sum of assessed CIT. The profit net of CIT and gross of subsidies is the residual that brings the total sum to unity.
Table 2: Revenue structure of economic sectors in 1995 (at consumer’s prices).
Intermediate consumption Labor cost net of social fees Direct taxes Indirect taxes CIT Social fees Subsidies Profit net -of-CIT Memo: Revenue (bil. of rubles) Electricity 0.568 0.102 0.054 0.019 0.041 0.035 -0.014 0.196 128,047 Oil mining 0.228 0.056 0.195 0.147 0.041 0.016 0.000 0.316 73,834 Oil processing 0.608 0.022 0.153 0.020 0.051 0.006 -0.023 0.162 78,904 Gas mining 0.265 0.032 0.297 0.144 0.029 0.008 0.000 0.225 33,275
Coal and other fuels mining 0.486 0.207 0.059 0.066 0.042 0.121 -0.221 0.240 24,861
Iron and steel 0.666 0.071 0.060 0.016 0.035 0.023 0.000 0.130 98,472
Non-ferrous metallurgy 0.502 0.091 0.087 0.032 0.063 0.029 0.000 0.194 77,922
Chemical and petrochemical industry
0.646 0.082 0.062 0.016 0.041 0.026 0.000 0.127 87,049
Machine building and metal processing
0.582 0.156 0.073 0.018 0.032 0.050 -0.005 0.095 203,179
Wood and paper 0.572 0.141 0.074 0.027 0.033 0.043 -0.003 0.112 57,571
Construction materials 0.551 0.129 0.066 0.017 0.048 0.041 0.000 0.148 57,437
Textile, apparel, and footwear 0.623 0.178 0.089 0.017 0.016 0.053 -0.007 0.031 27,251
Food processing 0.654 0.066 0.113 0.011 0.031 0.019 0.000 0.106 190,075
Other industries14 0.642 0.168 0.057 0.012 0.012 0.047 0.000 0.062 28,835
Construction 0.451 0.196 0.076 0.023 0.048 0.076 0.000 0.131 241,530
Agriculture and forestry 0.676 0.188 0.041 0.019 0.000 0.058 -0.054 0.073 111,762
Transportation 0.359 0.179 0.059 0.042 0.063 0.063 -0.048 0.283 228,336
Communications 0.278 0.201 0.065 0.037 0.073 0.074 0.000 0.272 32,065
Trade, intermediation, and food services
0.273 0.093 0.076 0.026 0.148 0.033 -0.001 0.352 357,715
Other activities related to
production and services15 0.288 0.477 0.079 0.024 0.003 0.162 -0.046 0.012 16,497
Residential, communal, and household services
0.637 0.225 0.049 0.020 0.021 0.079 -0.455 0.424 81,519
Health, education, and culture 0.416 0.307 0.005 0.004 0.002 0.105 -0.001 0.162 161,134
Science, geology, and meteorology
0.453 0.258 0.019 0.013 0.000 0.089 0.000 0.169 28,353
Finance, credit, and insurance 0.380 0.265 0.018 0.013 0.065 0.066 0.000 0.192 37,114
State and commercial management and NGO
0.474 0.326 0.000 0.014 0.001 0.083 0.000 0.102 138,899 Memo: Total (billion of
rubles)
1,251,653 402,465 184,387 69,256 129,914 133,339 -66,013 496,635 2,601,635
Sources: Intermediate costs, direct and indirect taxes, subsidies are from the input-output table; labor cost net of social fees, social fees, CIT, and profit net-of-CIT are author’s calculations.
13
Cost structure is reported in percentage points. We take wage and contribution shares and divide by its sum arriving on shares that we apply to data from the input-output matrix.
14
This sector includes microbiology, pharmaceuticals, medical equipment, printing and copying, art production, jewelry, musical instruments, professional laundry and cleaning, and water delivery systems.
15
The table indicates that for all sectors reported revenue exceeded costs gross of taxes.16 This finding does not support the statement that taxes were so high that firms could not pay. However, the argument regarded statutory tax rates as being incentive- incompatible and not actually reported values. To correct for tax avoidance, we recalculate the input-output matrix replacing reported taxes with their statutory counterparts. The profit net of taxes absorbs the difference as being a residual.17
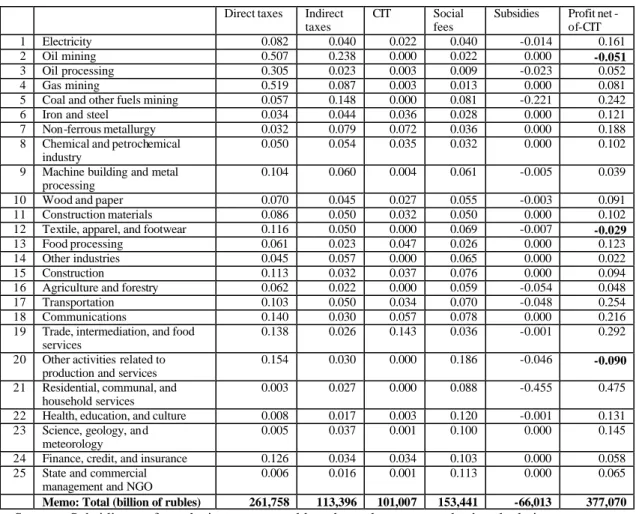
The methodology for calculating statutory tax rates is explained in Appendix C. The general procedure is to apply information on tax rates, bases, and exemptions to relevant statistical data in a consistent manner. Some numbers were missing and proxies were used instead. Appendix C contains Table 7 that presents statutory tax rates as the shares of output at consumer’s prices. Table 3 restates tax shares from Table 7 in aggregated form. The column of profit net-of-CIT shows residual revenue.
Table 3 indicates that while residual revenue decreases it becomes negative for three sectors only.18 This finding contradicts the hypothesis that statutory rates were incentive-incompatible in the transition with possible exception of oil mining. The government could compensate for deficiencies within the framework of the system that existed.
The reasons for negative sentiment towards taxation lie somewhere else. We propose the following explanation. Russian business operators witnessed high inflation in 1995 when producer’s price for industries increased on average 2.7 times. Since many sectors have long production cycles, the cost of intermediate products might be severely deflated distorting real revenue structure. In the next chapter, we consider what the structure would look like if the cost of intermediate products were estimated at its replacement value. In addition, we investigate the role of trade credit in mitigating distortions caused by inflation.
4. Inflationary Components in Revenue and Cost Structure
The concept of replacement cost is explained in Boadway and Kitchen [1999, p. 254]. In period of inflation, the FIFO accounting cost of intermediate products used is less than its replacement cost, so the write-off allowed is less than the amount required to replenish the stock of inventories. To account for inflationary profit, Boadway and Kitchen propose immediate write-off of purchased material inputs. Due to a number of reasons, the
16
Note that some sectors receive either negative or small positive profit if subsidies are abolished.
17
This assumes that taxes do not affect quantities and prices. In supply and demand framework, it means that demand is perfectly elastic and firms are bound in output. Since the qualitative effect of statutory taxes on profit is of primary interest, we ignore secondary effects on what would happen if some sectors receive negative profit.
18
“Oil mining” engaged, apparently, into transfer pricing. The cost of oil for refineries from the input-output table does not correspond with what should be if market prices were paid. Transfer pricing is not incentive-incompatible, for these transfers take place within the same vertically integrated companies. “Textile, apparel, and footwear” was the most depressed sector witnessing 30 percent contraction in 1995 and in need of subsidizing. The situation with the sector “Other activities” is not clear. By all counts it is publishing that drives the sector down. Yet, statutory taxation appears to play no role in its lamentable situation. GKS [2000b, table 2.25] reports that sector “Other activities related to production” was the only one to state negative gross profit with the highest share of labor expenses among all sectors.
proposition is impractical but it offers a framework for calculating the replacement cost of intermediate products.19 We model the value of replacement costs and recalculate cost structure using the immediate write-off rule.
Table 3: Revenue structure with statutory tax rates 1995 (in shares of revenue at consumer’s price).
Direct taxes Indirect taxes
CIT Social fees
Subsidies Profit net -of-CIT 1 Electricity 0.082 0.040 0.022 0.040 -0.014 0.161 2 Oil mining 0.507 0.238 0.000 0.022 0.000 -0.051
3 Oil processing 0.305 0.023 0.003 0.009 -0.023 0.052 4 Gas mining 0.519 0.087 0.003 0.013 0.000 0.081 5 Coal and other fuels mining 0.057 0.148 0.000 0.081 -0.221 0.242 6 Iron and steel 0.034 0.044 0.036 0.028 0.000 0.121 7 Non-ferrous metallurgy 0.032 0.079 0.072 0.036 0.000 0.188 8 Chemical and petrochemical
industry
0.050 0.054 0.035 0.032 0.000 0.102 9 Machine building and metal
processing
0.104 0.060 0.004 0.061 -0.005 0.039 10 Wood and paper 0.070 0.045 0.027 0.055 -0.003 0.091 11 Construction materials 0.086 0.050 0.032 0.050 0.000 0.102 12 Textile, apparel, and footwear 0.116 0.050 0.000 0.069 -0.007 -0.029
13 Food processing 0.061 0.023 0.047 0.026 0.000 0.123 14 Other industries 0.045 0.057 0.000 0.065 0.000 0.022 15 Construction 0.113 0.032 0.037 0.076 0.000 0.094 16 Agriculture and forestry 0.062 0.022 0.000 0.059 -0.054 0.048 17 Transportation 0.103 0.050 0.034 0.070 -0.048 0.254 18 Communications 0.140 0.030 0.057 0.078 0.000 0.216 19 Trade, intermediation, and food
services
0.138 0.026 0.143 0.036 -0.001 0.292 20 Other activities related to
production and services
0.154 0.030 0.000 0.186 -0.046 -0.090
21 Residential, communal, and household services
0.003 0.027 0.000 0.088 -0.455 0.475 22 Health, education, and culture 0.008 0.017 0.003 0.120 -0.001 0.131 23 Science, geology, and
meteorology
0.005 0.037 0.001 0.100 0.000 0.145 24 Finance, credit, and insurance 0.126 0.034 0.034 0.103 0.000 0.058 25 State and commercial
management and NGO
0.006 0.016 0.001 0.113 0.000 0.065
Memo: Total (billion of rubles) 261,758 113,396 101,007 153,441 -66,013 377,070
Sources: Subsidies are from the input-output table, other columns are author’s calculations
The methodology for finding replacement cost is described in Appendix D. Here we explain intuition of the approach. The input-output table reports cumulative costs that a firm has written off during the year. Let us assume that the firm purchases and uses n units of intermediate input during the period of production cycle T repeatedly throughout the year. Physical output may vary during the year, for example, its index q falls from 100 to 95. The value of inputs reported for the year covers the period from -T when the first production cycle of the year started and to the last day of the year. The price of a purchased input varies during this time; for example, its index p rises from 100 to 270.
19
Firms can use material inputs for purposes unrelated to production after the write-off. In addition, CIT and VAT collection falls drastically in the initial period, which is infeasible if government is credit-constraint (usually the case in inflation). We concentrate our attention on intermediate costs only because capital cost is assumed to be zero (see discussion in chapter 1) and labor expenses are usually paid after output is sold, thus being unaffected by the length of production cycle.
Then the function of input cost is a definite integral of the product of the functions of input use N(t) and price p(t) for t∈[-T, 365] given T, n, and q.
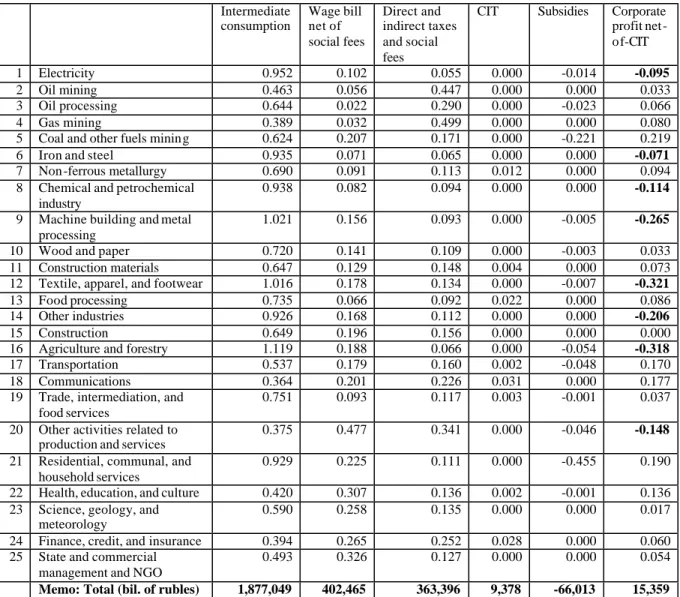
When immediate write-off is allowed, the period covered in the report is [0, 365] and we can ignore the distinction between purchased inputs used for production of this and next years provided that physical output does not change. The cost of an input is the definite integral of the functions of input use N(t) and price p(t) for t∈[0, 365]. Table 4 provides estimates of revenue components with immediate write-off. Tax shares are recalculated for new tax bases.20
Table 4: Revenue structure with intermediate products assessed at its replacement cost and statutory taxes (in shares of reported revenue at consumer’s price).
Intermediate consumption Labor cost net of social fees Direct and indirect taxes and social fees
CIT Subsidies Corporate profit net-of-CIT 1 Electricity 0.952 0.102 0.095 0.000 -0.014 -0.134 2 Oil mining 0.463 0.056 0.728 0.000 0.000 -0.247 3 Oil processing 0.644 0.022 0.330 0.000 -0.023 0.026 4 Gas mining 0.389 0.032 0.598 0.000 0.000 -0.019
5 Coal and other fuels mining 0.624 0.207 0.262 0.000 -0.221 0.128
6 Iron and steel 0.935 0.071 0.090 0.000 0.000 -0.095
7 Non -ferrous metallurgy 0.690 0.091 0.136 0.013 0.000 0.069
8 Chemical and petrochemical industry
0.938 0.082 0.112 0.000 0.000 -0.132
9 Machine building and metal processing
1.021 0.156 0.164 0.000 -0.005 -0.336
10 Wood and paper 0.720 0.141 0.145 0.000 -0.003 -0.003
11 Construction materials 0.647 0.129 0.169 0.005 0.000 0.051
12 Textile, apparel, and footwear 1.016 0.178 0.178 0.000 -0.007 -0.365
13 Food processing 0.735 0.066 0.098 0.023 0.000 0.079
14 Other industries 0.926 0.168 0.135 0.000 0.000 -0.229
15 Construction 0.649 0.196 0.187 0.000 0.000 -0.032
16 Agriculture and forestry 1.119 0.188 0.091 0.000 -0.054 -0.343
17 Transportation 0.537 0.179 0.192 0.002 -0.048 0.138
18 Communications 0.364 0.201 0.234 0.032 0.000 0.170
19 Trade, intermediation, and food services
0.751 0.093 0.122 0.003 -0.001 0.032
20 Other activities related to production and services
0.375 0.477 0.357 0.000 -0.046 -0.163
21 Residential, communal, and household services
0.929 0.225 0.118 0.000 -0.455 0.183
22 Health, education, and culture 0.420 0.307 0.145 0.002 -0.001 0.127 23 Science, geology, and
meteorology
0.590 0.258 0.143 0.000 0.000 0.010
24 Finance, credit, and insurance 0.394 0.265 0.262 0.029 0.000 0.051
25 State and commercial management and NGO
0.493 0.326 0.135 0.000 0.000 0.046
Memo: Total (bil. of rubles) 1,877,049 402,465 448,155 9,666 -66,013 -69,687 Sources: Subsidies are from the input-output table, other columns are author’s calculations.
After adjustment for inflation, twelve sectors exhibit revenue structure prohibitive for voluntary production. These sectors account for 43 percent of total output and 24 percent
20
of GDP, which indicates the size of the problem. Yet, if businesses engage in tax avoidance, would their accounting books look qualitatively different?
Table 5 reiterates the columns of Table 4 with taxes multiplied by coefficients of sectoral tax compliance. The latter represents the ratio of actually paid taxes as reported by tax collection agencies to tax values that appears in financial statements.21 We take taxes due from GKS [1998d, table 3.58] for commercial sectors and apply the RAS procedure (see UN [1999]) to calculate estimates for individual taxes.22
Table 5: Revenue structure with intermediate products assessed at its replacement cost. Statutory taxes are paid at actual rates (in shares of revenue at consumer’s price).
Intermediate consumption Wage bill net of social fees Direct and indirect taxes and social fees
CIT Subsidies Corporate profit net-of-CIT 1 Electricity 0.952 0.102 0.055 0.000 -0.014 -0.095 2 Oil mining 0.463 0.056 0.447 0.000 0.000 0.033 3 Oil processing 0.644 0.022 0.290 0.000 -0.023 0.066 4 Gas mining 0.389 0.032 0.499 0.000 0.000 0.080
5 Coal and other fuels mining 0.624 0.207 0.171 0.000 -0.221 0.219
6 Iron and steel 0.935 0.071 0.065 0.000 0.000 -0.071
7 Non -ferrous metallurgy 0.690 0.091 0.113 0.012 0.000 0.094
8 Chemical and petrochemical industry
0.938 0.082 0.094 0.000 0.000 -0.114
9 Machine building and metal processing
1.021 0.156 0.093 0.000 -0.005 -0.265
10 Wood and paper 0.720 0.141 0.109 0.000 -0.003 0.033
11 Construction materials 0.647 0.129 0.148 0.004 0.000 0.073
12 Textile, apparel, and footwear 1.016 0.178 0.134 0.000 -0.007 -0.321
13 Food processing 0.735 0.066 0.092 0.022 0.000 0.086
14 Other industries 0.926 0.168 0.112 0.000 0.000 -0.206
15 Construction 0.649 0.196 0.156 0.000 0.000 0.000
16 Agriculture and forestry 1.119 0.188 0.066 0.000 -0.054 -0.318
17 Transportation 0.537 0.179 0.160 0.002 -0.048 0.170
18 Communications 0.364 0.201 0.226 0.031 0.000 0.177
19 Trade, intermediation, and food services
0.751 0.093 0.117 0.003 -0.001 0.037
20 Other activities related to production and services
0.375 0.477 0.341 0.000 -0.046 -0.148
21 Residential, communal, and household services
0.929 0.225 0.111 0.000 -0.455 0.190
22 Health, education, and culture 0.420 0.307 0.136 0.002 -0.001 0.136 23 Science, geology, and
meteorology
0.590 0.258 0.135 0.000 0.000 0.017
24 Finance, credit, and insurance 0.394 0.265 0.252 0.028 0.000 0.060
25 State and commercial management and NGO
0.493 0.326 0.127 0.000 0.000 0.054
Memo: Total (bil. of rubles) 1,877,049 402,465 363,396 9,378 -66,013 15,359 Sources: Subsidies are from the input-output table, other columns are author’s calculations.
21
The difference represents tax deferrals and arrears.
22
Numbers for non-commercial sectors are deduced from the residual. RAS stands for Richard A. Stone who used the approach to update input-output tables. The sums of tax arrears for sectors and individual taxes were applied to the matrix of reported taxes from the input-output table to arrive at the matrix of tax arrears.
If we plot the residual profit from Table 4 against the coefficient of tax avoidance (Fig. 1), we see that they are negatively correlated. This finding indicates that firms used tax avoidance to improve their revenue structure. However, apart from oil and gas mining that improve significantly avoiding taxes, other sectors do not have a sizable tax share to use it as adjustment mechanism. What might provide relief under inflation is the
reduction in the replacement cost of intermediate inputs. Next we consider how trade credit lowers the replacement cost.
Appendix D presents the methodology for finding replacement cost when trade credit is accounted for. The general idea is to write-off inputs used at the date of payment instead of the time of purchase. Sectoral revenue structure with inputs written off at the time of payment is provided in Table 6. Taxes are recalculated for new tax bases.
Table 6: Revenue structure at replacement cost of intermediate products with trade credit and statutory taxes (in shares of revenue at consumer’s price).
Intermediate consumption Wage bill net of social fees Direct and indirect taxes and social fees
CIT Subsidies Corporate profit net-of-CIT 1 Electricity 0.595 0.102 0.157 0.019 -0.014 0.142 2 Oil mining 0.212 0.056 0.770 0.000 0.000 -0.038 3 Oil processing 0.589 0.022 0.340 0.006 -0.023 0.065 4 Gas mining 0.180 0.032 0.634 0.015 0.000 0.139
5 Coal and other fuels mining 0.405 0.207 0.300 0.009 -0.221 0.300
6 Iron and steel 0.740 0.071 0.093 0.015 0.000 0.081
7 Non -ferrous metallurgy 0.578 0.091 0.136 0.049 0.000 0.145
8 Chemical and petrochemical industry
0.725 0.082 0.122 0.012 0.000 0.060
9 Machine building and metal processing
0.805 0.156 0.187 0.000 -0.005 -0.142
10 Wood and paper 0.615 0.141 0.163 0.015 -0.003 0.069
11 Construction materials 0.554 0.129 0.185 0.032 0.000 0.101
12 Textile, apparel, and footwear 0.861 0.178 0.197 0.000 -0.007 -0.229
13 Food processing 0.686 0.066 0.105 0.037 0.000 0.105
14 Other industries 0.722 0.168 0.155 0.000 0.000 -0.044
15 Construction 0.513 0.196 0.211 0.019 0.000 0.061
16 Agriculture and forestry 0.971 0.188 0.095 0.000 -0.054 -0.199
17 Transportation 0.417 0.179 0.213 0.019 -0.048 0.220
18 Communications 0.140 0.201 0.272 0.097 0.000 0.291
19 Trade, intermediation, and food services
0.140 0.093 0.222 0.182 -0.001 0.364
20 Other activities related to production and services
0.361 0.477 0.359 0.000 -0.046 -0.151
21 Residential, communal, and household services
0.894 0.225 0.118 0.000 -0.455 0.218
22 Health, education, and culture 0.405 0.307 0.145 0.003 -0.001 0.142 23 Science, geology, and
meteorology
0.568 0.258 0.143 0.000 0.000 0.031
24 Finance, credit, and insurance 0.380 0.265 0.264 0.034 0.000 0.058
25 State and commercial management and NGO
0.476 0.326 0.135 0.001 0.000 0.063
Memo: Total (bil. of rubles) 1,363,530 402,465 520,400 98,562 -66,013 282,690 Sources: Subsidies are from the input-output table, other columns are author’s calculations.
Table 6 shows that trade credit changes revenue structure qualitatively for six sectors. Yet, it fails for six other sectors, which have revenue structure suggestive of recession. Since shares of intermediate costs provide room for positive adjustment, apparently it is suppliers who do not extend credit to sectors in trouble. It is interesting to note that if we plot the coefficient of trade credit against the residual profit, the plot exhibits slight positive correlation (see Fig. 2). This result suggests that suppliers are less
accommodative to purchasers’ budget constraints than tax agencies are.
Figure 1: Scatter plot of tax arrears. Profit is from Table 4. Tax arrears are the ratio of the difference between sum of taxes from Table 4 and 5 to the sum of taxes from Table 4.
Figure 2: Scatter plot of trade credit. Profit is from Table 4. Trade credit is the ratio of the difference between intermediate consumption from Table 4 and 6 to intermediate
consumption from Table 4.
Conclusion
This paper presents a detailed account of statutory tax environment that economic sectors faced in 1995. Using its structure, we questioned the validity of the statement that the Russian fiscal system was incentive- incompatible in transition and, thus, contributed to recession. To find the answer, we applied statutory tax rates for 1995 to tax bases as reported in the input-output table for that year. The results did not support the claim that businesses would go bust if they paid taxes according to statutory rates. We concluded that businesses avoided taxes to save money and not their lives with possible exception of oil mining industry.
The paper extended research questioning the role that inflation played in transition. We used the concept of replacement costs incorporating inflation into our analysis. With
0.00 0.25 0.50 0.75 -0.4 -0.2 0 0.2 Profit Trade Credit 0.00 0.25 0.50 -0.4 -0.2 0 0.2 Profit Tax Arrears
adjusted intermediate costs, revenue structure became significantly worse for many sectors.
We asked a related question of whether tax authority reacted to business complaints asking for tax relief. We observed that tax arrears appeared positively correlated with residual loss suggesting that tax relief was coming. Yet, it was impossible to correct the situation with tax adjustments alone given that tax share in revenue structure was small for many sectors. We explored how trade credit might improve upon real cost structure of afflicted sectors, and saw that it did not change cost structure qualitatively either.
In general, we found no evidence that Russian tax system contributed to recession or that fiscal policy could be used to stimulate growth.
Appendix A: the Input -Output Table 1995 and Its Adjustment
The main data source for the present analysis is the input-output table for 1995 (see GKS [2000a]). It is the first table based on primary data that the Russian State Committee for Statistics has produced since the collapse of communism in 1991. Moreover, unlike previous tables that were consistent with the Soviet definitions of costs and output, this table is constructed according to the principles of the internationally recognized System of National Accounts (SNA) 1993 (see System [1993]).
The table contains several sheets that represent different aspects of the economic performance. In what follows, we mention only the features that are relevant to our analysis.
The general methodology of constructing an input-output table is described in UN [1999]. Since we adjust the table to include features that are important for our analysis, it would be helpful to consider in short how it is organized. An enterprise serves as the primary unit that provides a number of statistical forms upon which the table is
constructed. Raw data are aggregated as follows. First, firm’s “main output”, by which the enterprise’s professional affiliation is determined, is separated from its “subsidiary outputs” that are added to appropriate bundles of goods and services. The results are provided in the matrix of supply. It contains columns showing professional affiliation and rows presenting values of specific output. Some sectors are well diversified with less than 70 percent of total output belonging to the main activity, even at the level of aggregation that is reported in the table. Second, cost structure is determined for outputs at purchase prices. The structure is reported in the matrix of use at consumer’s prices. Finally, transport and trade margins and net taxes on products are deducted from costs generating the matrix of use at producer’s prices.
The table as it appeared in print comprises 22 sectors.23 The sectors are organized according to the Soviet industria l classification OKONKh (see GKS [1976]). It differs from both ISIC and NAICS24 classifications.
23
It is an aggregated version of the original table that contains 223 sectors. The latter is not publicly available.
OKONKh sets sectors dividing economic activities into “material production”25 and “unproductive sectors”. The most peculiar feature for a Western practitioner is blending of mining activities with general industry. Mining of oil, natural gas, and coal is reported sometimes separately but, in general, they are aggregated with refineries. Mining of ores is reported in the same sector with mills. Mining of raw materials for fertilizers and chemicals goes under the title of chemical and petrochemical industry. Mining of sand and gravel is included into construction material industry. It makes sense for vertically integrated companies to aggregate mining and processing but, for tax purposes, it is better to treat them separately.
In this paper, we disaggregate three sectors into seven and two are merged. The main adjustment regards sector of “Oil and gas production”. It is divided into the sectors of oil mining, gas mining, and oil processing. These three groups are important sources of fiscal revenue and some taxes are specific to them. We use a variety of data sources for the disaggregation. We take data on resources and use of oil and gas from the balance of fuel resources (GKS [1997a, table 10.32]. Natural gas monopoly Gazprom [1998] reports on domestic gas consumption by main sectors providing additional information. The domestic producer prices and average export and import prices for oil, gas, petrol, diesel fuel, and heating oil are from GKS [1996c, table 389-90, 396-7]. Consumer prices for the same products are from RET [1996-1]. GKS [1997b, table 6.4] has data on household expenditure on natural gas, prices on which are regulated. The consumption of fuels by transport is from GKS [1996a, p.208] and by agriculture from GKS [1997a, table 11.14]. Price of fuels for agriculture is from GKS [1998a, table 6.9]. After matrix of use in consumer prices is set determining sectoral output at consumer’s prices, the output is converted into producer’s prices by applying transport and trade margins and taxes on products. Data on margins are taken from GKS [2000a] with several sectors that use only oil or gas serving as the benchmark.
On the cost side, imputed output at producer’s prices is divided into cost components. GKS [1998c, table 4.4] provides information on consumption of electricity per unit of output for oil mining and processing. GKS [1999a, tables 2.6, 2.9, 10.17, 10.22] gives the number of employees and their average wage rates for 1995. Unfortunately, cost structure from GKS [1998d, table 3.11] provides highly aggregated components of costs and distinguishes only between “the cost of material inputs”, “other expenses on production”, and “social contributions”. Thus, in general the cost of particular input is found as the product of the input cost reported in input-output table times sectoral weight in
production.
The sectors “Transport and communications” and “Banking, credit, pension funds, general government, management organizations, and NGO” are split in two. We need to divide sectors to get a square matrix of costs. For that purpose, transportation and banking margins are to be combined with total expenditure on transport and banking
24
The International Standard Industrial Classification that is accepted as the benchmark by the UN and Eurostat and the North American Industrial Classification Standards, which the US Bureau of Census has switched recently to.
25
That includes any activity generating tangib le products, energy, and services that are necessary for both production and distribution of products and energy.
services. GKS [2000b, tables 2.11 and 2.25] contains information on output, total intermediate cost, labor expenses, and net direct taxes for sectors “Transport”,
“Communications”, “Banking, credit, and pension funds”, and “General government, management organizations, and NGO”. This information suffices to set border values on revenue structure. However, cost itemization is problematic. On the use side, GKS [1996a, p. 189] has a table of cost share on communications by main economic sectors. The consumption of electricity and fuels by transport is from GKS [1996a, p. 208]. The rest of cost parameters are found by splitting costs for larger sectors as reported in the input-output table according to weights. The latter is sectoral shares in total costs on the cost side and shares in output on the use side.
One more problem is with treatment of banking margin. The table does not account for the use of financial intermediation26 because the structure of borrowers is statistically unobservable. To get around this situation, the table introduces a fictitious sector that consumes the services of financial intermediation but produces nothing. Since this entry does not appear in our final analysis, we have to add its cost to other sectors. GKS [2000b] proposes to add the cost to the sector of “Banking, credit, and pension funds”. However, this suggestion amounts to the assumption that banking sector is the ultimate consumer of its own services, which is not obvious. To delete this entry, we distribute the cost of this entry among all sectors taking their shares in total banking credit as a proxy for the use of financial intermediation. GKS [1998d, tables 3.23 and 3.27] presents numbers on banking credit for 1996.27
Trade margins are added directly to the sector of “Trade, commercial intermediation, and general market activity”, which completes the conversion of the table into a square matrix of costs.
Finally, the sectors of “Coal mining” and “Peat and bituminous shale mining” are merged. The reason is that the importance of the latter sector for economy is miniscule and its appearance in the publication is somewhat odd.
Other adjustment regards itemization of wage bill and social fees that are provided jointly in the input-output table. We multiply total expenses by the ratio of wage bill to total labor expenses for 1995 as reported in cost structure (GKS [1998d, tables 3.14 and 16]) getting wages. Missing ratios are taken from GKS [1999a, table 10.2]. To account for possible methodological differences between the input-output table and cost structure, we adjust wages by applying a coefficient for 1992. It is constructed using labor data from the input-output table GKS [1996b, p. 146-55] that distinguishes between wages and fees and the ratio of wage bill to total labor expenses from GKS [1998d, tables 3.14 and 16]. The formula for wage bill is
] 1 [ 92 92 95 92 95 95 95 95 A Wage Labor Labor Wage Labor Wage Labor Wage Cost Cost IO IO Cost Cost IO IO = 26
That is determined as the difference between the interest earned on financial credit and the interest paid to depositors.
27
where subscripts stand for the source of data and the year of observation. The residual between total labor expenses and wages determines social fees.
Appendix B: Modeled Taxes 1995
The initial structure of Russian tax system, after it left the USSR, was established by the Federal Law N 2118-1 dated December 27, 1991 “On the Foundations of the Fiscal System in the Russian Federation”.28 The law provided a list of federal, provincial, and municipal taxes (15, 3, 21 items respectively) and general procedures by which they were administered. Later, the list was changed and new taxes introduced. Russian taxes are generally administered by a vertically integrated tax inspection. The inspection does not collect tax revenue that goes directly to the recipients as they are specified by laws.
The presentation below is organized along tax bases. They include gross revenue, assets, wage fund, use of mineral resources, foreign trade, specific goods, corporate profit, and value-added.
Taxes on gross revenue
1. Tax to support residential housing
This municipal tax is introduced by the Federal Law N4178-1 dated December 22, 1992 “On the Introduction of Changes in Several Laws of the Russian Federation on
Taxation”. The law specifies that the rate does not exceed 1.5 percent of the total revenue of a legal entity that resides within the municipality excluding its expenses on the
maintenance of Residential and public buildings. It is the responsibility of local governments to choose the rate.
We consider 1.5 percent to be the general rate. No exemption is specified by the Letter of the Ministry of Finance N 5-1/756 dated May 31, 1993 “On the Recommended
Instructions on Some Municipal Taxes and Fees”, Appendix 4.
2. Tax on automobile road users
This extra-budgetary tax is stipulated by the Federal Law N 1759-1 dated October 18, 1991 “On the Road Funds in Russian Federation” with tax revenue going to the
Territorial Road Funds.29 The rate for 1995 is determined by the Instruction of the State Tax Services N 30 dated May 15, 1995. It differs for producers and traders. The former pays at the rate of 0.4 percent of total revenue net of VAT, special and excise taxes, and tax on the sales of fuels and lubricants. Traders pay at the rate of 0.03 percent of trade turnover minus the same taxes.30
28
In what follows, we mention only laws that introduce new taxes. Otherwise, the discussed tax is stipulated by that law.
29
Revenue collected in Moscow and St. Petersburg goes to the Federal Road Fund.
30
Gross revenue and trade turnover differs in assessment of costs. Gross revenue for traders does not include the cost of goods intended for re -sale only, while trade turnover includes the value of all items sold .
The instruction explains that budgetary and not- for-profit organizations pay on total revenue from commercial re-sales. Since commercial re-sales are not the main activity for non-commercial sectors, we consider that they are exempt from taxation. The share of budgetary organizations is found from GKS [2000b, table 2.11] as the ratio of the total output generated by non-commercial service providers to all operators included in the sector. Agriculture and highway maintenance organizations are exempt as well.
Taxes on Assets
3. Corporate property tax
This provincial tax is introduced by the Federal Law N 2030-1 dated December 13, 1991 “On Taxation of Corporate Property”. The law sets the rate of not more than 1 percent of the value of corporate assets. The specific rate is set by regional authorities. Corporate assets comprise tangible and intangible capital, inventories, and work-in-progress, which belong to the enterprise at its residual value.31 Budgetary organizations and NGO, agriculture, education and culture, science, residential and communal services are exempt. Property that is used for food processing, highways and railroads, pipelines, electric and communication lines, and satellites are excluded from tax base.
The maximum rate is raised to 2 percent by the Federal Law N 62-FZ dated April 25, 1995 “On the Introduction of Amendments and Supplements in the Law on Taxation of Corporate Property”. The law specifies that it applies to legal relationships that originates from January 1, 1995 and, hence, the rate of 2 percent holds for the whole year.
The Instruction of the State Tax Services N 33 dated June 8, 1995 “On the Rules of Calculation and Payment to Budget of the Tax on Corporate Property” explains that currency, bank deposits, and other liquid assets are exempt from taxation.
Taxes on Wage Fund
4. Pension Funds
The Federal Law N 340-1 dated November 20, 1990 “On State Pensions in RSFSR” states that state pensions are paid by the extra-budgetary Pension Fund of the Russian Federation. The law stipulates that employers pay to the Fund proportionally to their wage bill that includes all compensations for labor services that are used as the basis for determining individual pension level. The tax rate is set annually by a federal law. For 1995, the rate is determined by the Federal Law N 3-FZ dated January 10, 1995 «On the Insurance Contributions to the Pension Fund, Social Insurance Fund, State Employment Fund, and Mandatory Medical Insurance Funds». It is the same as in 1994. The
Government Edict N 61 dated February 3, 1994 with the same name preserves the rate of the second half of 1993. The latter is set at 28 percent by the Decree of the Supreme Soviet N 5357-1 dated July 9, 1993 with the same name. Thus, the rate is 28 percent.
31
Residual value for capital assets is determined as its purchase pric e plus the cost of its upgrading minus CCA that are granted because of this asset. The value of inventories and work-in-progress is found as its cost.
The Appendix to the Letter N V3-6-15/46 dated February 16, 1994 «Methodology on Answering the Questions on the Practical Use of Laws and Documents that Regulate the Rules of Contributions to the State Extra-Budgetary Funds» explains that agricultural producers pay 20.6 percent.
5. Social Insurance Fund
The Presidential Decree N 822 dated August 7, 1992 “On the Fund of Social Security of the Russian Federation” establishes the aforementioned fund and specifies that it
accumulates employers’ contributions. Tax base and rates are set by the same laws as above.
Tax rate for 1995 is 5.4 percent of the wage bill. The Federal Law N 9-FZ dated July 1, 1994 “On the Federal Budget for 1994” stipulates that the wages of servicemen are not subject to mandatory contributions to the Social and Medical Insurance, and Employment Fund for that year. This paragraph is preserved by the Federal Law N 39-FZ dated March 31, 1995 “On the Federal Budget for 1995”.
6. Mandatory Medical Insurance Funds
This extra-budgetary tax is introduced by the Decree of the Supreme Soviet N 4543-1 dated February 24, 1993 “On the Rules of Payment of Insurance Contributions to the Federal and Territorial Mandatory Medical Insurance Funds”. According to the decree employers contribute 3.6 percent of wage bill to these extra-budgetary funds. The Federal Fund gets 0.2 percent while the Territorial Funds receive 3.4 percent. This rate is updated by the same regulations as above. The same exemption as above applies.
7. Employment Fund
This extra-budgetary tax is established by the Federal Law N 3307-1 dated July 15, 1992 “On Introduction of Amendments and Supplements to the Federal Law On Employment in RSFSR”. The law stipulates that employers pay mandatory employment insurance. The rate is set every year by the same law that applies to the funds above. The rate of 2 percent is preserved for 1995. The same exemption as above applies.
8. Other payroll taxes
a) Transportation tax is a federal tax. It is introduced by the Presidential Decree N 2270 dated December 22, 1993 “On Changes in Taxation and Distribution of Fiscal Authority among Budgets”. The rate is determined as 1 percent of the wage bill. Budgetary
organizations are exempt.
The Letter N VZ-4-15/39n of the State Tax Services dated March 17, 1994 “On
by the same rules as the mandatory medical insurance contribution until a specific instruction is approved.32
b) The provincial fee to support educational establishments is introduced by the Federal Law N4178-1 dated December 22, 1992 “On the Introduction of Changes in Several Laws of the Russian Federation on Taxation”. Its rate is set by provincial legislatures. However, the Letter of the Ministry of Fina nce N 5-1/756 dated May 31, 1993 “On the Recommended Instructions on Some Municipal Taxes and Fees”, Appendix 5 stipulates that the rate cannot exceed 1 percent of the wage bill. The letter recommends to exempt budgetary organizations and this paper assumes that they are.
c) Targeted fees that citizens and enterprises-residents pay to support police, urban maintenance, educational and other municipal needs is introduced by the Federal Law N 2118-1 dated December 27, 1991 “On the Foundations of the Fiscal System in the Russian Federation”. It is determined proportionally to the minimal wage fund that is found as the average number of employees times annual minimal wage rate. The maximum tax rate is determined by the Federal Law N 3317-1 dated July 16, 1992 “On Amendments and Supplements in the Fiscal System of Russia”. It is 3 percent. The Letter of the Ministry of Finance N 5-1/756 dated May 31, 1993 “On the Recommended
Instructions on Some Municipal Taxes and Fees”, Appendix 3 recommends to exempt budgetary organizations and NGO, which recommendation this paper follows.
Taxes on Use of Mineral Resources
9. Tax on mining
This tax is established by the Federal Law N 2395-1 dated February 21, 1992 “On Mineral Resources” with a complex structure of distribution of payments among federal, provincial, and municipal budgets.33 The structure and tax base is amended by the Federal Law N 27-FZ dated March 3, 1995 “On the Introduction of Amendments and Supplements to the Law on Mineral Resources”. The latter law replaced the former from March 15, 1995
The Letter of the State Tax Services N NP-6-02/591 dated November 13, 1995 explains that tax base is the value of extracted minerals at producer’s prices excluding VAT, excise and special taxes. Natural gas is evaluated at the who lesale price that includes excise tax. The value of allowed mineral losses is excluded from the base after March 15, 1995 but is included before that date. We ignore this fact as insignificant.
The tax rate is specified in individual licenses. The Governme ntal Edict N 828 dated October 28, 1992 “On Approval of the Statute of the Rules and Conditions of Payment for the Right to Mine, to Use Shelf and Seabed” sets mandatory rate ranges for licenses. Until the license is issued, minimal rates are determined by the Governmental Edict N
32
No instruction appeared and the tax was annulled in 1997.
33
Since problems of fiscal federalism are outside the scope of this paper, we do not go into details on tax revenue distribution.
478 dated July 9, 1992 “On Temporary Minimal Rates of Payment for the Right to Mine”. Since individual licenses are not available, we use the minimal rates that are
Oil, natural gas, and coal – 8 percent Nickel – 4 percent
Peat and bituminous shale, iron ore, copper, bauxite, glass raw material, sand, gravel, and clay – 3 percent
Lead, zinc, tin, molybdenum – 2.5 percent Apatites and potassium salts – 1 percent
10. Tax to support prospecting
This tax is introduced by the same law as above. It applies to those companies that mine deposits discovered by state prospectors at state-owned lands.
The Letter of the State Tax Services N NP-6-02/591 dated November 13, 1995 explains that tax base is the value of sold minerals before March 15, 1995 and the value of extracted minerals since then. We ignore this fact in the paper as insignificant. Tax base for oil excludes VAT, special and excise taxes, export tariff and transportation expenses for exported products. Tax base for natural gas is the wholesale-regulated price (that includes excise tax). For the rest of minerals, the tax base is the value of minerals at producer price.
Appendix 2 to the Decree of the Supreme Soviet N 4546-1 dated February 25, 1993 “On Approval of the Statute on the State Extra-Budgetary Fund of Mineral Resources’
Prospecting of the Russian Federation” determines rates of payment for 1995. We use the following numbers
Oil and natural gas – 10 percent Hard fuels – 5 percent
Iron and chrome ores – 3.7 percent
Non-ferrous and rare earth metals – 8.2 percent Apatites and phosphates – 3.1 percent
Potassium salts – 1.7 percent
Other extracted materials (apart from underground water) – 5 percent
Taxes on foreign trade
11. Import duties
This federal tax is established by the Federal Law N 5003-1 dated May 21, 1993 “On Custom Tariff”. The law introduces import and export tariffs at rates that are approved by the Government of the Russian Federation. The specified import rates apply to the goods that originate in the countries with which Russia maintains the most favored nation regime.34 Rates are set either in monetary units per item or ad valorem.
34
Rates were amended relatively often and it is hard to trace individual changes. This paper takes the rates determined by the Governmental Edict N 454 dated May 6, 1995 “On Approval of Rates for Import Tariffs”. The edict refers to the edict N 169 dated March 10, 1994 with the same name but the latter is not available. Thus, rates set on May 6, 1995 are used for the whole year. Several individual amendments that were introduced in between are considered by the paper.35
12. Export duties
Taxes on export are introduced in the same law as above. The main documents that we use are the Governmental Edicts N 1103 dated October 30, 1993 “On Approval of the Rates of Export Tariffs” and N 858 dated August 31, 1995 “On Partial Amendments of the Rates of Export Tariffs”. Individual rates that this paper considers are provided by the Governmental Edicts
- N 862 dated July 19, 1994; - N 147 dated February 20, 1995;
- N 304 dated March 29, 1995 “On Export Tariff and Excise on Raw Oil Extracted on the Territory of the Russian Federation”;
- N 1064 dated November 2, 1995 “On Partial Amendment of Rates of Export Tariffs”; - N 1270 dated December 26, 1995
and the President ial Decree N 2213 dated December 26, 1994 “On Streamlining of the Export of Natural Gas”.
Taxes on Specific Goods
13. Excise tax
This tax is introduced by the Federal Law N 1993-1 dated December 6, 1991 “On Excise Tax”. The law determines the list of goods that are subject to the tax. Tax revenue
collected on some goods go towards federal budget, others contribute to provincial budgets and some are divided between them. The law explains that, in general, tax base is the value of goods at producer prices including excise.
The Instruction of the State Tax Services N 36 dated July 17, 1995 “On the Rules of Calculation and Payment of Excise Tax” explains the rules of payment. For example, if strong liquors are taxed at the rate of 85 percent and are sold at 50,000 rubles, the tax due is 42,500.
However, the payment of excise tax on oil is determined differently. The Instruction of the State Tax Services N 40 dated November 1, 1995 “On the Rules of Payment of Excise Tax on Oil including Gas Condensate and Natural Gas” specifies that the amount of excise tax is per ton of product. It is not included in its value at producer’s price.
35
Particularly, we use the Governmental Edict N 1101 dated September 27, 1994 that annuls import duties on vegetable oils.
The list of the goods that are subject to excise tax was changed several times. We use a reduced form of the list that is provided by the Instruction N 36
Vodka and strong liquors – 85 percent Grape wines – 46.5 percent
Sparkling wines – 47.5 percent Fruit wines – 30 percent Beer – 40 percent
Tobacco products – 20 percent Cars and light trucks – 10 percent Leather and fur apparel – 35 percent Tires – 15 percent
Petrol – 20 percent
The rates on oil and natural gas were changed often in 1995. The Governmental Edict N 678 dated July 13, 1993 “On the Rate of Excise Tax on Natural Gas” sets the rate of excise tax at natural gas at 15 percent of the value at producer price. The Edict N 208 dated February 28, 1995 changes the rate to 25 percent starting from March 27, 1995. Finally, the Edict N 859 dated September 1, 1995 raises the rate to 30 percent starting from September 1, 1995.
The same story applies to raw oil. The Governmental Edict N 320 dated April 14, 1994 sets the rate of the excise tax on oil at Rubles 14,750 per ton starting from May 1, 1994. At the beginning of each month, the rate is indexed by the coefficient of US dollar exchange rate as set by the Central Bank of Russia. The Edict N 304 dated March 29, 1995 “On Export Tariff and Excise Tax on Raw Oil Extracted on the Territory of the Russian Federation” updates the rate to 39,200 rubles per ton with further indexing starting April 1, 1995. Finally, the Edict N 590 dated June 26, 1995 raises the rate to 50,000 rubles for most producers starting from July 1, 1995 (listing several firms that are subject to lower rates).36
The Order of the State Customs Committee N 49 dated January 30, 1993 “On the Collection of Value-Added and Excise Taxes on Goods Exported to and Imported from the Russian Federation” explains that excise tax rates on foreign trade are the same as to domestic products. They apply to the custom value of goods excluding tariff. For
example, if the custom value is 1,000 rubles and the excise tax rate is 10 percent, the value of excise tax is 100 rubles. The Federal Law N 5604-1 dated August 6, 1993 “On the Introduction of Amendments in the Law on Excise Taxes” stipulates that excisable goods that are exported to non-CIS countries are not taxed.
14. Taxes on the sales of fuels, lubricants, and road vehicles
This tax is introduced by the Federal Law N 1759-1 dated October 18, 1991 “On the Road Funds in the Russian Federation”. Federal Road Fund is a part of budget but Territorial Road Funds are extra-budgetary.
36