Sustainable Development Business Case Report
Commercial Buildings — Eco-Efficiency
SD Business Case
™Version 1 • November 2007
Power Generation
Transportation
Agriculture
Forestry
Waste Management
Energy Exploration
and Production
Energy Utilization
Energy
Water Heating
Auxiliary Equipment
HVAC
Lighting
Motors & Controls
HVAC
Domestic
Water
Solid Waste
Other
Organic
Paper
Plastic
Metal/Glass
Commercial
Eco-Efficiency
* Copyright © 2007 by Canada Foundation for Sustainable Development Technology (“SDTC™”). All Copyright Reserved. Published in Canada by SDTC™. No part of the SD Business CaseTM may be produced, reproduced, modified, distributed, sold, published, broadcast, retransmitted, communicated to the public by telecommunication or circulated in any form without the prior written consent of SDTC, except to the extent that such use is fair dealing for the purpose of research or private study (unpublished, or an insubstantial copy). To request consent please contact SDTC. All insubstantial copies for research or private study must include this copyright notice.
The SD Business Case™ is provided “as is” without warranty or representation of any kind. Use of the information provided in the SD Business Case™ is at your own risk. SDTC does not make any representation or warranty as to the quality, accuracy, reliability, completeness, or timeliness of the information provided in the SD Business Case™.
Sustainable Development Technology Canada™, SDTC™, SD Business Case™ and SDTC STAR™ are trade marks of Canada Foundation for Sustainable Development Technology.
Sustainable Development Business Case Report*
Commercial Buildings — Eco-Efficiency
SD Business Case
™Version 1 • November 2007
Energy Utilization
Energy
Water Heating
Auxiliary Equipment
HVAC
Lighting
Motors & Controls
HVAC
Domestic
Water
Solid Waste
Organic
Paper
Plastic
Metal/Glass
Commercial
Eco-Efficiency
Table of Contents
1
Overview of SD Business Case
TM ... 11.1 The SD Business Case™ Plan
... 11.1.1 Primary Audience
... 11.1.2 The SDTC STAR™ Tool
... 21.1.3 Sectors to be assessed by the SD Business Case™
... 2Figure 1 : SD Business Case™ Investment Roadmap ... 3
1.1.4 Investment Categories to be Analyzed
... 41.1.5 Conclusions Framework
... 41.2 The SDTC STAR™ Process: Data Collection and Analysis
... 5Figure 2 : The SDTC STAR™ Process ... 5
1.2.1 Assessment Descriptions
... 6Figure 3 : SDTC Funding Support ... 7
1.2.2 Output Structure
... 7Table 1 : Market Plot Indicators ... 8
Table 2 : Technology Plot Indicators ... 9
Figure 4 : Sample Technology Plot ... 10
1.2.3 Conclusions and Investment Priorities
... 102
Executive Summary
... 122.1 Commercial Buildings
... 122.1.1 Energy Utilization
... 122.1.2 Water Consumption
... 132.1.3 Solid Waste Production
... 132.2 Commercial Buildings Vision Statements
... 132.2.1 Energy
... 132.2.2 Water
... 132.2.3 Solid Waste
... 132.3 Non-Technical Needs
... 132.4 Technical Needs
... 142.5 Investment Priorities
3
Report
Scope and Approach
... 163.1 Report Scope
... 163.1.1 Commercial Building Classification
... 163.1.2 Operational Focus
... 16Figure 5 : Commercial Building Lifecycle Energy Consumption ... 17
3.1.3 Technology Applications
... 173.1.4 Strategic Approach
... 17Figure 6 : Sustainable Buildings Strategy ... 18
3.1.5 Data Sources
... 184
Background
... 194.1 Commercial Building Stock
... 194.1.1 Building Type
... 19Table 3 : Building Type by End Use in 2004 ... 19
4.1.2 Building Age
... 19Figure 7 : Commercial Buildings by Age ... 19
4.1.3 Building Activity
... 204.2 Resource Utilization
... 204.2.1 Energy End-Use
... 20Figure 8 : Total End-Use Energy by Sector in 2004 ... 20
Figure 9 : Commercial End-Use Energy by Source in 2004 ... 20
Figure 10 : Energy Sources and Uses ... 21
4.2.2 Energy Use by System Type
... 21Table 4 : Commercial Energy End-Use by System Type in 2004 ... 21
4.2.3 Energy Use Trends
... 22Figure 11 : Commercial Energy Use for 1990-2004... 22
Figure 12 : Impacts on Commercial Energy Use for 1990-2004 ... 23
Figure 13 : Commercial Energy Use and Floor Area for 1990-2004 ... 23
4.3 Energy-Related Emissions
... 27Figure 18 : GHG Emissions by Sector in 2004 ... 27
Figure 19 : Commercial Energy-Related GHG Emissions, 1990-2004 ... 28
Figure 20 : Energy-Related Emissions Intensity Projections from STARTM ... 28
4.4 Water
... 294.4.1 Water Consumption
... 29Figure 21 : Municipal Water Use by Sector ... 29
4.4.2 Water Consumption by System Type
... 30Figure 22 : Water Use in Commercial Buildings ... 30
Table 5 : Federal Office Building Water Consumption by End-Use ... 30
4.4.3 Water Consumption Trend
... 31Figure 23 : Daily Commercial Water Consumption Trend, 1983-1999 ... 31
4.4.4 Water Supply Issues
... 314.5 Solid Waste
... 32Figure 24 : Solid Waste Generation by Commercial Sub-Sector in Ontario in 2002 ... 32
Figure 25 : Ontario IC&I Disposed Waste in 2002 ... 33
5
Industry Vision
... 345.1 Key Market Drivers
... 345.1.1 Cost Reduction
... 345.1.2 Value Creation
... 345.2 Future Building Functionality
... 345.2.1 Knowledge-Based Work
... 345.2.2 Flexible Workplaces
... 345.2.3 Smart Building Technologies
... 355.2.4 Sustainable Buildings Philosophy
... 355.3 Vision Statements
... 355.3.1 Vision Summaries
... 35Table 6 : Commercial Eco-Efficiency Vision Statements ... 36
5.3.2 Energy Vision
... 36Figure 26 : Energy Use Intensity Reduction from STARTM ... 36
5.4 Needs Assessment
... 375.4.1 Non-Technology Needs
... 37Figure 27 : Current Commercial Building Value Chain ... 38
5.4.2 Technology-Based Needs
... 406
Market Assessment
... 426.1 Market Potential
... 42Table 7 : Market Potential Summary ... 42
Table 8 : Energy Reduction Vision Details from STARTM ... 43
6.2 Market Plot
... 44Figure 28 : Market Plot ... 44
7
Technology Assessment
... 457.1 Integrated Building Design
... 45Table 9 : Integrated Building Design Technology Summary ... 45
Figure 29 : Integrated Building Design Technology Plot ... 46
7.2 Building Envelope Improvements
... 46Table 10 : Building Envelope Improvements Technology Summary ... 47
Figure 30 : Building Envelope Improvements Technology Plot ... 47
7.3 Operator & Occupant Management Tools
... 47Table 11 : Operator & Occupant Management Tools Technology Summary ... 48
Figure 31 : Operator & Occupant Management Tools Technology Plot ... 48
7.4 System & Equipment Efficiency Improvements
... 48Table 12 : System & Equipment Efficiency Improvements Technology Summary ... 49
Figure 32 : System & Equipment Efficiency Technology Plot ... 50
7.5 Optimized Resource Supply
... 50Table 13 : Optimized Resource Supply Technology Summary ... 52
Figure 33 : Optimized Resource Supply Technology Plot ... 52
8
Statements of Interest
... 539
Investment Priorities
... 549.1 Near Term Investments
... 54Table 15 : High Priority Near Term Investments ... 54
Table 16 : Medium Priority Near Term Investments ... 54
9.2 Long Term Investments
... 54Table 17 : High Priority Long Term Investments... 54
Table 18 : Medium Priority Long Term Investments ... 55
9.3 National Strategy Impacts
... 559.3.1 Sustainable Buildings Policy
... 5510 Acknowledgements
... 571
Overview of SD Business Case
TMSustainable Development Technology Canada is a foundation created by the Government of Canada that operates a $550 million fund to support the development and demonstration of clean technologies – solutions that address issues of climate change, clean air, clean water, and clean soil to deliver environmental, economic and health benefits to Canadians.
SDTC is pleased to present this Commercial Buildings Eco-Efficiency Investment Report, which is one in a series on the current state of sustainable development and future investment priorities in Canada. This report is the result of collaboration from a wide range of stakeholders. It is based on reports, studies, and research findings by various industry associations and government initiatives. We hope you find the information useful, and look forward to working with you as we further sustainability in Canada.
1.1 The SD Business Case™ Plan
SDTC invests in areas where Canada has a strong capability, or potential, and where SDTC can provide the most value. To that end, SDTC has developed a comprehensive evaluation and decision-support process that investigates various technologies, their markets, the needs they address, and the barriers they must overcome to achieve market success.
The SD Business CaseTM is founded on the concept of creating a common vision of market potential, as described by those in the industry. It
incorporates their ideas, expectations and knowledge into a single statement of purpose, so that the outcomes are relevant, pragmatic, and
realizable. There are many different approaches that could be used to analyze individual technologies or economic sub-sectors. Each stakeholder group has unique challenges and expectations, which are expressed and analyzed to suit their own needs. With this in mind, the SD Business CaseTM has
been developed to provide a common benchmark for all participants, as well as a consistent and reliable means of comparing technologies in a number of diverse and expanding areas. The SD Business CaseTM serves as a guide to SDTC for future technology investment priorities as well as a means of
collecting non-technology input that may be useful in addressing public policy issues.
Work on the SD Business CaseTM could not have been done without the participation and guidance of opinion leaders and experts throughout the
country. The philosophy at SDTC is to work with and through others and SDTC is thankful to individuals for their assistance and contributions to the success of the SD Business CaseTM.
1.1.1 Primary Audience
The primary audiences for the SD Business CaseTM include:
Industry Stakeholders – To help them identify key sectoral challenges and priority areas for potential future investment, and to assist in partnering with SDTC.
Canadian Researchers – To assist in providing direction and focus for successful future endeavors including indicators of the key challenges to be addressed in priority technology areas as they enter or exit the development and demonstration stages of the commercialization process. Relevant Government Departments – To provide a comprehensive decision making framework to assist with technology investment priorities for its key stakeholders and funding bodies. The SD Business CaseTM may also be used to help identify and manage technological
issues that are beyond SDTC’s immediate mandate, as well as non-technical market barriers that can be addressed by other players, policies, funding sources, and financial instruments.
Other Stakeholders – To provide a clear and consistent information base on relevant technology sectors, and an open dialogue on non-technology issues facing companies in a number of Canadian economic sectors.
1.1.2 The SDTC STAR™ Tool
The Sustainable Technology Assessment Roadmap (STARTM) is an analytical tool that is used to produce the SD Business CaseTM reports. It is an
iterative analytical process that combines data, reports, stakeholder input, and industry intelligence in a common information platform. It uses a series of criteria selection screens to assess and sort relevant information from a variety of sources. The output is a series of Investment Reports that highlight key technology investment opportunities for each sector under study.
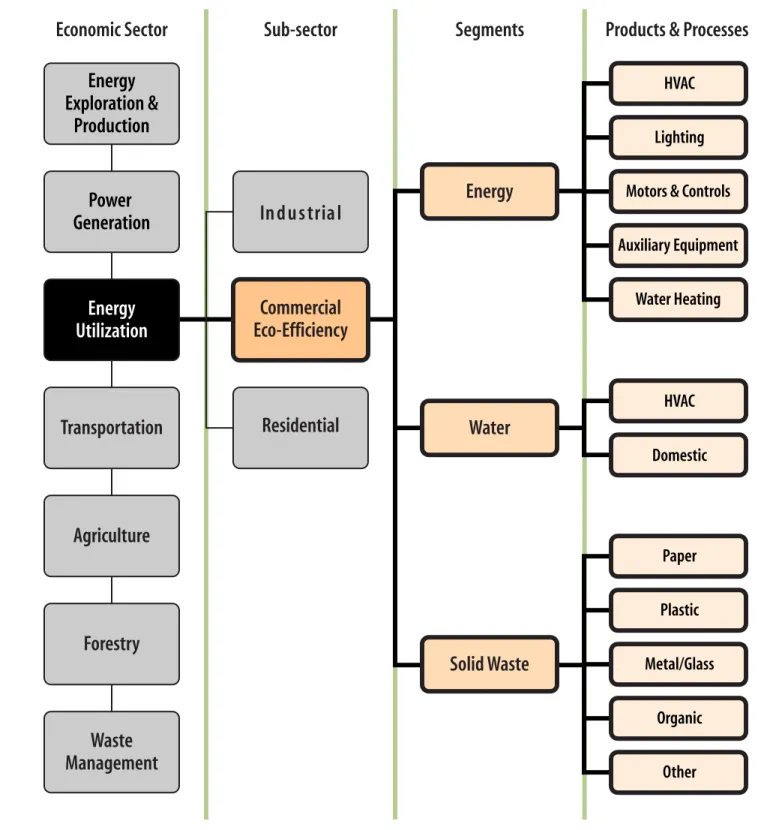
1.1.3 Sectors to be assessed by the SD Business Case™
The overall SD Business CaseTM project focuses on seven of Canada’s primary economic sectors. An illustrated version of the full project and master
roadmap, Figure 1, highlights the selected areas of study.
Energy Exploration & Production – Including Clean Conventional fossil fuels and Renewable Fuels (bio-fuels, hydrogen production and purification). Renewable Electricity and Renewable Fuels are linked as they share a number of technological platforms.
Power Generation – Including Clean Conventional and Renewable Electricity Generation (wind, solar PV, bioelectricity and stationary fuel cells). Energy Utilization – Improving the effectiveness of the application of current end-use technologies in industrial, commercial and residential sectors and improving energy efficiency.
Transportation – Including Systems Efficiency and Fuel Switching. Fuel Switching and Renewable Fuels are linked as they share a number of technological platforms.
Agriculture – Addressing solid waste or Biomass conversion to Fuels and eliminating air and water contaminants produced by manure. Forestry and Wood Products – Addressing development of wood waste recycling technologies to harness energy resource potential, reduce emissions and improve productivity and profits.
Waste Management – Addressing the various forms of waste management from municipal (residential and commercial) and primary and secondary industrial sources.
Note:
Some of these sectors may be covered through work in other sectors. For example, many Agriculture and Forestry technologies are common to Renewable Fuels in the Energy Exploration and Production Sector.
Figure 1 :
SD Business Case™
Investment Roadmap
Energy
Exploration &
Production
Power
Generation
Energy
Utilization
Transportation
Agriculture
Forestry
Waste
Management
Economic Sector
Sub-sector
Segments
Products & Processes
HVAC
Water Heating Motors & Controls Auxiliary Equipment HVAC Lighting Domestic Paper Plastic Metal/Glass Organic Other
Residential
Energy
Water
Solid Waste
Industrial
Commercial
Eco-Efficiency
1.1.4 Investment Categories to be Analyzed
The SD Business CaseTM provides conclusions in three primary categories of investment opportunities:
Short Term Investment Priorities – These are investments that could be made within the next 2-6 years that could have a direct and positive impact on the market over the following 4-8 years.
Long-Term Investment Priorities – These are early stage investments that could be made within the next 2-6 years but where the environmental impacts are realized over the longer term (more than 8 years).
National Strategy Impacts – Although it is not in SDTC’s mandate to advance policy initiatives, over the course of developing the SD Business Case™ a number of policy related enablers and barriers to the development and implementation of sustainable technologies have been identified. A summary of these issues and their potential impact on Canada’s ability to meet its environmental goals is included in the analysis.
1.1.5 Conclusions Framework
The SD Business Case™ is a consistent, referenced set of recommendations and investment indicators which can be used by stakeholders to support investment opportunities and priorities. The range of technologies and the assessment of their potential impact is too large and complex to simplify to a single number, answer, result or solution. The output should be viewed within the context of the information collected during the business case development process. Contributors to the business case have made every effort to be as objective, comprehensive and analytical as possible. Although based on rigorous analysis of the best available information, the SD Business Case™ serves only as an indicator of investment priorities; it is not to be used as a definitive tool to accept or reject individual projects or technologies. Final decisions on whether SDTC will invest will be made by taking into account all relevant conditions and opportunities.
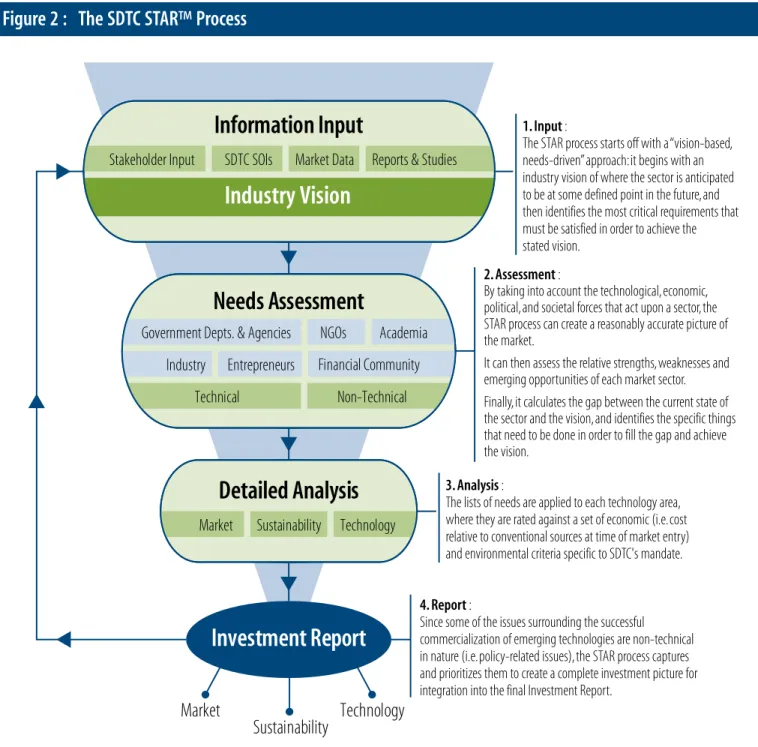
1.2 The SDTC STAR™ Process: Data Collection and Analysis
The STARTM process uses a “vision-based, needs-driven” approach: it begins with an industry vision of where the sector is anticipated to be at some
defined point in the future, and then identifies the most critical requirements that should be satisfied in order to achieve the stated vision.
Figure 2 : The SDTC STAR™ Process
Industry Vision
SDTC SOIs
Stakeholder Input Market Data Reports & Studies
Industry Entrepreneurs Government Depts. & Agencies
Financial Community NGOs
Needs Assessment
Non-Technical TechnicalInformation Input
Market Sustainability Technology
Detailed Analysis
Market Sustainability TechnologyInvestment Report
Academia 1. Input :The STAR process starts off with a “vision-based, needs-driven” approach: it begins with an industry vision of where the sector is anticipated to be at some defined point in the future, and then identifies the most critical requirements that must be satisfied in order to achieve the stated vision.
2. Assessment :
By taking into account the technological, economic, political, and societal forces that act upon a sector, the STAR process can create a reasonably accurate picture of the market.
It can then assess the relative strengths, weaknesses and emerging opportunities of each market sector. Finally, it calculates the gap between the current state of the sector and the vision, and identifies the specific things that need to be done in order to fill the gap and achieve the vision.
3. Analysis :
The lists of needs are applied to each technology area, where they are rated against a set of economic (i.e. cost relative to conventional sources at time of market entry) and environmental criteria specific to SDTC's mandate.
4. Report :
Since some of the issues surrounding the successful commercialization of emerging technologies are non-technical in nature (i.e. policy-related issues), the STAR process captures and prioritizes them to create a complete investment picture for integration into the final Investment Report.
The above process is repeated for each area of study, until a complete picture of the market emerges to the satisfaction of SDTC and the key market stakeholders.
SDTC STAR™ is a trade mark of Canada Foundation for Sustainable Development Technology.
By taking into account the technological, economic, political, and societal forces that act upon a sector, the STARTM process can create a reasonably
The lists of needs are applied to each technology area, where they are rated against a set of economic criteria, (cost relative to conventional sources at time of market entry), and environmental criteria specific to SDTC’s mandate. Since some of the issues surrounding the successful commercialization of emerging technologies are policy-related and non-technical in nature, the STARTM process captures and prioritizes them to create a complete investment
picture for integration into the final Investment Report.
This process is repeated for each area of study, until a complete picture of the market emerges to the satisfaction of SDTC and the key market stakeholders.
1.2.1 Assessment Descriptions
Once the market vision has been accepted, the economic sectors and their associated technologies are assessed through the following screens:
Market
This focuses on the ability of the market to use the emerging technologies that are currently at the development and demonstration stages. It identifies what needs to be done in order to maximize the application and acceptance of the technology, with a focus on financial and economic performance. The main components of the assessment are:
General Market Description – An overview of the sector under consideration, with a comparison to conventional or competing sectors. Market Potential – An indication of the immediate growth potential for the sector under consideration.
The data is drawn from industry literature and stakeholder feedback, and shows the theoretical and realizable potential as well as equipment installed costs. Using linear extrapolation, it then estimates the anticipated potential over the target period. Due to the rapidly evolving nature of emerging markets, it is necessary to conduct this assessment a number of times as conditions change. The primary purpose is to understand the gap between today’s situation and the vision for each sub-sector. This helps to determine the required rate of innovative developments and the amount and timing of capital placements.
There are three Market Assessment criteria used in the STARTM process;
Stage of Investment – An assigned value, on a scale of 1-10, that takes into account market barriers, the amount of time expected for the technology to achieve full commercialization, market infrastructure issues and impediments, and current state of codes, standards and regulations. Economic Efficiency – An assigned value, on a scale of 1-10, that takes into account technology spin-off potential, product replicability and scale-up potential, market size and dynamics, competitiveness, pricing and financing, and export potential.
Emissions Reduction Potential – A calculated value of the difference in GHG emissions between conventional technologies and the alternative technologies within the sub-sectors under consideration. It is shown in megatonnes of carbon dioxide equivalent (MtCO2e) and is
the amount of CO2e expected to be reduced or displaced within the next two to six years as a consequence of commercializing the subject
technologies. GHG is a proxy used as a general indicator of emissions reductions since, for most technologies, there is a positive correlation between GHG and other air emissions.
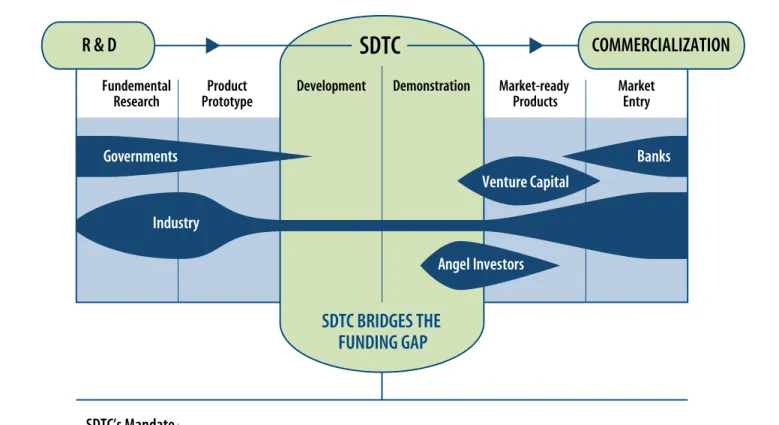
Figure 3 : SDTC Funding Support
R & D
Fundemental
Research PrototypeProduct Development
SDTC
SDTC BRIDGES THE FUNDING GAP
Demonstration Market-ready
Products MarketEntry
COMMERCIALIZATION Angel Investors Venture Capital Governments Industry Banks SDTC’s Mandate :
The Market Assessment is conducted from the perspective of SDTC’s mandate, which is to support the development and demonstration of emerging sustainable technologies in Canada at critical stages in the development cycle. Specifically, SDTC is focused on those technologies that are between prototype development and market-ready product stages. The size and span of the above blocks are indicative of the relative timing and amount of funding from various sources.
Technology
This concentrates on the technologies that need to be brought to market in order to achieve the stated vision. There are 15 fundamental ranking criteria, which are weighted and rolled up into two principal impact criteria:
Economic Impact – The developmental and financial issues related to a specific technology that can/will influence sector growth, technological inter-dependencies, infrastructure improvement, and the cost of environmental improvement; and,
Environmental Impact – The magnitude of the emissions reduction potential, reductions of regional environmental pollutants, the life cycle emission returns, and the time at which these emissions reductions are most likely to occur.
1.2.2 Output Structure
There are three main categories in the output: Vision and Needs, Market Assessment and Technology Assessment. The STARTM process also performs a
Sustainability Assessment and Risk Assessment and combines the results from all of these Assessments to develop the Investment Report conclusions.
Vision and Needs
industry. The Statement is reviewed by the stakeholders to confirm content accuracy, and help establish the realistic market potential of the technologies being considered. The Vision Statement acts as the primary focus for further discussions and analysis within the STARTM process.
In the case of the commercial building industry, the vision is based on more efficient – and environmentally acceptable – resource utilization within the sector. Energy (measured in petajoules – PJ), water (measured in Litres – L) and solid waste (measured in tonnes – t) are the three resource areas that are considered.
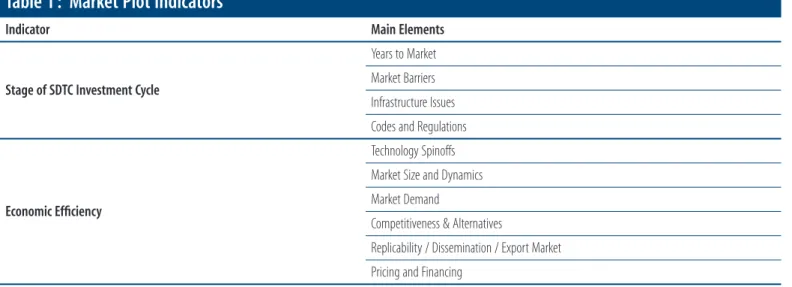
Market Assessment
The Market Assessment output data is presented in a “Circle Chart,” with Stage of Investment on the X-axis, Economic Efficiency on the Y-axis, and
Emissions Reduction Potential on the Z-axis. The Stage of SDTC Investment Cycle and Economic Efficiency analyses consider a number of factors, which are summarized below. The scores are based on a scale of 1 – 10: a high score indicates a fit within the projected time frame and a high likelihood of widespread market adoption.
Table 1 : Market Plot Indicators
Indicator Main Elements
Stage of SDTC Investment Cycle
Years to Market Market Barriers Infrastructure Issues Codes and Regulations
Economic Efficiency
Technology Spinoffs Market Size and Dynamics Market Demand
Competitiveness & Alternatives
Replicability / Dissemination / Export Market Pricing and Financing
Circle Location – In general, plots that show in the upper right-hand corner are considered attractive to private-sector investors because they have high Economic Efficiency and are near to market entry. Conversely, anything in the lower left-hand corner requires additional work to move to the market-ready zone.
Circle Size – The size of each circle represents the magnitude of the difference in emissions between the base case and the alternative case. GHGs, expressed in CO2e, are used as a proxy for all air-related emissions. In instances where there is a negative correlation amongst CO2e
and other forms of emissions (for example NOx acts inversely to CO2e in many combustion processes), these will be noted in the model or in the
actual technology as it is evaluated.
Circle Colour – Each circle represents a different measure group and is identified by a colour in order to distinguish them on the plot. By plotting the outcomes in this way it is possible to get an overall snapshot of the position and potential of each sub-sector relative to others. Many of the emerging technologies have the capacity to also reduce regional pollutants and other environmental impacts: this information is captured within STARTM, but is not illustrated separately on the market plot. Separate plots can be generated for these environmental aspects.
Technology Assessment
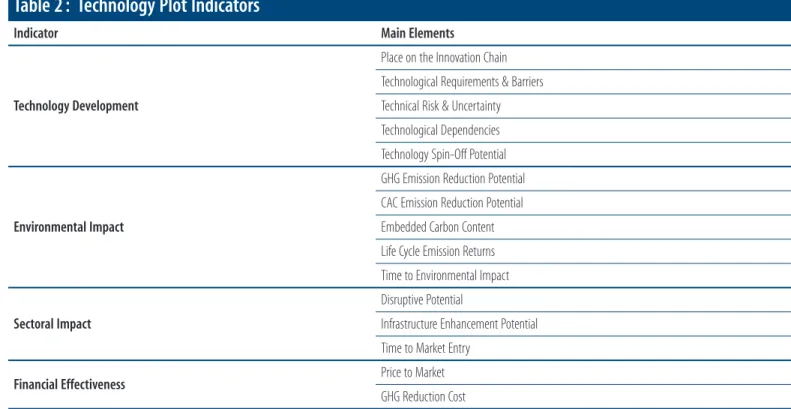
This assessment focuses on the technology plot position of each technology area. The position of each plot is the result of the numerical ranking of the individual technological assessments. Each technology is mapped on a scatter graph, with Economic Impact on the X-axis and Environmental Impact on the Y-axis (see Figure 4 on the following page).
Table 2 : Technology Plot Indicators
Indicator Main Elements
Technology Development
Place on the Innovation Chain Technological Requirements & Barriers Technical Risk & Uncertainty Technological Dependencies Technology Spin-Off Potential
Environmental Impact
GHG Emission Reduction Potential CAC Emission Reduction Potential Embedded Carbon Content Life Cycle Emission Returns Time to Environmental Impact Sectoral Impact
Disruptive Potential
Infrastructure Enhancement Potential Time to Market Entry
Financial Effectiveness Price to Market
GHG Reduction Cost
The closer a technology plots to the upper right hand corner, the greater its potential relative to the other technologies. Technologies that are considered a breakthrough or have a potentially disruptive impact1 are shown in red on the supporting table. Since STARTM is an iterative process, the plot values
Figure 4 : Sample Technology Plot
Environmental Impacts
LOW HIGH HIGH MEDIUM MEDIUMEc
on
om
ic Impacts
1.2.3 Conclusions and Investment Priorities
The STARTM process concludes by combining the results from the Vision and Needs, Market and Technology Assessments, and divides them into short and
long term priorities and strategic impacts.
Short-Term Investment Priorities – These are investments that could be made within the next two to six years that could have a direct and positive impact on the environment.
Long-Term Investment Priorities – These are early stage investments that could be made within the next two to six years but that would aid Canada in achieving its longer-term, emissions-reductions objectives. SDTC recognizes that the investments must be made now in order to produce results in the future.
National Strategy Impacts – A summary is created outlining the potential impact that the investments may have on Canada’s national strategy – including potential policy development – to meet its climate change and sustainable development commitments.
The successful emergence of sustainable technologies in Canada will be largely dependant upon the resolution of a range of non-technical issues. These issues, when combined with the technology issues and opportunities, could have a profound impact on Canada’s national strategy.
Important Notes to the Reader:
While these conclusions indicate areas to place emphasis, SDTC recognizes that it is not possible to anticipate all new technologies and their impacts, and new technologies in areas or sectors not on the list are not excluded from consideration.
The output of the Roadmap process is not a single digit, answer or result. It is a series of indicators that support a set of possible investment opportunities, which can only be viewed within the context of the information provided. The final investment decision must still be made by accounting for all possible and relevant conditions and requirements, as viewed by the final decision-maker. The contributors to the Roadmap process have made every effort to be as objective, comprehensive and analytical as possible.
The numeric ratings used in the assessment process are relative; they are not absolute. For example, the Time to Market rating is based on a scale of one to ten; it does not indicate the actual number of years to get to market. This approach is necessary to overcome the wide range of qualifiers associated with each projection made by industry and government. The one to ten scale provides a common benchmark approach. Unless otherwise stated, the term “market” refers to the set of technology areas under examination as a direct result of a scoping exercise to determine an appropriate breadth of coverage. It does not refer to an entire market.
Emerging Technologies that have not been included within any current sector assessment may be considered in future upgrades and published releases. SDTC will receive and evaluate opportunities in all areas falling within the SDTC mandate. However, where there is insufficient material or interest identified, no assessment priority will be assigned to the STARTM tool.
2
Executive Summary
This SD Business CaseTM report focuses on impacts of energy and water utilization and solid waste production on commercial building operations
in Canada. It examines market characteristics such as building size, construction and type, establishes a set of vision statements for the industry, and identifies the technologies that can help create more sustainable buildings in both the existing and future stock.
The report covers all types of commercial buildings; including offices, institutional and public service such as health care and education, hospitality, entertainment, and retail and wholesale trade. Together, they are simply referred to as “commercial”. Multi-unit residential buildings (MURBs) are not included in much of the analysis because they are classified as residential buildings by Natural Resources Canada (NRCan). However, many of the technologies and issues do apply to MURBs. Some utilities and other organizations, usually for historical reasons, do not use statistical agency based nor government policy and program based building classification systems. As such, caution must be used to avoid confusion in discussion of policy, program and technology development, social or environmental issues.
The focus of the analysis is on building operations. Although embodied energy, material selection, construction, and demolition are important in a life cycle approach to buildings, the largest environmental impacts are a result of the operation of buildings. Operations are the most important aspect of commercial building eco-efficiency analysis. SDTC understands the critical importance of a full lifecycle approach, and incorporates the entire building lifecycle considerations into individual project investment assessments on a case-by-case basis.
The technologies included in this report are applicable to most types of commercial buildings, but may be applied in different ways for different types of buildings. For example, advanced control system technologies used in a small office building are likely to be quite different from those required in a large health care complex.
The baseline data used in the STARTM analysis is derived primarily from NRCan sources. Every effort has been made to adjust for any discrepancies
between the data sources in order to establish the most reasonable baseline. The variations, while statistically significant, do not impact the strategic direction of the outcome or recommendations in this report. They do, however, highlight the need for consistent, reliable and comprehensive performance-based building data.
2.1 Commercial Buildings
In 2004 there were about 591 million m2 of commercial floor space in Canada, up from 466 million m2 1990. There are currently about 395,000
commercial buildings in Canada, up from approximately 380,000 in 2004.
2.1.1 Energy Utilization
In 2004, the commercial building sector accounted for about 14%, or 1,171 petajoules (PJ) of total secondary energy use in Canada. Electricity and natural gas together made up about 85% of energy consumed, with about one half (52%) of the energy going to space heating.
Between 1990 and 2004 commercial energy consumption increased by 35% (from 867 PJ to 1,171 PJ). 72% of the increase was due to a change in activity level driven by an increase in total floor area.
Floor area only increased by 27% over the fourteen year period. Energy use intensity increased from 1.47 GJ/m2 to 1.60 GJ/m2. This occurred despite a 3
PJ reduction due to energy conservation efforts and a decrease in weather-related heating requirements . At present growth rates, energy use could rise to about 1,698 PJ, and energy use intensity to 2.16 GJ/m2, by 2030.
Energy-related GHG emissions in the commercial sector increased by 42% from about 48 MtCO2e to 68 MtCO2e between 1990 and 2004. Similarly,
energy related GHG emissions intensity rose from 0.10 tCO2e/m2 to 0.12 tCO2e/m2, and is projected to reach 0.14 tCO2e/m2 (110 MtCO2e) by 2030. Energy
2.1.2 Water Consumption
Water consumption in the commercial building sector rose from 2.3 billion litres per day to about 2.8 BL/day between 1983 and 1999. The sector currently consumes about 1.2 trillion litres per year of municipally-treated water. All of this water is chemically treated and purified to potable water quality, irrespective of how it is used. It is currently used to run mechanical equipment, flush toilets and water landscaping: only a small portion is used for human consumption. Very little water is recycled or supplied from other sources such as rainwater.
2.1.3 Solid Waste Production
In 2004, commercial buildings generated about 14.26 Mt of solid waste. Approximately 78% of that is disposed of, and 22% was diverted or recycled. Paper products and organic material make up about two thirds of the solid waste stream. The types of technologies used to minimize waste disposal are quite different for the different components of solid waste. The thermo-chemical processes often used to treat metal wastes are quite different from biological processes used to treat organic wastes.
2.2 Commercial Buildings Vision Statements
The following industry vision statements have been derived from industry stakeholder input as well as key government and industry reports and articles.
2.2.1 Energy
By 2030 commercial buildings in Canada will consume 0.98 GJ/m2 of energy, creating 0.0587 t
CO2e/m2 of GHG emissions, a 50% reduction in energy
intensity from the current level of 1.97GJ/m2, resulting in an overall reduction of 1,093 PJ of energy and 74 Mt
CO2e of GHG emissions per year from
projected Business As Usual trend levels.
2.2.2 Water
By 2030, commercial buildings in Canada will consume 712 L/m2 of municipal water, a 65% reduction from the 2007 level of 2,033 L/m2, resulting in an
overall reduction of 1,409 BL of water per year from projected levels.
2.2.3 Solid Waste
By 2030, commercial buildings in Canada will produce 1.71 kg/m2 of solid waste, an 85% reduction from the 2007 level of 11.4 kg/m2, resulting in an
overall reduction of 14.8 Mt of solid waste per year from projected levels.
In order to achieve the visions a number of technology as well as non-technology needs must be satisfied. The vision statements revolve around the overall need for a comprehensive and integrated process of building design, construction and operation.
2.3 Non-Technical Needs
Price on Carbon – Industry stakeholders agree that the single-largest driver of sustainable buildings could be a realistic and consistent price on fossil fuel based carbon. Since the operation of buildings is very carbon-dependent, establishing a price on carbon could drive the development and use of materials and processes that have low embodied energy and operating systems which minimize consumption of fossil fuel based energy.
Integrated Supply Chain – Developing high-performance commercial buildings requires close collaboration among building owners, financiers, architects, engineers, contractors, suppliers, managers and operators, municipalities, and utilities. There needs to be greater agreement on the system requirements as well as the economic, resource, productivity, and recyclability performance of buildings.
Integrated Building Practices– There is a need for integrated practices in regional planning, project financing and compensation, construction and building operation. This includes an holistic approach to regional planning, integrated design and construction practices, improved financial procedures and more effective methods of compensation.
Improved Building Code & Greater Enforcement – The lack of standard protocols for interoperability, inconsistent and sometimes inadequate enforcement of performance standards and outmoded or restrictive building codes, all contribute to the inefficient design and operation of commercial buildings. Industry stakeholders agree that a more advanced building code, such as the Model National Energy Code for Buildings, is urgently needed. It must be supported by stronger enforcement measures that are updated on a regular basis. A new Sustainability Code should also be developed to encompass the complete eco-efficiency concept.
Continuous Reporting– There is a need for measurable, defensible, and reproducible financial assessments, based on realistic building performance data. Anecdotal evidence, while valuable, is not sufficient to spark widespread adoption of the sustainable buildings approach, particularly given the large investments and risks involved in most commercial buildings.
Information Exchange– Building designers need to learn from the experiences from the installation and long-term operation of high performance buildings. There is little formal information exchange between key building players. A centralized information exchange, similar to the ones in the United States and Europe, could be developed in Canada.
Sustainability Ethic in Education– A number of new and innovative sustainability programs are beginning to emerge in Canada’s post-secondary education institutions. While they are essential to creating a new sustainability ethic in Canada, they have been criticized by some as being too narrow in scope. They argue that sustainability is treated as a distinct area of study, and is not integrated throughout the course curriculum.
2.4 Technical Needs
The technology-based needs are condensed into five groups. Each group consists of a number of measures, or technology areas, that help satisfy the needs of the group. The groups are interrelated and a change in one area will often cause a change in another area.
Integrated Building Design – This refers to the process of designing and siting sustainable buildings while optimizing resource use, building functionality, and occupant comfort. The measures are built around the central theme of the integrated design process.
Building Envelope Improvements – There is a need to implement best available and best emerging technologies as well as a need for “next generation” building envelope technologies to minimize thermal transfer and maximize the use of available natural resources. The technologies in this group include improved building fabric, foundation, glazing, doors and openings, and insulating materials.
Operator & Occupant Management Tools – There is a need for technologies that help building operators and occupants be aware of, and respond to, individual resource consumption, while maintaining or improving indoor environmental quality. This group is unique in that the improvements are contingent upon human behaviour while the building is being utilized. Technologies play a supportive role by providing the feedback and control to modify and improve behaviours.
System & Equipment Efficiency Improvements – This involves the application of high efficiency mechanical and electrical equipment used throughout the building.
Optimized Resource Supply – This involves optimizing the supply of conventional resources, maximizing the use of available natural resources, and the reuse of existing building resources.
• Conventional Resource Supply – This refers to the supply of conventional, but more efficient, sources of energy and water. It includes district energy, on-site energy production, and more efficient supply of treated water.
• On-Site Renewable Resource Supply – This focuses on the technologies that can generate electricity and/or thermal energy and supply water from natural resources available on the building site, such as integrated solar PV systems, roof-top wind turbines, and rainwater collection and treatment systems.
• On-Site Resource Recovery and Renewal – This includes the technologies that offset the requirement for new resource supplies by renewing and reusing a portion of the resources already consumed in the building. The renewed resources would be used in a secondary application following their initial primary use. Examples include greywater re-treatment, off-grid sanitary sewage systems (e.g. on-site composting), and on-site solid waste recycling (e.g. on-site thermo-chemical or biological processing plants that convert solid waste into useful products).
2.5 Investment Priorities
The analysis identified 10 high priority and 9 medium priority investment opportunities for the near term. Investments could be placed now and be expected to yield tangible results in the next few years. Over the longer term, the analysis identified 2 high priority and 5 medium priority investment opportunities. These would require placements now in order to achieve results over the longer term.
By placing strategic investments in the high potential opportunities identified in this report, SDTC can accelerate the implementation of emerging technologies into the Canadian market.
3
Report
Scope and Approach
3.1 Report Scope
This SD Business CaseTM report focuses on impacts of resource utilization in the operation of commercial/institutional buildings in Canada2. It examines
building characteristics (location, size and operations) and identifies the direct and enabling technologies that can help create more sustainable buildings in both the existing and future building stock.
3.1.1 Commercial Building Classification
It covers all types of commercial and institutional buildings, and follows the NRCan approach to classifying buildings.
• Wholesale and Warehousing
• Retail Trade
• Information and Cultural Industries
• Offices
• Educational Services
• Health Care and Social Assistance
• Accommodation and Food Services
• Other Services
Together, they are simply referred to as “commercial” in this report. There are two notable sub-sector exclusions:
Multi-unit residential buildings (MURBs) are not included in this report. However, many conclusions and technology priorities can be applied to MURBs. The main differences are the hours of operation (residential peak load typically occurs after the commercial peak load) and equipment type and use (e.g. bathing, heating and air conditioning, dishwashers, clothes washers and driers, etc.). These factors influence the utility rate structures applied to MURBs. Individual residential units are typically, but not always, billed at the residential rate, but the core building, which includes exterior lighting and heating and ventilation of corridors and common areas, is billed at the commercial rate. If MURBs were included in the commercial sector, they would represent an energy consumption of about 180 PJ/yr, or 13% of the total consumption.
Industrial buildings are also excluded from the analysis because the functionality and operating characteristics are distinctly different from other commercial buildings. For example, a building used in the steel-making industry has different operating characteristics than a high-rise office building: one is driven by industrial process requirements and the other is driven by human comfort requirements. The type, size and durability of the mechanical and electrical systems are also very different. Therefore, the building structures used in industrial operations would be treated as a sub-set of
Industrial Utilization, which will be a separate SDTC Business CaseTM report.
Although the NRCan, Office of Energy Efficiency approach is used in this report, it must be noted that there is no standard commercial building classification system in Canada. Utilities, regulators, building designers and engineers use various classification systems. There does not appear to be a building condition classification system. Data regarding building age and equipment type is available, but there is nothing to link this to building performance or building sustainability.
3.1.2 Operational Focus
Resources are consumed, and waste is produced, throughout the entire lifecycle of a building. However, the vast majority of the resources are consumed during the operational life of the building. The following figure shows the relative amounts of energy used throughout the entire lifecycle: the largest
Figure 5 : Commercial Building Lifecycle Energy Consumption
6.2%
8.3%
85.5%
Initial Embodied Energy (Acquisition of materials and construction) Recurring Embodied Energy (Maintenance and refurbishment)
Operating Energy (Regular building operation) Source: http://www.canadianarchitect.com/asf/perspectives_sustainibility/measures_of_sustainablity/measures_of_sustainablity_embodied.htm Derived from Life-Cycle Energy Use in Office Buildings Building and Environment by Cole, R.J. and Kernan, P.C. (1996), Published in, Vol. 31, No. 4, pp. 307-317.
This focus does not diminish the importance of construction and demolition, but it can provide a useful starting point for commercial building resource utilization analysis.
As a matter of standard practice, SDTC considers the full lifecycle impacts of all the technologies under consideration, in all sectors. The complexity and availability of this information for a given technology or sector will often dictate how much is contained in the SD Business CaseTM report. Future
iterations of the Commercial Building Eco-Efficiency STARTM process may delve further into the entire building lifecycle.
3.1.3 Technology Applications
The technologies outlined in this report generally apply to all commercial buildings, but may be used in different ways or with differing degrees of complexity. For example, advanced control systems may be required for all types of buildings. But the cost, complexity and degree of sophistication can vary considerably (i.e. small office buildings don’t require the same level of sophistication as large health care institutions). It is assumed in this report that all of the stated technology areas can be applied to all types of commercial buildings, but in varying ways.
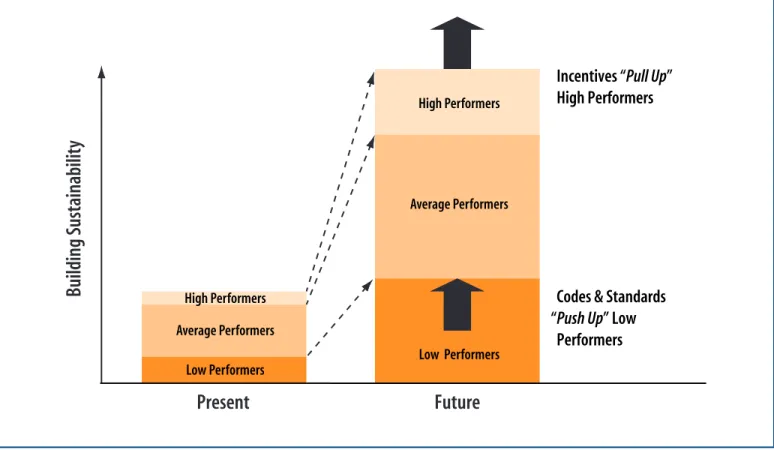
3.1.4 Strategic Approach
In order to achieve true sustainability in the Canadian commercial buildings sector, it is acknowledged that a comprehensive strategy is required. Figure 6 illustrates how this could possibly work.
The market consists of low performers (those that barely meet minimum code requirements), average performers (those that can exceed minimum standards and employ some high performance technologies), and high performers (those that embrace the sustainability ethic and extensively employ high performance technologies). The strategy involves expanding and improving standards to “push up” the low performers, and market or government incentives to “pull up” the high performers. The effect will be to move the large centre (average performers) upwards.
Figure 6 : Sustainable Buildings Strategy
Present
Future
Average Performers Low Performers High Performers Low Performers Average Performers High PerformersBuilding Sustainability
Incentives “Pull Up” High PerformersCodes & Standards “Push Up” Low
Performers
3.1.5 Data Sources
A number of reports, studies, and data sources were used in the STARTM analysis and the creation of this report. The primary analysis data was drawn from three main sources from the Office of Energy Efficiency at NRCan:
• Comprehensive Energy Use Database: Commercial/Institutional Sector (NRCan website database).
• Commercial & Institutional Consumption of Energy Survey 2004, December 2005.
• Energy Efficiency Trends in Canada 1990-2004, August 2006.
These reports provide a detailed picture of energy consumption and GHG emissions production in the commercial sector in Canada. However, there are notable discrepancies between the web-based data, earlier versions of the energy use surveys, and the latest energy survey reports. Specifically, there are substantial differences regarding occupied floor area, energy intensity, and total number of buildings. The discrepancies are largely due to the way in which the raw data is supplied. In some reports, energy data is applied to the commercial sector: that is, broad macro-economic data is first applied to the major sectors (e.g. Industry and transportation) and the remaining, or residual, data is apportioned to the smaller sectors (such as commercial buildings). This top-down approach can result in significant differences between the residual data and the actual performance data from the sector. There are many end use or technology based analyses applicable to commercial buildings but the lack of broad based or national inventory of the important characteristics of buildings prevents calculation of the impacts of implementation of innovations. The lack of consistent, comprehensive and reliable information highlights the need for more performance-based data within the sector. Policy makers need it for developing better regulations and incentives, power authorities need it for energy and demand management initiatives and owners need it for better branding/eco-labeling. Enabling technologies, such as intelligent building systems and real-time reporting, could help fill this gap.
4
Background
4.1 Commercial Building Stock
4.1.1 Building Type
In 2004, there were about 591 million m2 of commercial floor space in Canada3, up from 466 million m2 recorded in 1990. Growth has been almost
linear. An extrapolation of the data suggests that there are currently about 395,000 buildings (up from approximately 380,000 in 2004)4, covering
613 million m2 of floor area5.
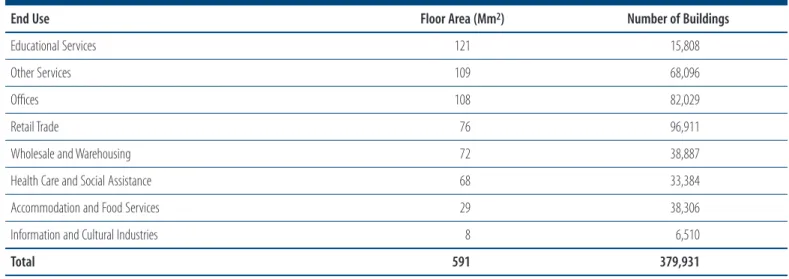
Table 3 shows the total floor area and number of buildings in each of the eight building sub-sectors identified by NRCan.
Table 3 : Building Type by End Use in 2004
End Use Floor Area (Mm2) Number of Buildings
Educational Services 121 15,808
Other Services 109 68,096
Offices 108 82,029
Retail Trade 76 96,911
Wholesale and Warehousing 72 38,887
Health Care and Social Assistance 68 33,384
Accommodation and Food Services 29 38,306
Information and Cultural Industries 8 6,510
Total 591 379,931
Note: Educational Services, the largest sub-sector by floor area (121 Mm2), has relatively few buildings (15,808).
Source: Commercial and Institutional Consumption of Energy Survey: 2004. Natural Resources of Canada. Office of Energy Efficiency. December, 2005.
4.1.2 Building Age
Only 34% of commercial buildings were built since the first two energy crises in the 1970s which prompted the development and use of improved building technologies. 17% were built between 1990 and 2000.
Figure 7 : Commercial Buildings by Age
6% 19% 14% 27% 17% 17% Before 1920 1920-1959 1960-1969 1970-1979 1980-1989 1990-1999
This shows that the greatest proportion of commercial buildings were constructed using techniques and technologies that were below present common practice and did not use any of the improved materials, techniques, equipment and systems developed and made available in the recent past. The age of the existing building stock has an impact on the types of technologies that could be moved forward in the near term.
4.1.3 Building Activity
New buildings are coming on line at the rate of about 1%/yr., although floor area is growing at about 2.7%/yr. Old building stock is retrofitted at the rate of about 2.2%/yr6, representing about a $20 billion/yr retrofit industry in Canada. At the current retrofit rate, approximately 50% of the existing building
stock could be upgraded by the year 2030. This is a substantial market opportunity for potential investors, and could provide the financial momentum required for Canada to move towards more sustainable buildings.
4.2 Resource Utilization
4.2.1 Energy End-Use
Energy is used to heat and cool buildings and run auxiliary systems. In 2004, the commercial building sector accounted for 13.7%, or 1,171 petajoules (PJ)7 of total secondary8 energy end-use in Canada.
Figure 8 : Total End-Use Energy by Sector in 2004
17% 14% 38% 29% 2% Residential Commercial Industrial Transportation Agriculture Source: Energy Efficiency Trends in Canada, 1990 to 2004. Natural Resources Canada. Office of Energy Efficiency. August, 2006.
Figure 9 : Commercial End-Use Energy by Source in 2004
41% 44% 8% 4% 3% Electricity Natural Gas Light Fuel Oil Heavy Fuel Oil Steam (0%) Other
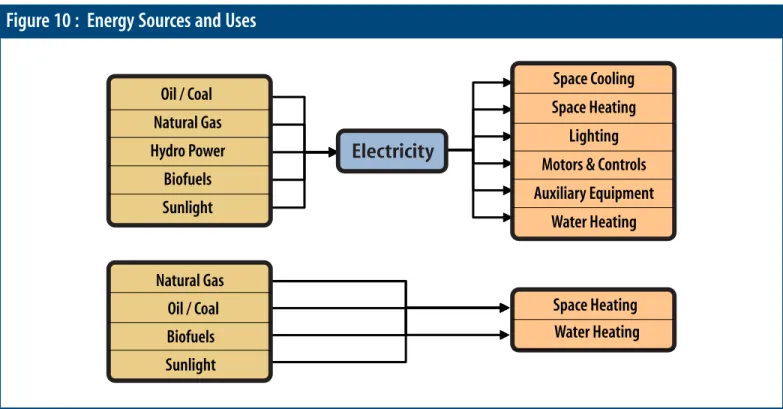
In 2004, electricity and natural gas together made up about 85% of all the energy consumed in commercial buildings. The following figure illustrates the relationship between where the energy comes from, and how it is typically used.
Figure 10 : Energy Sources and Uses
Oil / Coal Natural Gas
Biofuels Sunlight
Hydro Power
Electricity
Natural Gas Oil / Coal Biofuels Sunlight
Space Cooling
Motors & Controls Lighting Space Heating Auxiliary Equipment Water Heating Space Heating Water Heating
This relationship plays a key role in developing energy reduction strategies and assessing the impacts on natural resources. For example, reducing electricity consumption can reduce the amount of coal required to generate electricity initially, and can reduce airborne emissions. The amount of reduction depends on the fuel quality (e.g. type and grade of coal) and the fuel mix (e.g. natural gas and coal) at any point during electricity generation. Electricity production for the grid is not part of this report.
4.2.2 Energy Use by System Type
There are six types of energy-consuming systems used in buildings. The largest of these is space heating, which accounts for more than one half (52%) of energy use in this sector. The second-largest load is auxiliary equipment9 at about 14%. Together, space heating, auxiliary equipment and lighting make
up over 75% of all the energy consumed in commercial buildings.
Table 4 : Commercial Energy End-Use by System Type in 2004
System Brief Description Energy Use (PJ) Energy Use (%)
Space Heating Includes thermal combustion and electric heating systems (e.g. boilers), make-up air heaters (e.g. pre-heating incoming air), and heat distribution. 614 52 Auxiliary Equipment Personal and portable electronic devices, task lighting, security systems etc. 165 14 Lighting Lighting of common spaces and individual work spaces as well as exterior, security and public spaces. 115 10
Water Heating Primarily domestic hot water for cleaning, cooking and bathing. 103 9
Motors & Controls Pump and fan motors, as well as elevator and escalator motors. 97 8
Space Cooling Primarily electrically-driven refrigerant compressors (e.g. chillers). 69 6
Other This is an adjustment factor to account for the discrepancy in the data sources. 8 1
All figures represent end-use operations consumption and are exclusive of “embodied energy”.
4.2.3 Energy Use Trends
Between 1990 and 2004, (14 years), total energy consumption in commercial buildings in Canada rose from 867 PJ to 1,171 PJ: an increase of 35%, or about 2.5% per year.
Figure 11 : Commercial Energy Use for 1990-2004
Year
800 850 900 950 1,000 1,050 1,100 1,150 1,200 1990 1991 1992 1993 1994 1995 1996 1997 1998 1999 2000 2001 2002 2003 2004Commercial Energy Use (PJ)
Source: 2004 Commercial and Institutional Consumption of Energy Survey. Natural Resources Canada. Published December, 2005. http://oee.nrcan.gc.ca/Publications/statistics/cices05/pdf/cices05.pdf
NRCan has identified five possible causes for the increase.
• Activity Effect – Caused by the change in occupied floor area, and activity levels.
• Service Level Effect – The change in auxiliary equipment load resulting from a change in activity and the change in auxiliary equipment density (the number of auxiliary devices per user).
• Weather Effect – Fluctuations in weather patterns which influence heating and cooling loads.
• Structure Effect – Changes in the makeup of the sector. For example, a decrease in the Health Care sub-sector may result in an increase in the
Offices sub-sector, as services functions are done in offices rather than health facilities.
• Energy Conservation Effect – The impact of energy conservation and increased energy efficiency efforts.
Of the 304.2 PJ total increase in energy consumption during the 1990-2004 period, approximately 218.6 PJ (72%) was due to an increase in the Activity Effect, followed by Service Level Effect (75.5 PJ).
Figure 12 : Impacts on Commercial Energy Use for 1990-2004
218.6 75.5 11.0 3.3 -3.0 -1.0 -50 0 50 100 150 200 250 ActivityEffect Service Level Effect Weather Effect Structural Effect Energy EfficiencyEffect Other
Energy U
se (PJ)
Source: Energy Efficiency Trends in Canada, 1990 to 2004. Natural Resources Canada. Office of Energy Efficiency. August, 2006.
Activity Effect
Between 1990 and 2004, total floor space of commercial buildings increased 27% from 466 million m2 to about 590 million m2, resulting in a 218.6 PJ
increase in energy use. However, the energy use rose at a greater rate than the increase in floor area.
Figure 13 : Commercial Energy Use and Floor Area for 1990-2004
0 100 200 300 400 500 600 700 0 100 200 300 400 500 600 700 800 900 1,000
Total Floor Area (Mm2)
Energy Utilization (PJ)
Year
By accounting for the effects of increased floor area, the energy use intensity is shown. The energy use intensity rose from 1.47 GJ/m2 to 1.60 GJ/m2
between 1990 and 2004, despite more efficient building components and energy conservation efforts.
Figure 14 : Commercial Energy Use Intensity for 1990-2004
Commercial Energy Use Intensity (GJ/m
2
)
Year
1990 1991 1992 1993 1994 1995 1996 1997 1998 1999 2000 2001 2002 2003 2004 1.30 1.35 1.40 1.45 1.50 1.55 1.60 1.65Note: Energy intensity is the total energy consumed (GJ) per square meter of floor space.
Service Level Effect (Auxiliary Equipment)
This includes personal computers, servers, printers, faxes, copiers, personal communication devices, coffee makers, small refrigerators and portable task lighting. The energy load effect is two-fold; there is an increase in electrical demand to run the devices and, since most of the devices give off heat, there is an increase in cooling load and decrease in the heating load. Between1990 and 2004, the auxiliary equipment load rose by about 105%, and in 1999 surpassed lighting as the second-largest load in commercial buildings.
The Service Level Effect is closely associated with occupant behaviour. It includes the influences of system operators and managers who are responsible for maintaining and controlling the equipment, and building tenants, who create the demands on the conditioned space.
Weather Effect
With commercial buildings there is a direct link between outside air temperature and energy consumption. As the outside air temperature drops below a desired setpoint, there is a proportional increase in the demand for space heating. This results in an increase in fuel consumption for heating and electricity consumption required to drive the ancillary HVAC equipment. As the outside air temperature rises above the desired setpoint, there is an increased demand for space cooling. Most air conditioning systems are electrically driven, so the building typically experiences a proportional rise in electricity use.
The indicator of weather-related heating demand in buildings is the Heating Degree Day Index (HDDI). It is an indication of the outdoor air temperature variation, relative to an established benchmark. A plot of the HDDI in Canada shows a gradual decline between 1990 and 2004, which suggests there should be a proportional decline in heating load requirements.
Figure 15 : Heating Degree Day Index (HDDI), 1990-2004
Year
1990 1991 1992 1993 1994 1995 1996 1997 1998 1999 2000 2001 2002 2003 2004 0.80 0.85 0.90 0.95 1.00 1.05Year
1990 1991 1992 1993 1994 1995 1996 1997 1998 1999 2000 2001 2002 2003 2004 0.80 0.85 0.90 0.95 1.00 1.05Note: A measure of how relatively cold (or hot) a year was when compared with the heating degree day (HDD) average. When the HDD index is above (below) 1, the observed temperature is colder (warmer) than normal. The HDD normal represents a weighted average of the 1951-1980 HDDs observed in a number of weather stations across Canada. Its value, which varies from year to year because of the flow of population, was 4476 HDDs in 2004.
However, the heating intensity (GJ/m2) actually rose during that period.
Figure 16 : HDDI and Space Heating Load Intensity for 1990-2004
Year
1990 1991 1992 1993 1994 1995 1996 1997 1998 1999 2000 2001 2002 2003 2004 0.0 0.2 0.4 0.6 0.8 1.0 1.2Heating Degree Day Index
Space Heating Load Intensity (GJ/m2) Source: http://www.oee.nrcan.gc.ca/corporate/statistics/neud/dpa/tablestrends2/com_ca_1_e_1.cfm?attr=0
The HDDI and heating load intensity track fairly closely between 1990 and 2000, but there is a departure after the year 2000. The space heating load becomes significantly higher than the weather-related HDDI. The reasons for this could include :
Lighting Improvements – Old incandescent or fluorescent tube lighting gives off a substantial amount of heat and can act as a secondary source of space heating. The heat input from lighting would have been part of the original HVAC calculations for the building. Through recent energy conservation efforts, many of the older lighting fixtures have been replaced with higher efficiency ones. However, the new fluorescent lighting uses less power and operates at a much lower temperature. This means that the building’s heating system must make up the difference, so there is a proportional increase in heating demand.
may call for heat. A valve opens to supply steam or hot water to the heating coil, which in turn provides heat to the occupied space. As the day progresses it may get warmer and the thermostat calls for the heating system to draw down or shut off. However, if the valve doesn’t close for some reason, heat will continue to be supplied to the space. The thermostat will sense the heat gain and activate the cooling system, resulting in an additional call for heat. This self-perpetuating process results in excessive energy consumption, poor space conditions, and high utility bills. It is a common problem that is often the result of bad design, low quality equipment, poor maintenance, or operator neglect.
Occupancy Changes – Human activity is also a source of heat within buildings. High occupancy densities and/or high activity levels could serve as a source of additional heat in a building which reduces heating demand. It can also result in a simultaneous increase in cooling demand. Although accurate commercial occupancy density data is not available, it is possible that changes in occupancy densities could account for some of the change in heating load.
Structure Effect (Sectoral Changes)
As the Canadian economy continues to grow and change, there is an ongoing change in how buildings are used. Extensive building retrofits are often the result of a change in market requirements and owner preferences. This could impact total energy use and energy use intensity. However, there is very little applicable data to clearly map the structural effect in the commercial sector, and the effect is considered minimal.
Energy Conservation Effect
While weather and occupant behaviour can drive up energy consumption, there is an ongoing effort to decrease it through energy conservation. Overall energy efficiency in the commercial sector declined by about 0.4% between 1990 and 2004, resulting in a decrease of 3 PJ of energy.
The reduction is attributed by some analysts to government and utility energy conservation programs and incentives. Many of the programs are prescriptive in nature, and are commonly equipment-focused. They are designed to meet specific corporate or government objectives, and are relatively easy to track and administer. However, they sometimes lack the comprehensiveness required to make deep and sustained energy reductions. If the incentives are removed, as has happened periodically, the market receives a negative signal and often reverts back to less expensive and less efficient equipment and practices.
Figure 17 : Commercial Energy Use, With and Without Energy Efficiency Improvements, 1990-2004
Year
1990 1991 1992 1993 1994 1995 1996 1997 1998 1999 2000 2001 2002 2003 2004 1.00 1.05 1.10 1.15 1.20 1.25 1.30 1.35 1.40Energy Use Index Without
Energy Efficiency Improvements Energy Use Index WithEnergy Efficiency Improvements Source: http://www.oee.nrcan.gc.ca/Publications/statistics/parliament05-06/appendix-a.cfm?graph=19&attr=0
The data shows that the impact of energy conservation efforts in the commercial sector has been quite small (3 PJ) relative to the 14-year overall increase of 304 PJ.
4.3 Energy-Related Emissions
In 2004, the commercial sector produced 13.4%, or 67.9 megatonnes (MtCO2e) of energy-related greenhouse gas (GHG) emissions. These emissions are
produced in a number of ways during the operating life of a building.
Indirectly – Electricity used to run the mechanical and electrical systems is typically generated from centralized utility facilities which may burn fossil fuels. The production of GHGs and criteria air contaminants (CACs) vary with electricity demand and the mix of fossil fuels used to generate the electricity.
Directly – The on-site combustion of fossil fuel for boilers and space heaters produce local emissions.
Material Waste – The organic component of waste material produces GHG emissions as the material decomposes, and typically occurs off-site at landfills.
Figure 18 : GHG Emissions by Sector in 2004
15% 13% 34% 35% 3% Residential Commercial Industrial Transportation Agriculture
Source: Improving Energy Performance in Canada – Report to Parliament Under the Energy Efficiency Act For the Fiscal Year 2005-2006. NRCan Office of Energy Efficiency. Accessed May 29, 2007. http://www.oee.nrcan.gc.ca/Publications/statistics/parliament05-06/chapter4.cfm?attr=0
Note: While both GHGs and CACs are important indicators of environmental performance of buildings, GHGs are used as the primary indicator in this version of the SD Business CaseTM. It is assumed throughout that GHG emissions are a relatively accurate proxy for CAC production, as the two
are closely linked. The combustion of natural gas, coal and oil all produce GHG emissions, but both coal and oil emit considerably more CACs than natural gas for the same energy service.
GHG emissions from the sector rose from about 47.88 MtCO2e in 1990 to 67.9 MtCO2e by 2004: an increase of 42%.
Figure 19 : Commercial Energy-Related GHG Emissions, 1990-2004
Year
Mt
CO2e 1990 1991 1992 1993 1994 1995 1996 1997 1998 1999 2000 2001 2002 2003 2004 40 50 60 70Note: The shape of the end-use curve is si