Vol. 8, No. 2, June 2020, pp.1165-1176
Comparison of Machine Learning Algorithms for EMG Signal Classification
Chingiz Seyidbayli1, Fedi Salhi2, Erhan AKDOGAN31,2,3 Mechatronics Engineering, Yildiz Technical University
ABSTRACT
The use of muscle activation signals in the control loop in biomechatronics systems is extremely important for effective and stable control. One of the methods used for this purpose is motion classification using electromyography (EMG) signals that reflect muscle activation. Classifying these signals with variable amplitude and frequency is a difficult process. On the other hand, EMG signal characteristics change over time depending on the person, task and duration. Various artificial intelligence-based methods are used for movement classification. One of these methods is machine learning. In this study, a total of 24 different models of 6 main machine learning algorithms were used for motion classification. With these models, 7 different wrist and static hand gestures (rest, grip, flexion, extension, radial deviation, ulnar deviation, expanded palm) are classified. Test studies were carried out with 8 channels of EMG data taken from four subjects. Classification performances were compared in terms of classification accuracy and training time parameters. According to the simulation results, the Ensemble algorithm Bagged Trees model has been shown to have the highest classification performance with an average classification accuracy of 98.55%.
Keywords: Artificial Intelligence, Machine Learning, Classification, Electromyography, Ensemble Models
Corresponding Author:
Erhan AKDOGAN
Mechatronics Engineering Yildiz Technical University
Yildiz Technical University, Mechatronics Eng. Department, Istanbul, Turkey, 34349 E-mail: [email protected]
1. Introduction
The surface electromyogram (EMG) contains the sum of the electrical contributions of active motor units detected by electrodes placed on the skin above the muscle [1]. Electromyography (EMG) signals are a type of bioelectric signals. They can be used for biomedical, robotics, human-computer and human-machine applications. The classification of these signals is an important issue in biomechatronics applications. The biomechatronics discipline focuses on rehabilitation robots, prosthesis, orthosis, exoskeletal robot manipulator and intelligent rehabilitation devices [2-4]. In particular, EMG signals are frequently used in the diagnosis and treatment of muscle and nerve diseases in the medical field [5-7].
In recent studies, statistical methods,Bayesian techniques, artificial neural networks, fuzzy approaches, neuro-fuzzy systems and support vector machines have been used to classify EMG signals. Pfeiffer and Kunze, used Principle Component Analysis and multivariate discriminant algorithm for motor unit potentials [8]. Xiang et al., used Bayesian networks to diagnose upper limb problems. Using EMG signals, they classified 76 patients by disease condition and achieved a high clinical performance [9]. Abel et al., tested three different artificial neural network models for EMG signal classification. They used an improved backpropagation network (IBPN), a radial basis network (RBN), and a learning vector quantization network (LVQ). The test studies were done with healthy individuals and patients that have myopathic and neuropathic disorders [10]. Pandey and Mishra developed a novel integrated intelligent model for hierarchically correlate the sign and symptoms of the disease and computing cumulative confidence factor of the diseases. For this aim, it was combined with rule-based
reasoning, case-based reasoning, and artificial neural network structures. The test studies were performed with diseases of Duchenne muscular dystrophy, polymyostits, endocrine myopathy, metabolic myopathy, neuropathy, poliomyelitis, and myasthenia gravis [11]. Subasi et al. classified EMG signals using feed-forward error backpropagation artificial neural networks (FEBANN) and wavelet neural networks (WNN). 24 volunteers were subjected to this study, 13 of which have a neurological disease, 7 of which have myopathy and the others were healthy. 1200 MUP (motor unit potential) were analyzed for different volunteers. It was achieved 90.7% and 88% classification accuracy using WNN and FEBANN, respectively [12]. Luo et.al, developed a fuzzy logic algorithm to classify upper limb motions. They used flexor and extensor muscles’ EMG signals [13]. Kocer developed a neuro-fuzzy system for the analysis and classification of EMG signals from healthy, neuropathy and myopathy subjects. The number of subjects was 177. The coefficients are determined by using autoregressive analysis. These coefficients were applied to the neuro-fuzzy system [14]. Khezri et al., developed an Adaptive Neuro-Fuzzy Inference System (ANFIS) with a 96% accuracy rate to determine motion commands for prosthetic hand controlling [15]. In a study carried out by M. F. Lucas et al., a method based on the discrete wavelet transform of EMG signals for supervised movement classification using SVM (Support Vector Machine) and myoelectric prostheses controlling was suggested. Within this study, 6 different hand movements were classified using 8-channel EMG signals. In addition, autoregressive models also have been used for EMG signals classification [16]. Y. Lu et al. utilized statistical models to classify EMG signals [17]. They investigated the performance of EM (expectation-maximization), AR (Autoregression), ARMA (Autoregressive–Moving Average), and ARIMA (AutoRegressive Integrated Moving Average) with different classification models. They achieved 93% classification accuracy using backpropagation (BP) and support vector machine (SVM) algorithms. Omama et al., used statistical properties of EMG signals in order to feed artificial neural network-based muscular movements classifier e.g. MSE (mean square error), mean, variance, and mean absolute value [18]
The contribution of this study to the literature is that it is the first study that examines the most suitable machine learning algorithms for EMG-based classification of wrist and static hand gestures and reveals the results on this large scale. In this context, motion classification was carried out with 24 models of six different machine learning algorithms using 8-channel EMG signals for different wrist and static hand gestures (rest, grip, flexion, extension, radial deviation, ulnar deviation, extended palm) acquired from four subjects. These methods are Decision Trees, Discriminant Analysis, Naive Bayes, SVM (Support Vector Machines), KNN (k-Nearest Neighbor) and Community Classification. Performance evaluation of these methods and comparison between them was made using classification accuracy and training period. According to the simulation results, the Ensemble algorithm Bagged Trees model has been shown to have the highest classification performance with an average classification accuracy of 98.55%.
2. Material and Method 2.1. EMG signal analysis
The main purpose of the electromyography technique is to examine the muscle function based on the processing and analysis of the electrical signals produced by the muscles. The EMG signal may be affected by external disturbances. These effects are anatomical and physiological features of muscles, control structure of peripheral nervous system, environmental electrical devices and magnetic fields. These effects need to be suppressed. Various filtering techniques are used for this. Otherwise, the character of the EMG signals may change. This will directly affect the analysis. Elimination of noises is an extremely critical process for accurate movement classification.
The action potential of the motor unit is obtained by the spatial and temporal sum of the individual muscle action potentials for all the fibers of a single motor unit. Therefore, the EMG signal is the algebraic sum of the motor unit action potentials. These potentials are limited by the surface covered by the electrode used. There is a direct relationship between EMG and many biomechanical parameters. For example, in isometric contractions, there is a direct relationship between the increase in tension in the muscle and the amplitude of the EMG signal. It should not be forgotten that the place where the movement begins is the brain. The movement command
transmitted to the nerve cells reaches the muscles. The muscles contract and activate the skeletal system. Therefore, accurate analysis of EMG signals brings correct detection or estimation of biomechanical parameters. EMG signal can be obtained in two ways: non-invasively measuring surface electrodes from the skin surface and, measurement under the skin by reaching the muscle with needle electrodes. These electrodes are shown in Figure 1. The amplitude of typical EMG signals is between 400 mV and 3 mV. Therefore, the signals are first amplified, then processed and recorded. In biomechatronics applications, EMG signals are raised, rectified, and filtered for actuator control. In some techniques, normalization is also performed before classification [4,19]. There are several techniques that can be used in EMG Signal Analysis: Moving Average (user-selected window), Linear Envelope (user selectable filter frequency), RMS Analysis, Integrate over Time, EMG Power Spectrum (FFT), Amplitude Distribution (FFT) [20]. However, in this study raw data have been used to assess the ability of each algorithm to extract features from unfiltered data. This is extremely meaningful due to the fact that it does not require extra software and hardware elements and is one of the remarkable aspects of this study.
Figure 1. Different Type of Electrodes 2.2. Motion classification using EMG
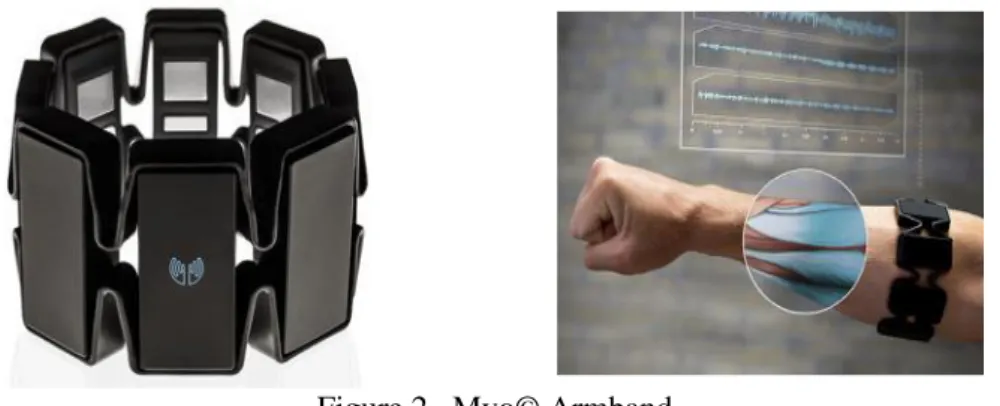
In this study, an EMG dataset that can be accessed from the University of Irvine Center for Machine Learning and Intelligent Systems’ web-page has been used [21]. The dataset consists of EMG measurements of 36 users while performing resting, grasping, flexion, extension, radial deviation, ulnar deviation, and extended palm movements acquired using Myo© Armband [22] with the sampling frequency of 1 kHz. In this study, four subjects’ data were used. The total number of instances related to these four subjects is 486388 data points. Myo is a device that measures electrical activity from muscles using EMG sensors to detect five movements made by the upper limbs. It has a 9-axis IMU (Inertial Measurement Unit) sensors. Thus, it can perceive the movement, direction and rotation of the arm. The Myo can transmit the data it collects to communicate with various peripheral units via Bluetooth connection. The Myo also provides raw EMG data and IMU data, which is extremely useful for researchers. The Myo armband is given in Figure 2.
The EMG measurements were labeled according to the movement which the data relate to. Data related to unknown movements were labeled with “0”. The data were classified using 24 different machine learning models under 6 main algorithms. These models are given as follows and shown in Table 1.
2.2.1. Decision tree models
Tree-based learning models are among the most used supervised learning algorithms. In general, they can be adapted to the nature of the problem (classification, regression, or clustering). In addition, decision trees algorithms are widely used in classification problems thanks to their easy configuration and comprehensibility compared to other classification algorithms [23]. Classification using decision trees is carried out in 2 stages. In the first step, the tree is created. Then in the second step, the classification is realized by consecutively feeding the data to the tree. Generally, the classification process is mathematically defined as follows: Let 𝐷 = {𝑡1, 𝑡2… 𝑡𝑛} be a database in which each record is represented by 𝑡𝑖 and 𝐶 = {𝐶1, 𝐶2, … 𝐶𝑚} represents a set of
m classes in which each 𝐶𝑗 is a separate class containing its own records and mathematically defined by 𝐶𝑗=
{𝑡𝑖 | = 𝐶𝑗 , 1 ≤ 𝑖 ≤ 𝑛 𝑣𝑒 𝑡𝑖 ∈ 𝐷}.The fields for each record in the database are described by {𝐴1, 𝐴2, … 𝐴𝑛}. If
Figure 2. Myo© Armband
Table 1. Machine learning methods used in the study Decision Trees Discriminant Naïve Bayes SVM KNN Ensemble Fine Tree Linear Discriminant Gaussian Naïve Bayes Linear SVM Fine KNN Boosted Trees Medium Tree Quadratic Discriminant Kernel Naïve Bayes Quadratic SVM Medium KNN Bagged Trees Coarse Tree Cubic SVM Coarse KNN Subspace KNN Fine Gaussian SVM Cosine KNN Subspace Discriminant Medium Gaussian SVM Cubic KNN RUSBoosted Trees Coarse Gaussian SVM Weighted KNN
Each node is named with the area 𝐴𝑖, nodes between the root node and the leaf are a classification rule and each
leaf in the tree represents a separate class [24]. The algorithm used in creating a decision tree is important because the shape of the tree may change according to the algorithm used and different tree structures can give different classification results.
2.2.2. Discriminant model
Discriminant Analysis is a linear dimension reduction method that aims to find vectors in the space where classes are best decomposed by using class information of data objects [25]. In the discriminant analysis, the inter-class scattering matrix SB and the in-class scattering matrix SW are considered in the dimension reduction process. If 𝑥̅ expresses the average value of data objects for a data set with c number of classes, these matrices are defined as follows:
𝑆𝐵= ∑𝑐𝑖=1(𝑥̅𝑖− 𝑥𝑖)(𝑥̅ − 𝑥𝑖 𝑖)𝑇 (1)
𝑆𝑊 = ∑𝑐𝑖=1 ∑𝑁𝑖𝑗=1(𝑥̅𝑖− 𝑥𝑖)(𝑥̅ − 𝑥𝑖 𝑖)𝑇 (2)
In equations (1) and (2), 𝑥̅𝑖 expresses the average value of the ith class. The jth example of ith class is expressed
by 𝑥𝑖,𝑗 , and 𝑁𝑖 is the number of samples in the ith class. Then, Sb and Sw matrices are used to solve Eq(3) i.e.
finding the best 𝑾 directions that maximize 𝑆𝑏𝑊 and minimize 𝑆𝑤𝑊. 𝑆𝑏𝑊 and 𝑆𝑤𝑊 are the expressions of 𝑆𝑏 and
𝑾∗= 𝑎𝑟𝑔𝑚𝑎𝑥
𝑾(
𝑾𝑻𝑆𝐵𝑾
𝑾𝑻𝑆
𝑊𝑾) (3) 2.2.3. Naïve Bayes model
Naïve Bayes method is a supervised machine learning method. In this method, the system is trained using particular labelled data. Then, the probabilities are being calculated using the remaining test data. This model calculates the rate at which the event occurs relative to the next event. We can make a general definition with the model given in (4).
𝑃(𝑐|𝑥) =𝑃(𝑥|𝑐)𝑃(𝑐)
𝑃(𝑥) (4)
where 𝑃(𝑐|𝑥) is the probability of occurrence of 𝑐 when event 𝑥 occurs, 𝑃(𝑥|𝑐) is the probability of occurrence of 𝑥 when event 𝑐 occurs, 𝑃(𝑥) is the probability of occurrence of 𝑥, 𝑃(𝑐) is the probability of occurrence of 𝑐. 2.2.4. SVM (Support Vector Machine) model
Support vector machines are machine-learning algorithms that work in convex optimization according to the principle of structural risk minimization. To classify a data point between two groups in a plane, it divides the plane into two by drawing a line between these two groups, and each of the independent elements remain on one side of the border. This process is realized by drawing a separate line to each group, and then they are gradually brought closer. As a result, a common boundary line is produced. Linear SVMs classify large data using a linear cut plane and react quickly to a large number of structured data. On the other side, quadratic SVM models classify by creating a square plane or curve between sets. Cubic SVM models are another type of SVM algorithms which perform a classification by finding a hyperplane in a multi-dimensional space that divides classes as best as possible [26]. Here, the cubic SVM type classifier is used where the classifier's function 𝑘(𝑥𝑖, 𝑥𝑗) is defined as given in equation (5).
𝑘(𝑥𝑖, 𝑥𝑗) = (𝑥𝑖𝑇𝑥𝑗)3 (5)
2.2.5. KNN (K-Nearest Neighbor) model
KNN algorithm is also a supervised machine learning method widely used in clustering problems. This algorithm connects a data point with the closest neighbours and decides which cluster the element belongs to. The number of K - neighbourhoods cannot exceed the number of cluster elements [27].
2.2.6. Ensemble model
In collective classifiers, more than one singular classifier is brought together to enhance the classification performance. Algorithms such as decision trees, support vector machines, Naive Bayes method, linear separators and artificial neural networks are widely used as single classifiers [28].
The Bagging (Bootstrapping Aggregation) algorithm is a method that re-train the basic model by deriving new data from an existing training data. The purpose of Bagging is to derive new data sets and thus increase the overall classification accuracy.
3. Results and Discussions
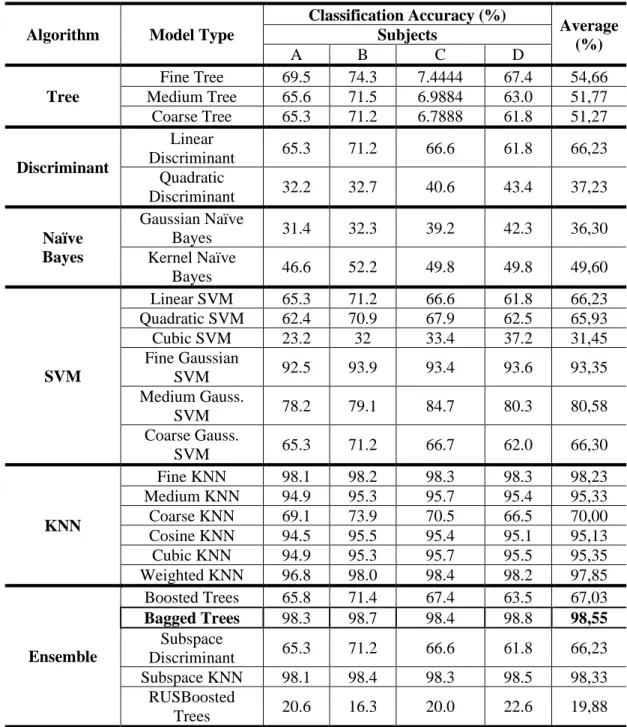
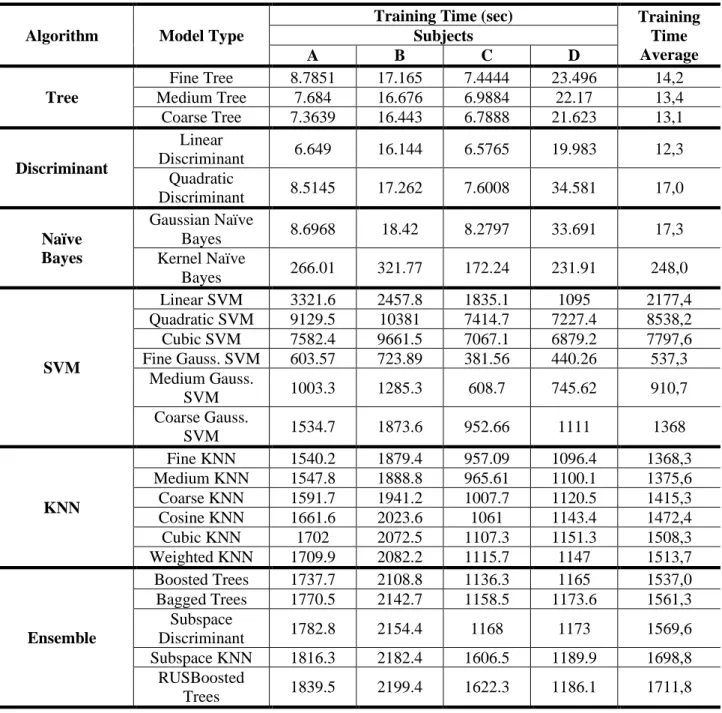
Training results of the 24-different machine-learning models were separately presented for four subjects A, B, C, and D. The Table 2 and Table 3 show the comparison of training results based on classification accuracy and training duration.
As can be seen from the Table 2 Decision Trees algorithms including Fine, Medium, and Coarse Tree methods has poorly performed in EMG signals classification with average accuracies of 54,66%, 51,77%, and 51,27% respectively. Despite these low classification accuracy rates, training times that can be follow from the Table 3 are short. Discriminant Analysis and Naïve Bayes algorithms can be also considered inappropriate for this
type of classification problem due to the low accuracies achieved by their both models. For discriminant analysis algorithm, average classification accuracy of linear and quadratic models are% 66,23 and %37,23 respectively. Additionally, none of the Naive Bayes models has shown an ability of good classification of such highly noisy signals.
Table 2. Classification Accuracy
Algorithm Model Type
Classification Accuracy (%) Average (%) Subjects A B C D Tree Fine Tree 69.5 74.3 7.4444 67.4 54,66 Medium Tree 65.6 71.5 6.9884 63.0 51,77 Coarse Tree 65.3 71.2 6.7888 61.8 51,27 Discriminant Linear Discriminant 65.3 71.2 66.6 61.8 66,23 Quadratic Discriminant 32.2 32.7 40.6 43.4 37,23 Naïve Bayes Gaussian Naïve Bayes 31.4 32.3 39.2 42.3 36,30 Kernel Naïve Bayes 46.6 52.2 49.8 49.8 49,60 SVM Linear SVM 65.3 71.2 66.6 61.8 66,23 Quadratic SVM 62.4 70.9 67.9 62.5 65,93 Cubic SVM 23.2 32 33.4 37.2 31,45 Fine Gaussian SVM 92.5 93.9 93.4 93.6 93,35 Medium Gauss. SVM 78.2 79.1 84.7 80.3 80,58 Coarse Gauss. SVM 65.3 71.2 66.7 62.0 66,30 KNN Fine KNN 98.1 98.2 98.3 98.3 98,23 Medium KNN 94.9 95.3 95.7 95.4 95,33 Coarse KNN 69.1 73.9 70.5 66.5 70,00 Cosine KNN 94.5 95.5 95.4 95.1 95,13 Cubic KNN 94.9 95.3 95.7 95.5 95,35 Weighted KNN 96.8 98.0 98.4 98.2 97,85 Ensemble Boosted Trees 65.8 71.4 67.4 63.5 67,03 Bagged Trees 98.3 98.7 98.4 98.8 98,55 Subspace Discriminant 65.3 71.2 66.6 61.8 66,23 Subspace KNN 98.1 98.4 98.3 98.5 98,33 RUSBoosted Trees 20.6 16.3 20.0 22.6 19,88
Fine Gauss SVM model in SVM algorithm has the highest performance in this algorithm with an average classification accuracy of 93,35%. The results in Table 2 also reflected the notably good accuracies achieved by all the KNN algorithm’ models except Coarse KNN. The Fine, Medium, Cosine, Cubic and Weighted KNN models’ average classification accuracies are more than %95.
The average accuracy of Bagged Trees and Subspace KNN based Ensemble algorithm models is 98,55 and 98,33. According to these results, Bagged Trees and Subspace KNN based Ensemble algorithm’ models have the highest classification accuracy compared to other models of the Ensemble algorithm. The highest classification accuracy in the whole models was obtained in the Bagged Trees model of Ensemble algorithm
with an average training time of 1561 second. The high accuracy achieved by these sub-methods is ascribed to the non-linearity nature of EMG signals. On the other hand, ensemble bagged trees method combines several base models. Thus, a single optimal model is produced. The obtained results show that the predictive performance of this model is higher than other models.
Table 3. Training Time (sec)
Algorithm Model Type
Training Time (sec) Training
Time Average Subjects A B C D Tree Fine Tree 8.7851 17.165 7.4444 23.496 14,2 Medium Tree 7.684 16.676 6.9884 22.17 13,4 Coarse Tree 7.3639 16.443 6.7888 21.623 13,1 Discriminant Linear Discriminant 6.649 16.144 6.5765 19.983 12,3 Quadratic Discriminant 8.5145 17.262 7.6008 34.581 17,0 Naïve Bayes Gaussian Naïve Bayes 8.6968 18.42 8.2797 33.691 17,3 Kernel Naïve Bayes 266.01 321.77 172.24 231.91 248,0 SVM Linear SVM 3321.6 2457.8 1835.1 1095 2177,4 Quadratic SVM 9129.5 10381 7414.7 7227.4 8538,2 Cubic SVM 7582.4 9661.5 7067.1 6879.2 7797,6 Fine Gauss. SVM 603.57 723.89 381.56 440.26 537,3 Medium Gauss. SVM 1003.3 1285.3 608.7 745.62 910,7 Coarse Gauss. SVM 1534.7 1873.6 952.66 1111 1368 KNN Fine KNN 1540.2 1879.4 957.09 1096.4 1368,3 Medium KNN 1547.8 1888.8 965.61 1100.1 1375,6 Coarse KNN 1591.7 1941.2 1007.7 1120.5 1415,3 Cosine KNN 1661.6 2023.6 1061 1143.4 1472,4 Cubic KNN 1702 2072.5 1107.3 1151.3 1508,3 Weighted KNN 1709.9 2082.2 1115.7 1147 1513,7 Ensemble Boosted Trees 1737.7 2108.8 1136.3 1165 1537,0 Bagged Trees 1770.5 2142.7 1158.5 1173.6 1561,3 Subspace Discriminant 1782.8 2154.4 1168 1173 1569,6 Subspace KNN 1816.3 2182.4 1606.5 1189.9 1698,8 RUSBoosted Trees 1839.5 2199.4 1622.3 1186.1 1711,8
Considering the correct classification and training periods together, it is seen that striking results are obtained. Accordingly, when Table 2 and Table 3 are examined together, the training times of Decision Tree, Discriminant and Naïve Bayes algorithms, which have low accuracy, are short. The Fine Gaussian model, which has the highest average accuracy in the SVM algorithm, has both high performance and fast training with an average training time of 537,3 seconds. KNN algorithms also have high accuracy. Average training times in this algorithm range from 1368 seconds to 1513,7 seconds. In the Ensemble algorithm, the average training times range from 1537 to 1711,8 seconds. The average training time of the Bagged Trees model, which has the highest classification accuracy among all models, is 1513 seconds.
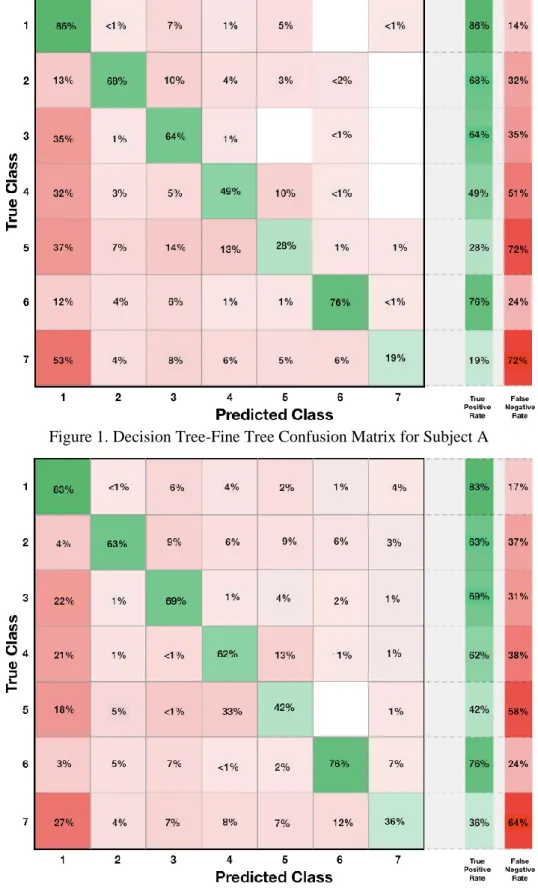
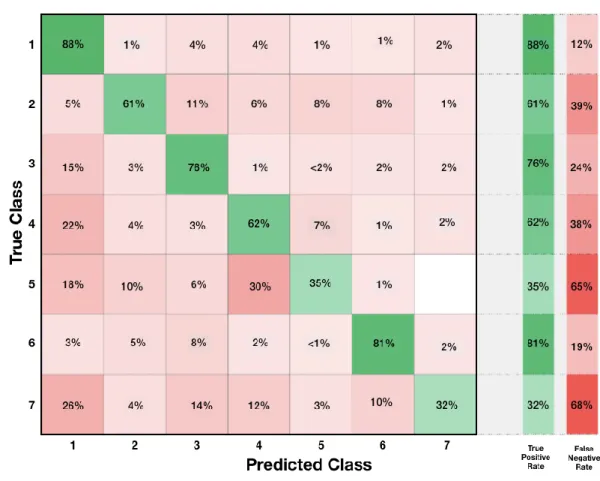
In multi categorical classification problems, accuracy can be misleading and, in some cases, does not reflect the real performance of a classification algorithm. To verify the obtained classification accuracy, confusion matrices related to subject A are given as an example for some algorithms between Figure 1 to Figure 6. It is clear that the results in the confusion matrices and the results in Table 2 are consistent. The confusion matrices show with details the ability of each algorithm to perform the classification of EMG signals into 7 different movements.
Figure 1. Decision Tree-Fine Tree Confusion Matrix for Subject A
Figure 3. Naïve Bayes - Kernel Confusion Matrix for Subject A
Figure 5. KNN-Fine KNN Confusion Matrix for Subject A
4. Conclusions
In this study, 8 channel EMG signals from 4 subjects were used to classify 7 different wrist and static hand gestures. 24 different models of 6 basic machine learning algorithms were used for classification. The classification results obtained were compared with the classification accuracy and training time parameters. According to the test results, the Ensemble algorithm Bagged Trees model has been shown to have the highest classification performance with an average classification accuracy of 98.55% among these models. The Ensemble Bagged Trees classified the raw EMG data with a very high performance. This reveals the classification capacity of Ensemble models, which have a structure consisting of a combination of other basic models.
In the next study, the algorithms that have the highest performance with the obtained results will be applied to biomechatronic systems and these systems will be tested with real patients.
References
[1] J. Basmajian and C. J. DeLuca, Muscles Alive: Their Functions Revealed by Electromyography, 5th ed., Baltimore: William and Wilkins, 1985.
[2] K. Englehart, B. Hudgin and P. Parker, “A wavelet-based continuous classification scheme for multifunction myoelectric control,” IEEE Trans. Biomed. Eng.,vol. 48, pp. 302–311, 2001.
[3] Q. She, Z. Luo, M. Meng and P. Xu, “Multiple kernel learning SVM-based EMG pattern classification for lower limb control,” Proceedings of the 2010 11th International Conference on Control Automation Robotics Vision, Singapore, 2010.
[4] O. Fukuda, T. Tsuji, M. Kaneko and A. Otsuka, “A human-assisting manipulator teleoperated by EMG signals and arm motions,” IEEE Trans. Robot. Autom., vol. 19, pp. 210–222, 2003.
[5] V. Constantinides, M. Papahatzaki, G. K. Papadimas, N. Karandreas, T. Zambelis, P. Kokotis and P. Manda, “Diagnostic Accuracy of Muscle Biopsy and Electromyography in 123 Patients with Neuromuscular Disorders,” In Vivo, vol 32, no. 6, pp. 1647–1652, 2018.
[6] S. Lynch, B. A.J., J. Smith, C. Harper and E. Tanaka, “Complications of needleelectromyography: hematoma risk and correlation with anticoagulation andantiplatelet therapy,” Muscle Nerve, vol 38, p. 1225–1230, 2008.
[7] R. Levin, R. Pascuzzi, D. Bruns, J. Boyd, T. Toly and L. Phillips, “The timecourse of creatine kinase elevation following concentric needle EMG,” MuscleNerve, vol 10, p. 242–245, 1987.
[8] G. Pfeiffer and K. Kunze, “Discriminant classification of motor unit potentials (MUPs) successfully separates neurogenic and myopathic conditions”, Electro-encephalogr. Clin. Neurophysiol., vol 97, no. 5, pp.191–207, 1995.
[9] Y. Xiang, B. Pant, A. Eisen, M.P. Beddoes and D. Poole, “Multiply sectioned Bayesian networks for neuromuscular diagnosis”, Artif. Intell. Med., vol.5, no.4, pp. 293–314, 1993.
[10] E. Abel, P. Zacharia, A. Forster and T. Farrow, “Neural network analysis of the EMG interference pattern”, Med. Eng. Phys., vol 18, no 1, pp. 12–17, (1996).
[11] B. Pandey and R.B. Mishra, “An integrated intelligent computing model for the interpretation of EMG based neuromuscular diseases”, Expert Syst. Appl., vol 36, no. 5, pp. 9201–9213, 2009.
[12] A. Subasi, M.Yilmaz, H.R. Ozcalik, “Classification of EMG Signals Using Wavelet Neural Network,”
Journal of Neuroscience Methods, vol 156, no. 1-2, pp. 360- 367, 2006.
[13] Jing Luo, Chenguang Yang, Chao Liu, Yuxia Yuan, Zhijun Li, "Wrist Motion Recognition by Using
Electromyographic Signals", Advanced Robotics and Mechatronics (ICARM) 2019 IEEE 4th
International Conference on, pp. 130-135, 2019.
[14] S. Koçer, “Classification of EMG signals using neuro-fuzzy system and diagnosis of neuromuscular diseases”, J. Neurosci. Methods, vol.34, pp. 321–329,2010.
[15] M. Khezri, M. Khezri and N. N. Sadati, “Neuro-Fuzzy Surface EMG Pattern Recognition For Multifunctional Hand Prosthesis Control,” IEEE International Symposium on Industrial Electronics, 2007.
[16] M. Lucas, A. Gaufriau, S. Pascual, C. Doncarli and D. Farina, “Multi-Channel Surface EMG Classification Using Support Vector Machines and Signal-Based Wavelet Optimization Machines,”
Biomedical Signal Processing and Control, vol 3, pp. 169-174, 2008.
[17] Y. Lu, Z. Ju, Y. Liu, Y. Shen and H. Liu, “Time series modeling of surface EMG based hand manipulation identification via expectation maximization algorithm,” Neurocomputing, no. 168, p. 661–618, 2015. [18] Y. Omama, C. Haddad, M. Machaalany, A. Hamoudi, M. Haji-Hassan, M. Ali and L. Hamawy, “Surface
EMG Classification of Basic Hand Movement,” Fifth International Conference on Advances in Biomedical Engineering (ICABME), Tripoli, 2019.
[19] T. Tsuji, O. Fukuda, H. Ichinobe and K. Makoto, “A log-linearized gaussian mixture network and its application to EEG pattern classification,” IEEE Trans. Syst., Man, Cybern. C, vol 29, no. 1, pp. 60–72, 1999.
[20] Motion Lab Systems, Inc., “A software user guide for EMG Graphing and EMG Analysis,” Los Angeles, 2009.
[21] http://archive.ics.uci.edu/ml/datasets/EMG+data+for+gestures. [Access Time: January 2020].
[22] Thalmic Lab., https://support.getmyo.com/hc/en-us/categories/200376195-Myo-101. [Access Time: April 2020].
[23] R. Agrawal, T. Imielinski and A. Swami, “Database Mining: A Performance Perspective,” IEEE Transactions on Knowledge and Data Engineering, vol 5, no. 6, pp. 914-925, 1993.
[24] M. Dunham, Data Mining Introductory and Advanced Topics, Prentice Hall, 2003.
[25] M. Martinez and A. Kak, “PCA versus LDA,” IEEE Transactions on Pattern Analysis and Machine Intelligence, vol 23, pp. 228-233, 2001.
[26] Y. L. Lin and G. Wei, “Speech emotion recognition based on HMM and SVM,” 2005.
[27] S. Caliskan, İ. Sogukpinar, “KxKNN: K-Means and K En Yakın Komşu Yöntemleri ile Aglarda Nufuz Tespiti,” in 2nd Network and Information Security Symposium, Girne, 2008.