University of Wollongong
University of Wollongong
Research Online
Research Online
Faculty of Engineering and Information
Sciences - Papers: Part B
Faculty of Engineering and Information
Sciences
2019
Weak Micro-Scratch Detection Based on Deep Convolutional Neural
Weak Micro-Scratch Detection Based on Deep Convolutional Neural
Network
Network
Limei Song
Tianjin Polytechnic University, [email protected]
Wenwei Lin
Tianjin Polytechnic University
Yan Yang
Tianjin University of Technology And Education
Xinjun Zhu
Tianjin Polytechnic University
Qinghua Guo
University of Wollongong, [email protected]
See next page for additional authors
Follow this and additional works at: https://ro.uow.edu.au/eispapers1
Part of the Engineering Commons, and the Science and Technology Studies Commons
Recommended Citation
Recommended Citation
Song, Limei; Lin, Wenwei; Yang, Yan; Zhu, Xinjun; Guo, Qinghua; and Xi, Jiangtao, "Weak Micro-Scratch Detection Based on Deep Convolutional Neural Network" (2019). Faculty of Engineering and Information Sciences - Papers: Part B. 2535.
https://ro.uow.edu.au/eispapers1/2535
Research Online is the open access institutional repository for the University of Wollongong. For further information contact the UOW Library: [email protected]
Weak Micro-Scratch Detection Based on Deep Convolutional Neural Network
Weak Micro-Scratch Detection Based on Deep Convolutional Neural Network
Abstract
Abstract
Metal component surfaces are random textured and non-smooth. There are many stains on the surface of metal component that are similar to the gray scale of the scratches. The scratches have non-uniform gray distribution, various shapes, and low contrast in their background, posing challenges in accurate scratch detection. This paper presents a method for detecting weak scratches on metal component surfaces based on deep convolutional neural networks (DCNNs). First, a DCNN is trained using labeled scratch images. Then, the scratches and some faults are detected by the trained DCNN, and most of the faults can be removed through properly thresholding based on the size of connected regions. Finally, the scratch length united in the number of pixels is obtained by the skeleton extraction. The experimental results show that the proposed method can effectively deal with background noise, thereby achieving accurate scratch detection.
Disciplines
Disciplines
Engineering | Science and Technology Studies
Publication Details
Publication Details
L. Song, W. Lin, Y. Yang, X. Zhu, Q. Guo & J. Xi, "Weak Micro-Scratch Detection Based on Deep Convolutional Neural Network," IEEE Access, vol. 7, pp. 27547-27554, 2019.
Authors
Authors
Limei Song, Wenwei Lin, Yan Yang, Xinjun Zhu, Qinghua Guo, and Jiangtao Xi
Received January 9, 2019, accepted January 19, 2019, date of publication February 26, 2019, date of current version March 13, 2019.
Digital Object Identifier 10.1109/ACCESS.2019.2894863
Weak Micro-Scratch Detection Based on
Deep Convolutional Neural Network
LIMEI SONG 1, WENWEI LIN1, YAN-GANG YANG2, XINJUN ZHU1,
QINGHUA GUO 3, (Member, IEEE), AND JIANGTAO XI 3, (Senior Member, IEEE) 1Key Laboratory of Advanced Electrical Engineering and Energy Technology, Tianjin Polytechnic University, Tianjin 300387, China
2National-Local Joint Engineering Laboratory of Intelligent Manufacturing Oriented Automobile Die & Mould, Tianjin University of Technology and Education, Tianjin 300222, China
3School of Electrical, Computer and Telecommunications Engineering, University of Wollongong, Wollongong, NSW 2500, Australia Corresponding author: Yan-Gang Yang ([email protected])
This work was supported in part by the National Natural Science Foundation of China under Grant 61078041 and Grant 51806150, in part by the Natural Science Foundation of Tianjin under Grant 16JCYBJC15400 and Grant 18JCQNJC04400, in part by the National Natural Science Foundation Committee, in part by the Tianjin Research Program of Application Foundation and Advanced Technology, in part by the State Key Laboratory of Precision Measuring Technology and Instruments, Tianjin University, under Grant PIL1603, and in part by the Program for Innovative Research Team, University of Tianjin, under Grant TD13-5036.
ABSTRACT Metal component surfaces are random textured and non-smooth. There are many stains on the surface of metal component that are similar to the gray scale of the scratches. The scratches have non-uniform gray distribution, various shapes, and low contrast in their background, posing challenges in accurate scratch detection. This paper presents a method for detecting weak scratches on metal component surfaces based on deep convolutional neural networks (DCNNs). First, a DCNN is trained using labeled scratch images. Then, the scratches and some faults are detected by the trained DCNN, and most of the faults can be removed through properly thresholding based on the size of connected regions. Finally, the scratch length united in the number of pixels is obtained by the skeleton extraction. The experimental results show that the proposed method can effectively deal with background noise, thereby achieving accurate scratch detection.
INDEX TERMS Deep convolutional neural network, scratch, machine vision. I. INTRODUCTION
Scratches are a type of defect on the surface of metal components. In the traditional industry, scratch defects are often detected by manual visual inspection. Manual visual inspection is inefficient and exhibits high error detection rate. Machine vision technology has the advantages of high speed, low cost and non-destructiveness in inspection, making it widely used in industrial inspection. Statistical analysis, structural analysis, filtering methods and wavelet transform are the four main methods of machine vision detec-tion technology. Histogram analysis is a kind of statistical analysis method. It analyzes image texture features based on histogram, divergence, chi-square and normalization. Truong and Kim [1] proposed an improved Ostu’s method based on entropy weighting for the detection of small defects. Taoet al.[2] proposed a coarse-to-fine detection strategy of weak scratch in the complicated dark-field images of the large-aperture optical element. The Co-occurrence matrix method is another well-known statistical analysis method. The co-occurrence matrix method describes the gray-scale variation under specific spatial conditions by establishing
a joint conditional probability function. The image texture features can be analyzed by entropy, energy, and correla-tion of co-occurrence matrices. Yanget al.[3] used the gray level co-occurrence matrix to obtain the defect characteristics of thin film transistors, and classified the defect features by neural network. The method realizes the identification detection of five types of defects of the thin film transistor. However, histogram statistics only apply to large differences in grayscale between defects and their background. The co-occurrence matrix method has a high computational load, and it is also sensitive to unstable grayscale changes.
The structural analysis method is to study the primitives that make up the image texture and the spatial arrange-ment of these primitives. Guan and Shi [4] proposed a new method that is put forward to detect fabric surface defect by target-driven features. Liet al.[5] proposed a fabric defect detection method based on low rank technique. The method utilizes the property of the fabric image to have a repeating texture structure to achieve detection of fabric defects.
Filter-based surface defect detection can be implemented in the spatial or frequency domain. In the frequency
VOLUME 7, 2019
2169-35362019 IEEE. Translations and content mining are permitted for academic research only. Personal use is also permitted, but republication/redistribution requires IEEE permission. See http://www.ieee.org/publications_standards/publications/rights/index.html for more information.
L. Songet al.: Weak Micro-Scratch Detection Based on DCNN
domain, the image is often analyzed by Fourier transform. Linet al. [6] proposed a method of defect detection for ground with complex texture using Fourier transform. The method removes the texture information of the ground by zeroing the high-frequency components, and detects the defects of the reconstructed image by Canny operator.
The Fourier transform is a global method of character-izing the spatial frequency distribution of an image, which lacks the local description ability for detecting small devi-ations in an image. Therefore, windowing Fourier trans-forms such as Gabor transformations are introduced to add spatial information to frequency analysis. Vijaykumar and Angamithirai [7] enhance the difference between defect and defect background through Gabor filter, and realize the detection of track defects. However, Gabor filtering is computationally expensive and requires careful selection of filter parameters at different scales. Multiresolution anal-ysis based on wavelet transform has become a common method to extract texture features. Different from Gabor transformation using fixed spatial resolution, wavelet trans-form applies multi-scale spatial resolution to frequency channel and produces abundant texture feature representa-tion. Texture features extracted from wavelet decomposi-tion images are widely used for texture classificadecomposi-tion and segmentation [8], [9]. Yanget al. [10] proposed a method of using stationary wavelet transform to detect low contrast defects in magnetic tile images under various illuminations. Yaoet al.[11] The multi-scale wavelet representation is used to obtain the features of the input image. The number of features is calculated by Hotelling 2 method as the threshold of scratch and background segmentation. Finally, the scratch detection is realized. Haoet al.[12] combined wavelet trans-forms with improved adaptive line enhancement method to reduce background noise and enhance the image features of track defects to achieve the detection of track defects.
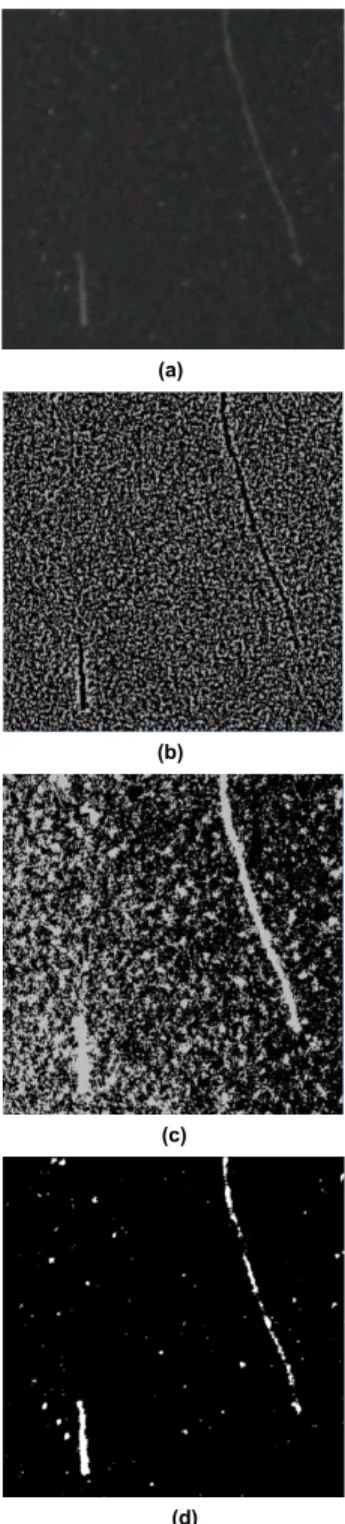
The metal component surfaces are of random texture, non-smoothness and a lot of stains. The scratches have non-uniform gray distribution, various shapes, and low contrast with their background. Therefore, it is difficult to accurately detect the scratch on the surface of metal compo-nent based on traditional machine vision detection methods such as statistical analysis, structural analysis and filtering. FIGURE 1(a) is an example of the scratch. As shown in FIGURE 1(b) and (c), it is difficult to distinguish the scratch area from the background using traditional image processing (such as global threshold of Otsu, Gaussian weighting and threshold of local neighborhood blocks). As shown in FIGURE 1(d), although the scratch area can be separated from the background by a globally fixed threshold, scratch information will be lost. The existing detection methods can detect scratch defects with complex texture on the surface to a certain extent, but there are still some shortcomings: 1) Image features are acquired through a large number of image preprocessing, and the quality of the features directly affects the detection effect; 2) The selection of features requires expert cognition;
FIGURE 1.Example of scratch image. (a) Scratch image. (b) Otsu threshold image. (c) Gaussian local threshold image. (d) Fixed threshold image.
3) Artificially extracted features are susceptible to interfer-ence and do not have good applicability and practicability.
In recent years, deep convolutional neural networks (DCNNs) have performed well in the field of machine vision and solved challenging tasks such as image recog-nition and image segmentation. This success is due to the ability of DCNNs to learn raw input data without relying on manually extracted features. As the number of network layers’ increases, the features extracted from the network will become richer The shallower layers hold local infor-mation, while the deeper layers use filters, which have a
L. Songet al.: Weak Micro-Scratch Detection Based on DCNN
wider receiving domain and therefore capture global infor-mation [13]. Masciet al.[14] proposed a maximum pooled convolutional neural network method for supervising the classification of steel defects. Its optimal network is twice as effective as the traditional support vector machine classifier. Chaet al.[15] combined deep convolutional neural network with sliding window technology to identify and detect cracks on concrete surface, and proved that the method is better than traditional Canny and Sobel edge detection algorithms.
Based on the above situation, this paper proposes a method based on DCNN to detect weak scratches on metal compo-nent surfaces. First, a DCNN is trained using labeled scratch images. Then, the scratches and their backgrounds are sepa-rated by the trained DCNN. By setting the threshold value of connected domain, the small area of false segmentation can be removed. Finally, the scratch length united in the number of pixels is obtained by the skeleton extraction. The method in this paper does not require pre- processing the image, and a good model can be obtained by a small number of training samples. It is robust against illumination changes and uneven surface illumination.
This paper is organized as follows. A brief descrip-tion of the detecdescrip-tion system is presented in secdescrip-tion 2. Section 3 provides a detailed description of the scratch detec-tion method and a method to distinguish the scratch and inter-ference. Section 4 gives the experiment and results. Finally, the paper concludes in section 5.
II. MACHINE VISION DETECTION SYSTEM
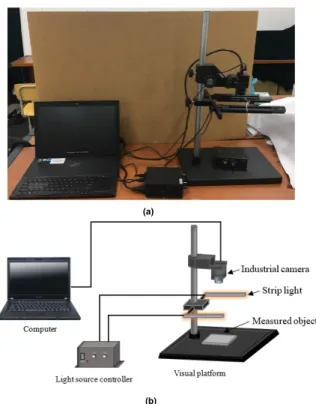
The detection system consists of a set of visual support platform, an industrial camera (RS-A2300-GC50) and a lens (Computar), two white strip light sources, a light source controller (HF-DY15-2) and a computer. Device Settings are shown in FIGURE 2. The visual support platform is used for placing and fixing light sources and industrial cameras. The light source controller controls the brightness and darkness of two white strip light sources. I The system captures images using an industrial camera with a 16mm lens. The computer processes the image acquired by the camera.
III. SCRATCH DETECTION METHOD
A. DEEP CONVOLUTIONAL NEURAL NETWORK STRUCTURE
The traditional convolutional neural network classifies images, but it is unable to realize image segmentation. Chaet al.[15] combined neural network and sliding window technology to realize crack detection of concrete. Although this method can detect the crack area, it is inefficient and unable to detect the crack quantitatively. In 2015, Longet al. [16] proposed the use of Fully Convolutional Networks (FCN) for image semantic segmentation. The method can separate the target area from the background area to realize detection of the target area. U-net is an improvement of FCN, which has shown outstanding performance in the field of medical image segmentation [17]. The advantage of U-net is that it can solve the problem of image segmentation,
FIGURE 2. Machine vision detection system. (a) Machine vision detection system real figure. (b) Schematic diagram of machine vision detection system.
and only a small number of training samples are needed. In order to better segment the scratch area, the DCNN in this paper adjusts the structure of the U-net. The DCNN in this paper is called DU-net. The DU-net has the same advantages as the U-net, can work with a small number of training images, and produces accurate segmentation.
FIGURE 3. The DU-net structure.
The DU-net architecture is shown in FIGURE 3. It consists of a contraction path (left) and an extension path (right).
L. Songet al.: Weak Micro-Scratch Detection Based on DCNN
The contraction path follows the typical structure of convolu-tion network. It consists of a single 3×3 convolutions, a single 2 ×2 max pool merge operation. In each down sampling step, we double the number of feature channels. Each step in the extended path includes an unsampled 2×2 convolution (upward convolution) of the feature map with a feature map connection corresponding to the contraction path, and a single 3×3 convolution layer. In the final layer, each 16-component eigenvector is mapped to the required number of classes using 1 ×1 convolution. Different from the U-net, the DU-net maintains the same input and output size to avoid edge loss of the image. The DU-net simplifies the structure of the U-net and avoids over-fitting caused by overly complex structures. In addition, the DU-net is superior to the U-net in training speed, and can accurately segment the scratch image.
B. TRAINING
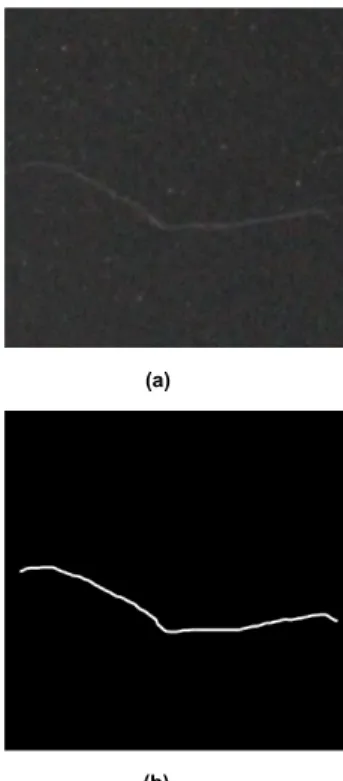
Unlike image recognition problems of CNNs (such as image recognition), CNNs for pixel analysis do not contain any fully connected layers, and the entire network consists of only convolution, deconvolution, and pooling layers. In this paper, the three-channel scratch image of size is 512×512 used as the training set input image. The scratch binarization image with the size of 512×512 manually marked is used as the training set label image. The sample image of the input image and the label image is shown in FIGURE 4.
FIGURE 4. Training set input image and output image. (a) Input image. (b) Label image.
The energy function is calculated by a combination of a softmax function and a cross entropy loss function. Calcu-lating the probability distribution of the final feature map
pixel using the softmax function. The cross-entropy loss func-tion measures the distance between each label image pixel and the softmax function classification result. The softmax formula is as follows: pi(x)= eai(x) PI i0=1ea 0 i(x) (1) whereai(x) represents the score of each pixel pointx corre-sponding to the feature channel i; I represent the number of classes;pi(x) is the classification result of the corresponding pixel of classi.
The distance between the predicted value and the expected value is calculated by the cross entropy. The lower the value of the cross entropy, the closer the real value and the predicted value are. The cross-entropy formula is as follows:
E =X
x∈qr(x)log(pl(x)) (2)
where qr(x) represents the probability distribution of the predicted value, r : → R is the predicted result of each pixel;pl(x) represents the probability distribution of the expected value, andl : → {1, ...,K}is the true label of each pixel.
In order to make the training better, it is very necessary to carry out data augmentation. In this paper, the data is augmented by operations such as rotation, smooth deforma-tion, and miscut transformadeforma-tion, as shown in
FIGURE 5. Through data augmentation, we expanded the original image of 100 scratches to 500 images. This paper randomly divides 500 images into 400 training samples and 100 test samples.
C. SCRATCH INFORMATION ACQUISITION
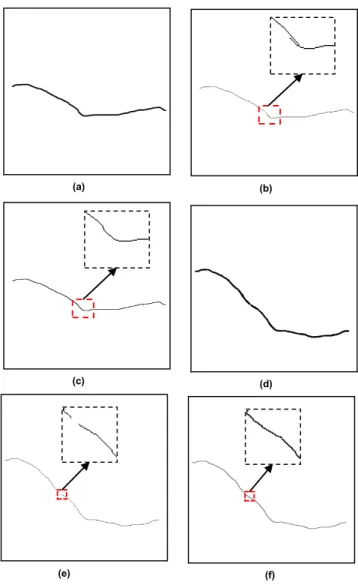
In order to obtain the arc length information of the scratches, the scratch skeleton is extracted by the K3M algorithm [18]. The K3M algorithm is a sequential iterative algorithm: the iterations are repeated in sequence until no modification is made to the image during the whole iteration. The K3M algorithm is not the focus of this paper, so it will not be described in detail here. In this paper, K3M algorithm is compared with two skeleton extraction algorithms to prove the superiority and effectiveness of K3M algorithm. The results are shown in FIGURE 6 (In order to observe the results better, we perform image color reversal operation.). From the results of the skeleton extraction, it can be seen that there are "branches" in the skeleton extraction of the table lookup algorithm and " fragments" in the algorithm proposed by Zhang and Suen [19]. K3M algorithm avoids the above two situations and effectively extracts the scratch skeleton. This is an important reason for this paper to select K3M algorithm as the scratch skeleton extraction method. The arc length of the scratch is obtained by calculating the number of pixels in the connected domain of the scratch skeleton.
L = m X x=1 n X y=1 g(x,y)lp (3) 27550 VOLUME 7, 2019
L. Songet al.: Weak Micro-Scratch Detection Based on DCNN
FIGURE 5. Data enhancement. (a) Original image. (b) Rotate image. (c) Smooth deformation image. (d) Miscut transform image.
whereLis the arc length of the scratched area, the unit ismm;
lpis the actual length corresponding to a single pixel, the unit ismm;g(x,y) represents the connected domain pixel after the scratch is extracted by the K3M algorithm skeleton.
IV. EXPERIMENT
We use 500 expanded training images as training samples, in which the size of input and output images are 512×512. The equipment used in the experiment was the Asus notebook
FIGURE 6. Skeleton extraction. (a) original image. (b) table lookup algorithm. (c) K3M algorithm. (d) original image. (e) Zhang proposed algorithm. (f) K3M algorithm.
ROG GX501VIK7700, and its main parameters are shown in TABLE 1.
TABLE 1.ROG GX501VIK7700 computer main parameters.
The experiment uses the tensorflow GPU version training model of Google’s machine learning architecture. The opti-mization algorithm adopted in this paper is Adam (Adaptive Moment Estimation) algorithm [20]. The exponential decay
L. Songet al.: Weak Micro-Scratch Detection Based on DCNN
TABLE 2. The DU-net is compared with the U-net.
TABLE 3. The Comparison of IoU.
rate of the first moment estimate is set to 0.9, the exponential decay rate of the second moment estimate is set to 0.999 and the epsilon is set to 1e-8. The experiment sets the initial learning rate to 1e-4 and batch size to 5. The experiment uses the Msra initialization method [21] to initialize the parameters. The number of epochs of training is 1000. The comparison of DU-net and U-net training process parameters is shown in TABLE 2. In the same experimental environment, the training time of the DU-net is much smaller than that of the U-net, and the accuracy is higher than that of the U-net.
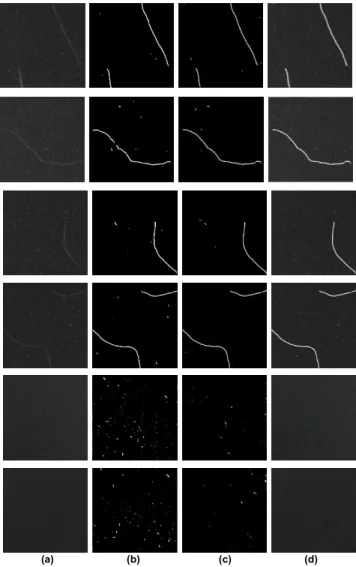
In order to verify the robustness of this algorithm in detecting fine scratches on metal surface, as shown in Fig. 7, 4 sets of different scratch images (long/short, straight/curved, horizontal/vertical) and 2 sets of non-scratch images are shown. We use U-net and DU-net to image segmentation of scratch images. After removing the small area of the partially segmented by the setting of the connected region threshold, the scratches detected by the DU-net are superimposed on the original for visual comparison. From FIGURE 7., We can intuitively see that U-net generates more false segmenta-tion for scratch image segmentasegmenta-tion, which cannot be elimi-nated by setting the connected region threshold. By contrast, the DU-net in this paper also generates some false segmen-tation, but the image processing method can effectively eliminate these false segmentation areas and avoid false detection. Seen from the second set of images, U-net caused the scratches to be segmented, which is not the result we want. The DU-net in this paper does not happen in the case of image segmentation.
This paper uses IoU (Intersection-over-Union) to evaluate the accuracy of segmentation results. The expression of IoU is as follows:
IoU = Sm∩Sa
Sm∪Sa
(4)
FIGURE 7. Comparison of the DU-net and the U-net segmentation effect (a) Original image; (b) Scratch segmentation of the U-net; (c) Scratch segmentation of the DU-net; (d) Scratch segmentation and original image overlay.
TABLE 4.Error analysis.
whereSmis the actual scratch area,Sais the segmentation area predicted by the model,Sm∩Sais the overlap area between the real area of the scratch and the model prediction, and
Sm∪Sais the intersection of the real area of the scratch and the predicted area of the model.
We used 100 scratch images as the test set and calculated the IoU to evaluate the segmentation results. The results of IoU evaluation are shown in TABLE.3. It can be seen from the evaluation results of IoU that the method proposed in this
L. Songet al.: Weak Micro-Scratch Detection Based on DCNN
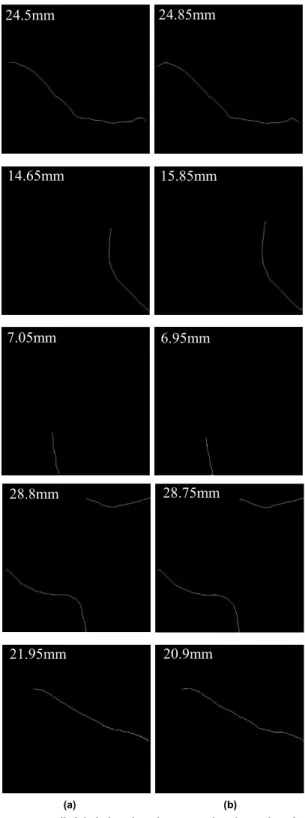
FIGURE 8. Manually labeled arc length compared to the arc length obtained by the method. (a) Manually labeled arc length. (b)detected arc length.
paper has a better effect on the segmentation of scratched areas.
In order to further prove the accuracy of the proposed method in detecting scratches, this paper uses K3M algo-rithm to extract the skeleton of the segmented scratched area. According to the calculation, the actual size of a single pixel is 0.05mm. The error analysis of the scratch arc length is shown in TABLE 4. Fig.8 shows the comparison of 5 groups
of predicted scratch images and real scratch images. As can be seen from the figure, the size of the scratch and the shape of the scratch obtained by the method are basically the same as the size of the scratch of the artificial mark. The maximum error is 1.24mm, which does not affect our positioning of the scratches and the information acquisition of the arc length. V. CONCLUSION
In this paper, a method for detecting fine scratches on the surface of metal components based on DCNNs is proposed. The scratches have non-uniform gray distribution, various shapes, and low contrast with their background, posing chal-lenges in accurate scratch detection. We use the DU-net proposed in this paper to segment the image of the scratched image, and set the connected region threshold to remove the small area of the mis-segmentation. Finally, we use the K3M algorithm to extract the skeleton from the scratched area and obtain the length of the scratch. The experiment proves that the algorithm in this paper can effectively and qualitatively detect weak micro-scratches.
REFERENCES
[1] M. T. N. Truong and S. Kim, ‘‘Automatic image thresholding using Otsu’s method and entropy weighting scheme for surface defect detection,’’Soft Comput., vol. 2, no. 13, pp. 4197–4203, 2017.
[2] X. Tao, D. Xu, Z.-T. Zhang, F. Zhang, X.-L. Liu, and D.-P. Zhang, ‘‘Weak scratch detection and defect classification methods for a large-aperture optical element,’’Opt. Commun., vol. 387, pp. 390–400, Mar. 2017. [3] S.-W. Yang, C.-S. Lin, S.-K. Lin, and H.-T. Chiang, ‘‘Automatic defect
recognition of TFT array process using gray level co-occurrence matrix,’’ Optik Int. J. Light Electron Opt., vol. 125, no. 11, pp. 2671–2676, 2014. [4] S. Guan and H. Shi, ‘‘Fabric defect detection based on the saliency map
construction of target-driven feature,’’J. Textile Inst., vol. 100, no. 9, pp. 1133–1142, 2017.
[5] P. Li, J. Liang, X. Shen, M. Zhao, and L. Sui, ‘‘Textile fabric defect detec-tion based on low-rank representadetec-tion,’’Multimedia Tools Appl., vol. 3, pp. 1–26, Nov. 2017.
[6] B. Lin, S. Chen, X. Han, and X. Liang, ‘‘Automatic damage detection of engineering ceramics ground surface based on texture analysis,’’Trans. Tianjin Univ., vol. 19, no. 4, pp. 267–271, 2013.
[7] V. R. Vijaykumar and S. Sangamithirai, ‘‘Rail defect detection using Gabor filters with texture analysis,’’ inProc. Int. Conf. Signal Process., Chennai, India, Mar. 2015, pp. 1–5.
[8] S. Arivazhagan and L. Ganesan, ‘‘Texture segmentation using wavelet transform,’’Pattern Recognit. Lett., vol. 24, no. 16, pp. 3197–3203, 2003. [9] U. S. N. Raju, V. V. Kumar, A. Suresh, and M. R. Mani, ‘‘Texture descrip-tion using different wavelet transforms based on statistical parameters,’’ in Proc. 2nd WSEAS Int. Conf. Wavelets Theory Appl. Appl. Math. (WAV), Istanbul, Turkey, 2008, pp. 174–178.
[10] C. Yang, P. Liu, G. Yin, H. Jiang, and X. Li, ‘‘Defect detection in magnetic tile images based on stationary wavelet transform,’’NDT&E Int., vol. 83, pp. 78–87, Oct. 2016.
[11] L. Yao, Y. Wan, M. Yao, and B. Xu, ‘‘Detecting fine scratches on smooth surfaces with multiscale wavelet representation,’’Meas. Sci. Technol., vol. 23, no. 23, pp. 1259–1276, 2012.
[12] Q. Hao, X. Zhang, Y. Wang, Y. Shen, and M. Makis, ‘‘A novel rail defect detection method based on undecimated lifting wavelet packet transform and Shannon entropy-improved adaptive line enhancer,’’J. Sound Vib., vol. 425, pp. 208–220, Jul. 2018.
[13] M. D. Zeiler and R. Fergus, ‘‘Visualizing and understanding convolu-tional networks,’’ inComputer Vision—ECCV(Lecture Notes in Computer Science), vol. 8689, D. Fleet, T. Pajdla, B. Schiele, and T. Tuytelaars, Eds. 2014, pp. 818–833.
[14] J. Masci, U. Meier, D. Ciresan, J. Schmidhuber, and G. Fricout, ‘‘Steel defect classification with max-pooling convolutional neural networks,’’ in Proc. Int. Joint Conf. Neural Netw., Brisbane, QLD, Australia, Jun. 2012, pp. 1–6.
L. Songet al.: Weak Micro-Scratch Detection Based on DCNN
[15] Y.-J. Cha, W. Choi, and O. Büyüköztürk, ‘‘Deep learning-based crack damage detection using convolutional neural networks,’’Comput.-Aided Civil Infrastruct. Eng., vol. 32, no. 5, pp. 361–378, May 2017.
[16] E. Shelhamer, J. Long, and T. Darrell, ‘‘Fully convolutional networks for semantic segmentation,’’IEEE Trans. Pattern Anal. Mach. Intell., vol. 39, no. 4, pp. 640–651, Apr. 2017.
[17] O. Ronneberger, P. Fischer, and T. Brox, ‘‘U-net: Convolutional networks for biomedical image segmentation,’’ inMedical Image Computing and Computer-Assisted Intervention—MICCAI (Lecture Notes in Computer Science), vol. 9351, N. Navab, J. Hornegger, W. Wells, and A. Frangi, Eds. 2015, pp. 234–241.
[18] K. Saeed, M. Tabędzki, M. Rybnik, and M. Adamski, ‘‘K3M: A universal algorithm for image skeletonization and a review of thinning techniques,’’ Int. J. Appl. Math. Comput. Sci., vol. 20, no. 2, pp. 317–335, 2010. [19] T. Y. Zhang and C. Y. Suen, ‘‘A fast parallel algorithm for thinning digital
patterns,’’Commun. ACM, vol. 27, no. 3, pp. 236–239, 1984.
[20] D. P. Kingma and J. Ba. (2014). ‘‘Adam: A method for stochastic optimiza-tion.’’ [Online]. Available: https://arxiv.org/abs/1412.6980
[21] K. He, X. Zhang, S. Ren, and J. Sun, ‘‘Delving deep into rectifiers: Surpassing human-level performance on imagenet classification,’’ inProc. IEEE Int. Conf. Comput. Vis., Dec. 2015, pp. 1026–1034.
[22] C. Li, Y. Yang, and H. Xiong, ‘‘Dual-threshold algorithm study of weak-scratch extraction based on the filter and difference,’’High Power Laser Part. Beams, vol. 27, no. 7, pp. 97–104, 2015.
[23] G. Ghiasi and C. C. Fowlkes, ‘‘Laplacian pyramid reconstruction and refinement for semantic segmentation,’’ in Computer Vision—ECCV (Lecture Notes in Computer Science), vol. 9907, B. Leibe, J. Matas, N. Sebe, and M. Welling, Eds. 2016, pp. 519–534.
LIMEI SONGreceived the B.E., M.E., and Ph.D. degrees in measurement technology and instru-mentation from Tianjin University, Tianjin, China, in 1999, 2001, and 2004, respectively. She was an Associate Professor with the Southwest University of Science Technology, from 2006 to 2008. She was a Visiting Scholar with the Hiroshima Institute of Technology, Japan, in 2006, and the Univer-sity of Wollongong, Wollongong, Australia, from 2011 to 2012. In 2008, she joined as an Associate Professor with Tianjin Polytechnic University, where she is currently a Professor and the Vice Dean of the School of Electrical engineering and Automation. Her research interests include machine vision, 3-D optical measurement, reverse engineering, and pattern recognition.
WENWEI LIN received the B.E. degree from Tianjin Polytechnic University, Tianjin, China, in 2016, where he is currently pursuing the M.E. degree.
YAN-GANG YANG received the B.E. and M.E. degrees in measurement technology and instru-mentation from Tianjin University, Tianjin, China, in 1999 and 2004, respectively. He was an Engi-neer with the China Academy of EngiEngi-neering Physics, from 2004 to 2007. He was a Chief Engi-neer with CPOWER Company, from 2008 to 2012. He was the CTO of Tianjin Tong Yang Company and the Leader of the national special project— Online Automatic Monitoring of Odor. He joined as an Experimenter with the Tianjin University of Technology and Education, where he is currently a Senior Experimentalist with the College of Mechan-ical Engineering. His research interests include machine vision, optMechan-ical spectrum analysis, and reverse engineering.
XINJUN ZHU received the B.E. degree from Linyi University, in 2008, the M.E. degree from the Shandong University of Technology, in 2011, and the Ph.D. degree from Tianjin University, in 2015. He joined Tianjin Polytechnic University, in 2015. His research interests include fringe anal-ysis, phase retrieval for optical 3-D measurement, and light scattering techniques for particles.
QINGHUA GUO(S’07–M’08) received the B.E. degree in electronic engineering and the M.E. degree in signal and information processing from Xidian University, Xi’an, China, in 2001 and 2004, respectively, and the Ph.D. degree in elec-tronic engineering from the City University of Hong Kong, Hong Kong, in 2008. He is currently with the School of Electrical, Computer and Telecommunications Engineering, University of Wollongong, Wollongong, NSW, Australia. His research interests include signal processing, 3-D reconstruction, and telecommunications. He was a recipient of the Australian Research Council’s Discovery Early Career Researcher Award.
JIANGTAO XI(M’95–SM’06) received the B.E. degree from the Beijing Institute of Technology, Beijing, China, in 1982, the M.E. degree from Tsinghua University, Beijing, in 1985, and the Ph.D. degree from the University of Wollongong, Wollongong, Australia, in 1996, all in elec-trical engineering. He was a Post-Doctoral Fellow with the Communications Research Laboratory, McMaster University, Hamilton, ON, Canada, from 1995 to 1996, and a member of the Technical Staff, Bell Laboratories, Lucent Technologies Inc., NJ, USA, from 1996 to 1998. From 2000 to 2002, he was the Chief Technical Officer of TCL IT Group Co., China. In 2003, he rejoined the University of Wollongong as a Senior Lecturer, where he is currently a Professor and the Head of the School of Electrical, Computer, and Telecommunications Engineering. His research interests include signal processing and its applications in various areas, such as optoelectronics, instrumentation and measurement, and telecommunications.