DigitalCommons@University of Nebraska - Lincoln
Dissertations and Theses in Agricultural Economics Agricultural Economics Department
8-2019
How Does Identifying as Gluten-Free Impact
Information Choice Regarding the Gluten-Free
Diet?
Pratiksha Baishya
University of Nebraska - Lincoln, pratiksha.baishya@gmail.com
Follow this and additional works at:https://digitalcommons.unl.edu/agecondiss
Part of theAgribusiness Commons,Agricultural and Resource Economics Commons,Behavioral Economics Commons, and theMarketing Commons
This Article is brought to you for free and open access by the Agricultural Economics Department at DigitalCommons@University of Nebraska -Lincoln. It has been accepted for inclusion in Dissertations and Theses in Agricultural Economics by an authorized administrator of
DigitalCommons@University of Nebraska - Lincoln.
Baishya, Pratiksha, "How Does Identifying as Gluten-Free Impact Information Choice Regarding the Gluten-Free Diet?" (2019).
Dissertations and Theses in Agricultural Economics. 60.
INFORMATION CHOICE REGARDING THE GLUTEN-FREE DIET?
By
Pratiksha Baishya
A THESIS
Presented to the Faculty of
The Graduate College at the University of Nebraska In Partial Fulfillment of Requirements
For the Degree of Master of Science
Major: Agricultural Economics
Under the Supervision of Professor Christopher R. Gustafson
Lincoln, Nebraska
REGARDING THE GLUTEN-FREE DIET?
Pratiksha Baishya, M.S.
University of Nebraska, 2019
Advisor: Christopher R. Gustafson
The market for gluten-free products is a multi-billion-dollar industry in the United
States and has seen tremendous growth in the recent years. The retail sales of gluten-free
foods in the United States almost tripled between 2011 and 2015, although rates of
diagnosed gluten-related health problems have not risen. In addition to people who suffer
from Celiac Disease, Wheat Allergy and Non-Celiac Gluten Sensitivity, there is a
category or people known as PWAG (people who avoid gluten) who seem to have
significantly contributed to this boom in the market for gluten-free foods. With more
people choosing to adopt the gluten-free diet, there might be a negative effect for people
who genuinely need to adhere to the gluten-free diet for medical reasons. An increase in
the number of PWAG may be attributable in part to the bias that people have for “free-from” food labels, believing them to be healthier. Such beliefs among people arise due to selective information seeking and avoidance behaviors. Beliefs can act as self-regulatory
measures to form various identities among individuals. In this study, we examine how
identifying as gluten-free influences the valence of information (positive, negative, both
positive and negative) about the gluten-free diet that people choose to read. We
developed a survey which was administered online by the survey firm IRI. Only people
who had previously tried to reduce/avoid gluten from their diets or are currently on a
likely to read about the benefits of following a gluten-free diet, though the result is not
First and foremost, I would like to express my sincere gratitude towards my
advisor Dr. Christopher Gustafson for all his support, guidance and encouragement over
the past year. He has been an excellent faculty member to work with and I’m especially
thankful to him for introducing me to research in behavioral economics pertaining to
health and nutrition. I’m grateful for the knowledge and the ideas that he has shared with
me throughout and for helping me realize my future potential as an agricultural
economist.
I am also thankful to Dr. Devin Rose and Dr. Kathleen Brooks for serving on my
committee and providing beneficial feedback on my thesis.
I am very thankful to the Department of Agricultural Economics for the financial
support towards my graduate study, and for providing a collaborative and enabling
environment for research, teaching and learning. I also want to thank and acknowledge
my classmates and professors from the past two years.
I would also like to thank Kristina Arslain for being a great colleague to work
with and develop the survey for the study.
To my family, thank you for always believing in me and for the tremendous
support you’ve provided me with throughout the years. I owe it all to you.
To all my friends in Lincoln, thank you for making the past couple of years so
great. I would especially like to thank Anubrata, Susweta, Manos, Pipe, Qianyu,
CHAPTER 1: INTRODUCTION 1
1.1 Statement of the issue and motivation for the study 1
1.2 Relevant literature 5
1.3 Objective of the study 8
CHAPTER 2: MATERIALS AND METHODS 9
2.1 Methodology and Data 9
2.2 Model Specification 15
2.2(a) Understanding determinants of identity 15
2.2(b) Estimating the impact of identity on information choice 18
CHAPTER 3: RESULTS 20
CHAPTER 4: DISCUSSION AND CONCLUSION 24
References 25
Appendix I – Survey Questionnaire 28
Appendix II – Transformation of categorical variables for data analysis
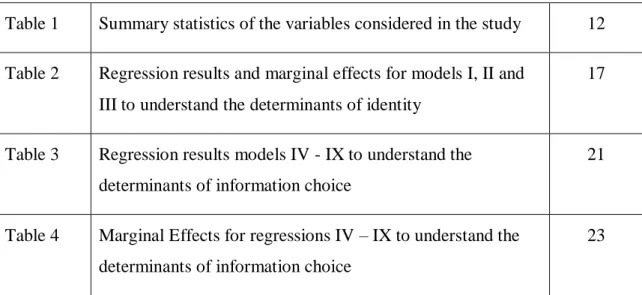
Table 1 Summary statistics of the variables considered in the study 12
Table 2 Regression results and marginal effects for models I, II and III to understand the determinants of identity
17
Table 3 Regression results models IV - IX to understand the determinants of information choice
21
Table 4 Marginal Effects for regressions IV – IX to understand the determinants of information choice
CHAPTER 1: INTRODUCTION 1.1 Statement of the issue and motivation for the study
Gluten sensitivity/intolerance affects about 6 to 7 percent of the population in the
United States (Fasano 2012). Gluten is a complex protein found predominantly in wheat
(gliadin and glutenin), rye (secalin), barley (hordein) and oats (avenin), which are jointly
referred to as prolamins (Biesiekierski 2017). While it is critical for people affected by
gluten sensitivity to avoid wheat, rye and barley, some can safely consume oats (Garsed
and Scott 2006). This is because the content of prolamin, the protein responsible for the
sensitivity, in wheat, barley and rye is much higher—around 40 percent—than that in
oats, approximately 15 percent (Haboubi et al. 2006). Eliminating gluten from their diets
is critical for people suffering from autoimmune disorders like Celiac Disease (also
known as celiac sprue or gluten-sensitive enteropathy) and Wheat Allergy. Non-Celiac
Gluten Sensitivity (NCGS) is yet another type of gluten intolerance which has recently
acknowledged by researchers and is suggested to be the most common gluten-related
disorder (Barbaro et al. 2018, Niland and Cash 2018). Contrary to Celiac Disease, which
can be diagnosed by medical professionals, the lack of a specific diagnostic procedure for
NCGS means that most individuals with NCGS are self-diagnosed (Biesiekierski 2014).
The incidence of self-diagnosis of Celiac Disease has increased among people in recent years
due to the cost and time constraints associated with medical diagnosis (Copleton and
Valle 2009). Multiple websites, discussion boards and support groups provide online
checklists for common symptoms of gluten sensitivities and suggest remedies for
the groups providing information and promoting the gluten-free diet include Beyond
Celiac (www.beyondceliac.org), and the Celiac Disease Foundation (www.celiac.org),
among others. These platforms promoteself-diagnosis through assessment of the
abatement of symptoms after a period of gluten avoidance.
In addition to diagnosed (both self and medical) gluten sensitivities, there is also a
category of people termed as people who avoid gluten (PWAG). This category of people
follows the gluten-free diet without having Celiac Disease and may even be completely
asymptomatic to gluten sensitivities. According to the Niland and Cash (2018), people
with NCGS are also categorized as PWAG, since they have not been officially diagnosed.
Data from the National Health and Nutrition Examination Survey (NHANES) showed
that the prevalence of PWAG tripled between 2009 and 2014, whereas the prevalence of
Celiac Disease remained stable. PWAG constituted 72 percent of the people who
followed the gluten-free diet in 2014, compared to 44 percent in 2009 (Choung et al.
2016). The self-initiation of the gluten-free diet among PWAG is attributed to beliefs
those individuals hold that the free version of a product is healthier than its
gluten-containing counterpart. A few recent studies support this view. A study by Priven et al.
(2015) found that a significant proportion of the total population considered a gluten-free
product, as well as a product labeled as not containing a fictitious ingredient called MUI,
to be healthier than the conventional product (25.5 and 21.9 percent respectively). Prada
et al. (2019) also found similar results for both gluten-free products and the gluten-free
diet. The study evaluated self-reported knowledge of the participants about gluten-free
gluten-free products, the participants perceived gluten-free foods to be healthier. The
study also tested whether people knew about the gluten content in various items and
found that people were confused whether sausages, rice, seafood sticks, oats, and other
foods that do not contain wheat, barley, or rye contained gluten. Some people think
gluten-free foods are superior to conventional foods in promoting weight loss, avoiding
carbohydrates, and improving overall health, diet, digestive health and skin complexion
(Watson 2013, Dunn et al. 2014).
The increase in the number of people following the gluten-free diet has led to a
rise in the market for gluten-free products. The global market for gluten-free products
was valued at $4.26 billion in 2016 and is expected to reach $7.38 billion in 2021
(Statista Research Department 2018). Comparative market statistics in the United States
show that between 2011 and 2015 the retail sales of gluten-free foods tripled from $464
million to nearly $1.6 billion (Watson 2016). This boom in the market may be
attributable in part to the bias that people have for “free-from” food labels, considering them to be healthier (Hartmann et al. 2018).
The burgeoning demand for gluten-free foods in the market, especially by
PWAG, could have a negative effect for people who need to adhere to a gluten-free diet
for medical reasons (Worosz and Wilson 2012). Studies show that following a gluten-free
diet also comes with an economic burden as the gluten-free products are more expensive
than their gluten-containing counterparts (Lee et al. 2007). Although most PWAG buy
gluten-free foods assuming them to be healthier, many gluten-free foods in reality contain
and can contribute to a less healthy diet (Mansharamani 2015). In fact, studies on Celiac
patients following a strict gluten-free diet have found an increase in both weight and body
mass index (BMI) among the subjects over time (Dickey and Kearney 2006, Kabbani et
al. 2012). Another possible explanation for this weight gain might be the decreased
intestinal malabsorption and reduced gastrointestinal problems (bloating, nausea,
abdominal pain) which are common symptom for Celiac patients consuming gluten.
Missbach et al. (2015) concluded from their study that replacing conventional
gluten-containing foods with gluten-free counterparts does not provide any additional health
benefits to non-gluten-sensitive consumers and in fact only results in a more expensive
diet.
Most studies on gluten-free products have primarily been directed towards
improving the sensory and nutritional qualities of the products and finding better
substitute ingredients to wheat, barley and rye. The motivation behind this is the fact that
the gluten-free products are poor sources of minerals, vitamins and fiber (Saturni et al.
2010). Minor or pseudo-cereals like amaranth, buckwheat, quinoa, sorghum, teff, etc.
serve as promising alternatives to improve intake of protein, iron, calcium and fiber in
gluten-sensitive people (Lee et al. 2009). Such products are now readily available in the
market with companies like BFree, Glutino, and Gluten-free Prairies, specifically
producing only gluten-free items.
The research that has been conducted on consumer attitudes towards gluten-free
foods so far has mostly used small samples that are not representative of the US
students at University of Florida; the study by Hartmann et al. (2018) was conducted for
the European countries of United Kingdom, Sweden, Poland and France. A number of
studies also focus on only Celiac patients and do not account for all PWAG. While the
research suggests that an important segment of consumers perceives gluten-free foods to
be healthier, the research has not answered why consumers have that perception.
Testing for knowledge that people currently have about gluten, gluten-free
products or the gluten-free diet may provide a better understanding of the bias that people
have towards gluten-free products over conventional products. It may also be indicative
of the basis for beliefs among people about the gluten-free diet in general. Consumers
who are unable to accurately evaluate food labels or health information likely make
biased decisions or rely on rules of thumb when making choices, as illustrated by people
who preferred the fictitious MUI-free labeled food in the study by Priven et al. (2015).
1.2 Relevant Literature
Recent research in psychology and economics has illustrated how important information
seeking and avoidance behavior is in shaping beliefs and behaviors. According to
neoclassical microeconomic theory, information is valuable to individuals--at worst,
information may provide no value (Benabout and Tirole 2016). In general, information
helps in improving the consumer’s decision-making abilities. In contrast to neo-classical theory, behavioral economics suggests that people might not look at a given piece of
information in the same way and use heuristics to make decisions. According to Ariely
(2000), using heuristics and controlling information flow can positively influence the
people in their decision-making processes also vary based on the type and source of
information they expose themselves to (or are exposed to) and exposure to information
can be guided by either defense or accuracy motives. Beliefs -- which are shaped by
exposure to information -- fulfill both important psychological and functional needs of an
individual (Benabout and Tirole 2016). Beliefs can act as self-regulatory measures to
form various identities among individuals. Identity is in essence a set of beliefs that
people value and defend (Benabout and Tirole 2016). Depending on the identity that one
associates with, people may prefer selective exposure to information in order to defend
their beliefs by avoiding information that is likely to challenge their beliefs and seeking
information that supports their beliefs. Such selectivity of information is known as
confirmation or congeniality bias (Hart et al. 2009).
Studies are limited in looking into information seeking and avoidance behavior
based on the identity in regard to gluten-free foods and diet. Previous studies look into
the dimensions of identity and decision making for food choices pertaining to veganism
and organic foods, but none have been done in relation to a specific diet such as the
gluten-free diet. For instance, Sneijder and Molder (2009) studied the relation between
ideologically based food choice and identity in an online forum on veganism and
included the notion of identity as part of a social action and Shaw and Shui (2002)
studied self-identity and ethical obligations in relation to ethical consumer choice in the
UK. Both the studies indicate that when an issue becomes central to an individual’s identity, the behavior gets adjusted.
Studies examining individuals’ decisions to access scientific information
pertaining to food and health are also limited. According to Pew Internet and American
Life Project about 61 percent of American adult internet users search for health
information online and 60 percent said that online information affects their healthcare
decisions (Fox and Jones 2009). People search online for advice and information related
to conditions, symptoms and treatment options (Shuyler and Knight 2003). Xiao et al.
(2014) studied people’s online health information search for cancer to elucidate factors that influence search behavior. They found that perceived quality of communication with
medical professionals has no impact on the frequency of information search on the
internet and one’s health status does not lead to a preference for using online information. Zander and Hamm (2012) studied information search behavior and its determinants in
relation to ethical attributes of organic food (organic milk in particular) in four
countries—Austria, Switzerland, Germany and UK—using an Information Display
Matrix (IDM) where an individual could choose to read information about any of the
attributes for the given varieties of organic milk. The authors state that people are more
involved when confronted with ethical products and tend to carry out an extensive
information search to know about such products. They go on to state that when the
information is accessible, the information search is more extensive, and the information
acquisition is more pronounced when the expected benefit is higher (for example when
the purchase decision is felt to be important). The literature pertinent to our research
1.3 Objective of the study:
In this thesis, I examine the impact of self-identifying as gluten-free on
information choice behavior related to the gluten-free diet, while assessing the knowledge
an individual has with regards to the gluten-free diet and products. The hypothesis for the
study will be based off the following statement by Benabout and Tirole (2016, p. 148):
“When asset-like beliefs are involved, people will tend to ignore, discount,
rationalize away, or put out of mind the news that conflicts with these ideas while
welcoming data that supports them.”
We hypothesize that an individual for whom being gluten-free is an important part
of his/her identity will be more likely to view only the positive aspects of the information
provided (i.e. potential benefits of a gluten-free diet) compared to the negative or
combined aspects, in order to avoid conflicting information. The remainder of the paper
will elaborate on the literature related to identity and information behavior, the model and
CHAPTER 2: MATERIALS AND METHODS
2.1 Methodology and Data
This work derives from a broader study which attempted to elucidate the drivers
of the gluten-free diet among both gluten-sensitive and gluten-tolerant individuals. We
developed a survey which included 55 questions that addressed demographic
characteristics (gender, age, etc.) of the respondents, their experience with various diets
including the gluten-free diet, their purchase behavior pertaining to gluten-free products,
their knowledge and beliefs about gluten and gluten-free products, sources of information
they referred to regarding the diet and medical diagnosis of gluten-sensitivity. The survey
instrument is included in Appendix I. To examine the role of identity in choice of
information source, we focus on two specific questions: participants’ agreement with the statement “Being gluten free is an important part of my identity,” and an information choice task about the gluten-free diet. The question about identifying as gluten-free had
two potential responses, yes or no, and was only presented to people who had followed or
are still following the reduced-gluten/gluten-free diet. Following this question was a
choice task in which participants had to choose to either read about the benefits of
following a gluten-free diet, the costs of following a gluten-free diet, or both the benefits
and costs of following a gluten-free diet. The information provided was summarized from
the article by Cash and Niland (2018).
The survey was administered online by IRI, a leading survey firm. A total of
5,513 individuals across the United States started the survey, of which 3,051 individuals
who did not respond to trigger questions correctly, or who completed the survey in less
than five minutes.
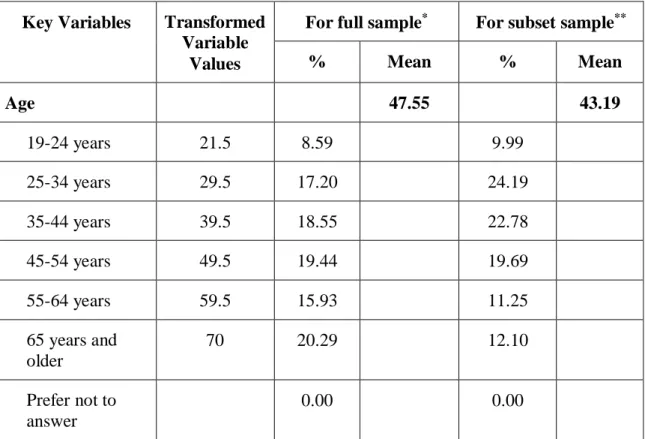
The variables considered in our study are listed in Table 1. The columns full
sample and subset sample represents the entire population (N= 3051) and the subsample
considered for analysis in our study (n=711). While most variables were collected as
categorical variables, a few control variables – age, household income and level of
education completed – were transformed into continuous variables for data analysis. For
example, an individual whose age is in the category 25-34 years was assigned a numeric
value of 29.5. Similarly, an individual whose household income is in the category
$40,000-$59,999 was assigned a numeric value of 50 (units were in thousands of dollars)
and for an individual who has an undergraduate degree, a numerical value of 16 was
assigned. Appendix II has details about how each category for the concerned variables
was transformed.
The questions regarding diet history of an individual involved three separate
choices to indicate whether the individual had never tried the diet, had tried it previously
but was not currently following it, or was currently following it. The survey included
questions about eliminating gluten entirely from one’s diet (gluten-free) and avoiding, but not eliminating, gluten from one’s diet (reduced-gluten). For our analysis, however, the data for the two diets were combined into a single variable. This was done as regression
results indicated that there was no difference in behavior between these groups.
Combining the two diets also addressed concerns about small sample sizes in the
(currently following vs. followed in the past but not currently following). We maintained
the distinction between those who were currently following the diet versus those who had
followed the diet in the past but were no longer following it. People who had never tried
either of the diets were not included in the sample.
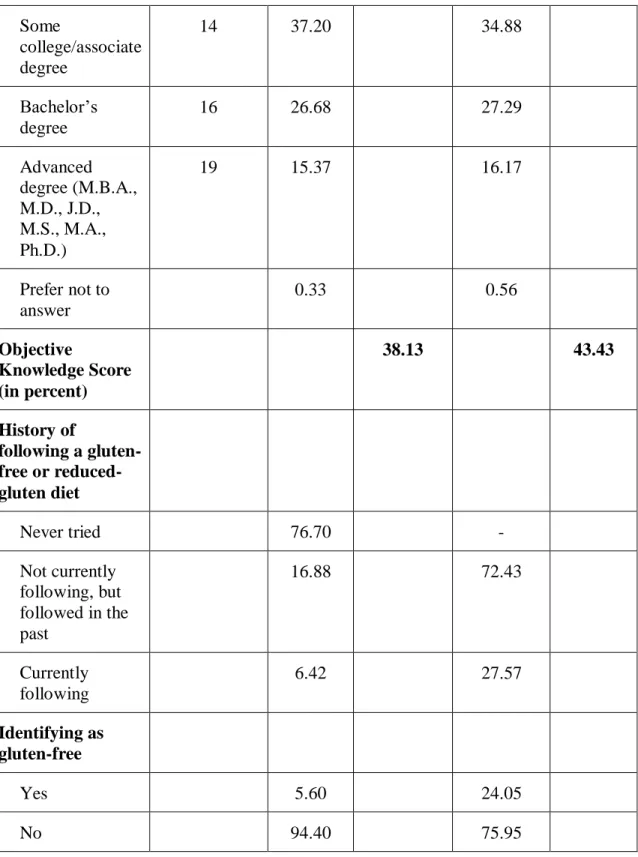
The survey had a total of nine objective knowledge questions about gluten,
gluten-free diet and gluten-free products. The objective knowledge questions were treated
as a quiz. For every question an individual answered correctly, they received one point;
they received zero points for a wrong answer. The percentage of correctly answered
questions was then calculated (that is, an individual’s score was calculated by taking the number of questions they answered correctly divided by the total number of questions
and multiplied by 100) and used as a continuous variable in our analysis. On an average
the objective knowledge score was 38.13 percent and 43.43 percent for the whole
population and the sample respectively.
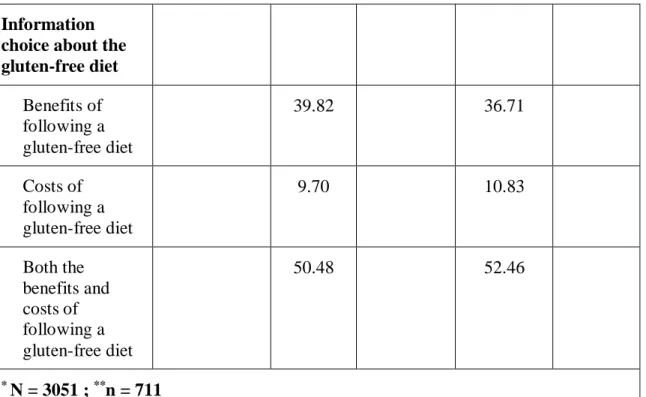
For the information choice variable, we combined the categories “Costs of
following a gluten-free diet” and “Both benefits and costs of following a gluten-free diet”
into a single category. Only ten percent of the respondents in our sample had chosen to
look at the information that only discussed the costs of following a gluten-free diet.
For people who had never followed a gluten-free/reduced-gluten diet, it was clear
that being gluten-free would not be an important part of their identity. Since the study
specifically investigates the impact identity has on information choice, we limited the
sample used for the analysis to only those who have been on the
particular valence of information would be different for people who have versus those
who have not tried the diet. Both categories of people would also have different beliefs
regarding the diet which would impact information choice. Hence, out of the total subject
pool of 3,051 respondents we use a subset sample for the study of the 711 respondents
who have tried the diet or are currently on it. The summary statistics for both the total
population and the subset sample can be found in Table 1. The subset sample considered
in our analysis is mostly representative of the total population for all the categories for
each of the variables.
Table 1: Summary statistics for variables considered in the study
Key Variables Transformed
Variable Values
For full sample* For subset sample**
% Mean % Mean Age 47.55 43.19 19-24 years 21.5 8.59 9.99 25-34 years 29.5 17.20 24.19 35-44 years 39.5 18.55 22.78 45-54 years 49.5 19.44 19.69 55-64 years 59.5 15.93 11.25 65 years and older 70 20.29 12.10 Prefer not to answer 0.00 0.00
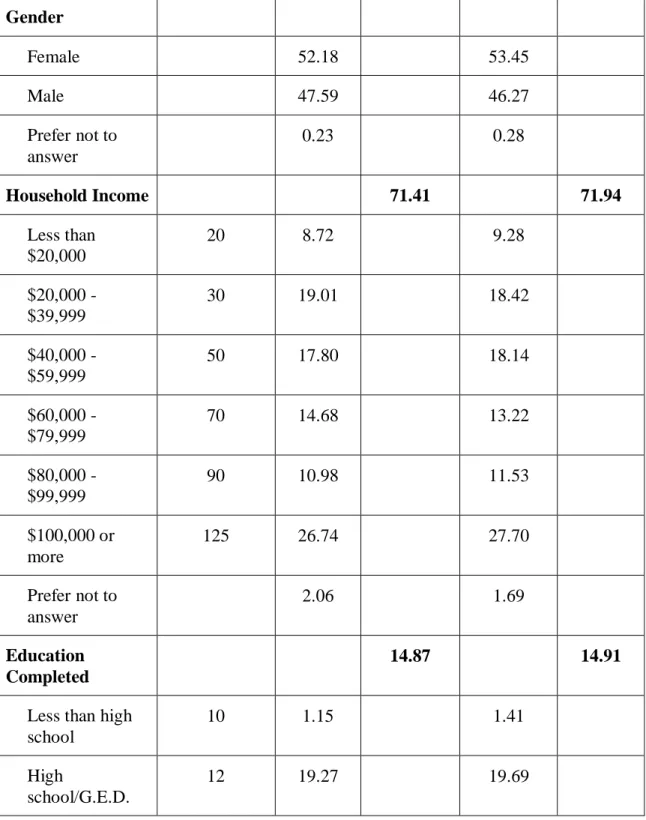
Table 1 (continued): Summary statistics for variables considered in the study Gender Female 52.18 53.45 Male 47.59 46.27 Prefer not to answer 0.23 0.28 Household Income 71.41 71.94 Less than $20,000 20 8.72 9.28 $20,000 - $39,999 30 19.01 18.42 $40,000 - $59,999 50 17.80 18.14 $60,000 - $79,999 70 14.68 13.22 $80,000 - $99,999 90 10.98 11.53 $100,000 or more 125 26.74 27.70 Prefer not to answer 2.06 1.69 Education Completed 14.87 14.91
Less than high school
10 1.15 1.41
High
school/G.E.D.
Table 1 (continued): Summary statistics for variables considered in the study Some college/associate degree 14 37.20 34.88 Bachelor’s degree 16 26.68 27.29 Advanced degree (M.B.A., M.D., J.D., M.S., M.A., Ph.D.) 19 15.37 16.17 Prefer not to answer 0.33 0.56 Objective Knowledge Score (in percent) 38.13 43.43 History of following a gluten-free or reduced-gluten diet Never tried 76.70 - Not currently following, but followed in the past 16.88 72.43 Currently following 6.42 27.57 Identifying as gluten-free Yes 5.60 24.05 No 94.40 75.95
Table 1 (continued): Summary statistics for variables considered in the study
Information choice about the gluten-free diet Benefits of following a gluten-free diet 39.82 36.71 Costs of following a gluten-free diet 9.70 10.83 Both the benefits and costs of following a gluten-free diet 50.48 52.46 * N = 3051 ; **n = 711 2.2 Model Specification
a. Understanding determinants of identity
Since identity is our primary variable of interest in the study, we first wanted to
test if any of the key variables considered in our study predicted the identity variable.
Binary logistic regression was used for this purpose. The following regression model (I)
was first fitted with our sample data:
𝑖𝑑𝑒𝑛𝑡𝑖𝑡𝑦𝑖 = 𝛽0+ 𝛽1 ℎ𝑖𝑠𝑡𝑖+ 𝜀𝑖 . . . (𝐼)
Here, the variable identityi represents whether or not being gluten-free is an
diet status (1 = currently following; 0 = followed diet in the past but not currently
following). The regression results and the marginal effects for the given model are
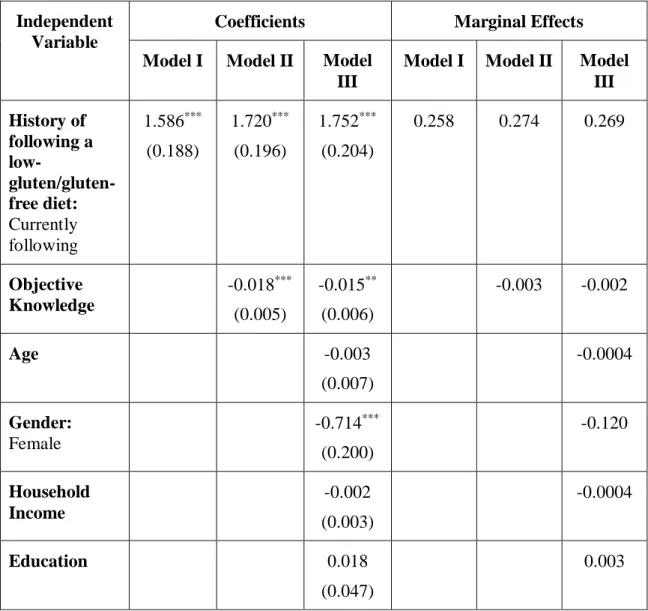
presented in Table 2. Results show that histi significantly impacts identityi and people
who are currently on the gluten-free diet are 25.8 percentage points more likely to
identify as gluten-free.
Next we included the variable for objective knowledge score OK_pcti in model I
to see its impact on identityi:
𝑖𝑑𝑒𝑛𝑡𝑖𝑡𝑦𝑖 = 𝛽0 + 𝛽1 ℎ𝑖𝑠𝑡𝑖 + 𝛽2 𝑂𝐾_𝑝𝑐𝑡𝑖 + 𝜀𝑖 . . . (𝐼𝐼)
The regression results and the marginal effects for model (II) are presented in
Table 3. The variable histi continues to be significant; OK_pcti is also significantly
related to identityi. People who have tried the gluten-free diet before but are not currently
on it are 27.4 percentage points less likely to identify as gluten-free when we control for
objective knowledge. For every one percent increase in the objective knowledge score, an
individual is 0.3 percentage points less likely to identify as gluten-free.
Next, we looked into the impact of the demographic variables age, gender,
household income and level of education completed (agei, geni, inciand educi), along
with the variables histiand OK_pcti, on identityi:
𝑖𝑑𝑒𝑛𝑡𝑖𝑡𝑦𝑖 = 𝛽0+ 𝛽1 ℎ𝑖𝑠𝑡𝑖 + 𝛽2 𝑂𝐾_𝑝𝑐𝑡𝑖
The regression results and the marginal effects for the given model (III) are
presented in Table 3. Along with histi and OK_pcti, genialso significantly impacted
identityi. Females are 12 percentage points less likely to identify as gluten-free.
Table 2: Regression results and marginal effects for models I, II and III to understand the determinants of identity
Independent Variable
Coefficients Marginal Effects
Model I Model II Model
III
Model I Model II Model
III History of following a low- gluten/gluten-free diet: Currently following 1.586*** (0.188) 1.720*** (0.196) 1.752*** (0.204) 0.258 0.274 0.269 Objective Knowledge -0.018*** (0.005) -0.015** (0.006) -0.003 -0.002 Age -0.003 (0.007) -0.0004 Gender: Female -0.714*** (0.200) -0.120 Household Income -0.002 (0.003) -0.0004 Education 0.018 (0.047) 0.003
Table 2 (continued): Regression results and marginal effects for models I, II and III to understand the determinants of identity
Constant -1.708*** (0.122) -0.972*** (0.234) -0.801 (0.678) -0.277 -0.155 -0.123 Observations 711 711 695 Log Likelihood -356.197 -349.848 -331.188 AIC 716.394 705.696 676.375
** significant at 1 percent level of significance *** significant at 0.1 percent level of significance
b.Estimating the impact of identity on information choice
We used binary logistic model again to check the impact of the key variables on
the valence of information choice. Three separate regressions were run to first check the
individual impacts of identityi, histi and OK_pcti on the dependent variable—
infochoicei—which represents the information chosen by respondent i. We then carried
out a couple of regressions including only identityi, histi and OK_pcti at first and then all
of the independent variables to determine which model was a better fit. The models used
for these five regressions are as follows:
𝑖𝑛𝑓𝑜𝑐ℎ𝑜𝑖𝑐𝑒𝑖 = 𝛽0+ 𝛽1 𝑖𝑑𝑒𝑛𝑡𝑖𝑡𝑦𝑖 + 𝜀𝑖 . . . (𝐼𝑉) 𝑖𝑛𝑓𝑜𝑐ℎ𝑜𝑖𝑐𝑒𝑖 = 𝛽0+ 𝛽1 ℎ𝑖𝑠𝑡𝑖 + 𝜀𝑖 . . . (𝑉) 𝑖𝑛𝑓𝑜𝑐ℎ𝑜𝑖𝑐𝑒𝑖 = 𝛽0 + 𝛽1 𝑂𝐾_𝑝𝑐𝑡𝑖 + 𝜀𝑖 . . . (𝑉𝐼) 𝑖𝑛𝑓𝑜𝑐ℎ𝑜𝑖𝑐𝑒𝑖 = 𝛽0 + 𝛽1 𝑖𝑑𝑒𝑛𝑡𝑖𝑡𝑦𝑖 + 𝛽2 ℎ𝑖𝑠𝑡𝑖+ 𝛽3 𝑂𝐾_𝑝𝑐𝑡𝑖+ 𝜀𝑖 . . . (𝑉𝐼𝐼)
𝑖𝑛𝑓𝑜𝑐ℎ𝑜𝑖𝑐𝑒𝑖 = 𝛽0+ 𝛽1 𝑖𝑑𝑒𝑛𝑡𝑖𝑡𝑦𝑖 + 𝛽2 ℎ𝑖𝑠𝑡𝑖 + 𝛽3 𝑂𝐾_𝑝𝑐𝑡𝑖 + 𝛽4 𝑎𝑔𝑒𝑖 + 𝛽5 𝑔𝑒𝑛𝑖
+ 𝛽6 𝑖𝑛𝑐𝑖 + 𝛽7 𝑒𝑑𝑢𝑐𝑖+ 𝜀𝑖 . . . (𝑉𝐼𝐼𝐼)
Since histi and OK_pcti predict identityi at the one-percent level of significance (as
seen in section 3.3(a)), we exclude these variables from our final model. Although geniis
also significantly correlated with identityi, we still include it in the final model as it is a
key demographic variable.
A binary logistic regression model of the following form was used as the final
model for this study to test and analyze the data:
𝑖𝑛𝑓𝑜𝑐ℎ𝑜𝑖𝑐𝑒𝑖 = 𝛽0+ 𝛽1 𝑖𝑑𝑒𝑛𝑡𝑖𝑡𝑦𝑖 + 𝛽2 𝑎𝑔𝑒𝑖+ 𝛽3 𝑔𝑒𝑛𝑖
+ 𝛽4 𝑖𝑛𝑐𝑖+ 𝛽5 𝑒𝑑𝑢𝑐𝑖 + 𝜀𝑖 . . . (𝐼𝑋)
Here, for the dependent variable infochoice, the category “Benefits of following a
gluten-free diet” was assigned a value of 1 and the combined category “Both benefits and
costs of following a gluten-free diet” was assigned a value of 0. The dependent variables
agei, geni, inci, educiand identityirepresent age, gender, household income, level of
education and whether an individual identifies as gluten-free (yes=1) for respondent i
respectively. The value and sign of the estimated coefficients (the βs) illustrate the way in
which the independent variables affect the dependent variable. The results from these
CHAPTER 3: RESULTS
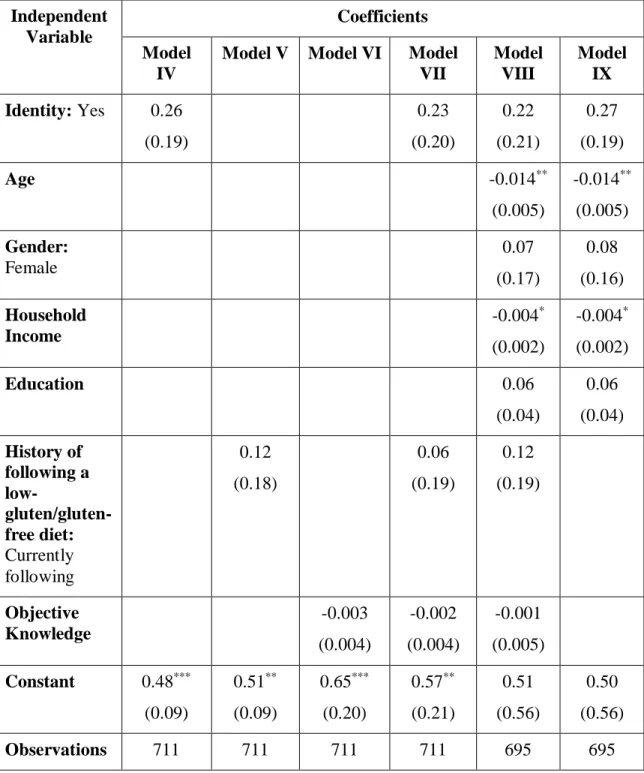
Table 3 summarizes the results for logistic regressions with infochoice as the
dependent variable. The first three regressions IV, V and VI indicate the individual
impact of identity, hist and OK_pct on the dependent variable infochoice. Out of the three
variables, identity and hist positively impact infochoice, indicating that if an individual
identifies as gluten-free (regression IV) or is currently following a
gluten-free/reduced-gluten diet (regression V), then she is more likely to read about the benefits of following
a gluten-free diet. OK_pct on the other hand negatively impacts infochoice,indicating the
more a person knows about the gluten and the gluten-free diet, the less likely he is to read
about the benefits of following a gluten-free diet. All of these three coefficients are
however not significant – which means that their impacts are equivalent to zero.
Regression VII considers the three variables altogether. The impact of each variable on
infochoice is quite stable even when controlling for the effect of the other variables.
Regression VIII looks into the impact of all the key variables considered on infochoice.
Since identity is significantly influenced by hist and OK_pct (as shown in section 2.2(a)),
we exclude them from Regression IX – which is the final model that we use for our
study.
Focusing on the results of regression IX, identity impacts infochoice positively,
although not significantly. The estimated coefficient for identity is consistent across all
the regressions. Among the demographic variables, both the coefficients for age and
of following a gluten-free diet. None of the other variables significantly impacts
infochoicei.
Table 3: Regression results models IV - IX to understand the determinants of information choice Independent Variable Coefficients Model IV
Model V Model VI Model
VII Model VIII Model IX Identity: Yes 0.26 (0.19) 0.23 (0.20) 0.22 (0.21) 0.27 (0.19) Age -0.014** (0.005) -0.014** (0.005) Gender: Female 0.07 (0.17) 0.08 (0.16) Household Income -0.004* (0.002) -0.004* (0.002) Education 0.06 (0.04) 0.06 (0.04) History of following a low- gluten/gluten-free diet: Currently following 0.12 (0.18) 0.06 (0.19) 0.12 (0.19) Objective Knowledge -0.003 (0.004) -0.002 (0.004) -0.001 (0.005) Constant 0.48*** (0.09) 0.51** (0.09) 0.65*** (0.20) 0.57** (0.21) 0.51 (0.56) 0.50 (0.56) Observations 711 711 711 711 695 695
Log
Likelihood
-466.39 -467.17 -467.23 -466.22 -451.96 -452.16
AIC 936.78 938.33 938.45 940.44 919.91 916.31
*** significant at 1 percent level of significance ** significant at 5 percent level of significance * significant at 10 percent level of significance
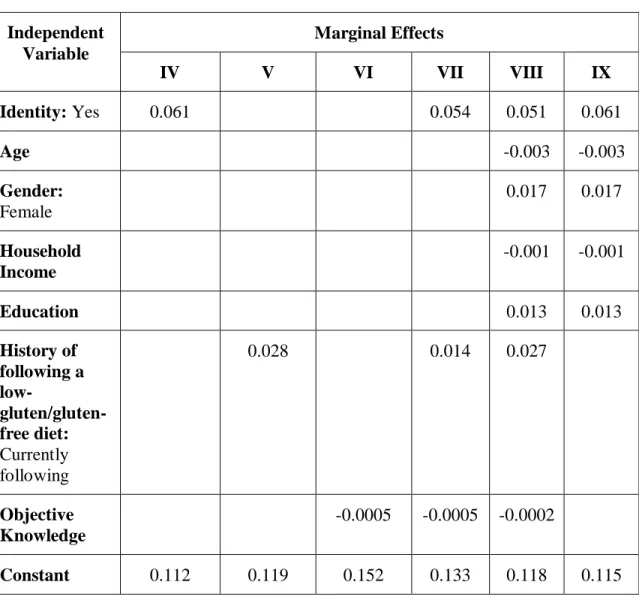
To interpret the coefficients of the regressions in terms of probabilities, we
calculated the marginal effects for all the models in Table 3, which are reported in Table
4. From the marginal effects for model IV, if an individual identifies as gluten-free, the
probability for him to opt to read about the benefits of following a gluten-free diet is
higher compared to an individual who does not identify as gluten-free by 11.2 percentage
points. For the other models, the magnitudes of the marginal effects of all the variables
are relatively small compared to identity. For the final model, the marginal effect for
identity is the highest and indicates that if a person identifies as gluten-free, they are six
percentage points more likely to choose to read the benefits of following the gluten-free
diet. Similarly, a woman is 1.7 percentage points more likely and an individual who has
one more year of education is 1.3 percentage points more likely to read about the benefits
of following the gluten-free diet. All these effects are however not significantly different.
On the other hand, with an increase in age by a year and an increase in income by a
thousand dollars, an individual is 0.3 and 0.1 percentage points less likely to read about
Table 4: Marginal Effects for regressions IV – IX to understand the determinants of information choice Independent Variable Marginal Effects IV V VI VII VIII IX Identity: Yes 0.061 0.054 0.051 0.061 Age -0.003 -0.003 Gender: Female 0.017 0.017 Household Income -0.001 -0.001 Education 0.013 0.013 History of following a low- gluten/gluten-free diet: Currently following 0.028 0.014 0.027 Objective Knowledge -0.0005 -0.0005 -0.0002 Constant 0.112 0.119 0.152 0.133 0.118 0.115
CHAPTER 4: DISCUSSION AND CONCLUSION
The results obtained from this study have interesting implications for studies
involving identity and information seeking behavior as well as for understanding human
behavior. Looking at the impact of identity on valence of information choice, the results
do not significantly support our hypothesis: an individual who identifies as gluten-free
will choose to read about the benefits of following a gluten-free diet.
An observation from this study is that among the people who identified as
gluten-free, there were people who just try to reduce their gluten-consumption and not
completely avoid it, i.e. they followed a low-gluten diet instead of a gluten-free one. We
also observed some of the people who had tried the gluten-free diet before and not
currently on it also claimed that being gluten-free is an important part of their identity.
A limitation of our study is that the definition of identity studied here includes
both medically and self-diagnosed identities of gluten-intolerance/sensitivity. We also did
not control for subjective knowledge of an individual — how knowledgeable a person
might feel he is — in our study, and this might impact the valence of information chosen
to be read by an individual. Considering all these limitations, an extension of this
research would be to see how reading various aspects of information influence
pre-existing and mistaken beliefs among consumers about the gluten-free diet. The
limitations also suggest an avenue for new research with the aim of elucidating the
factors that determine the identity of a person as gluten-free. Determining the factors
would give us an insight as to why the rules around identifying as gluten-free are flexible
References
Barbaro, M. R., Cremon, C., Stanghellini, V., & Barbara, G. (2018). Recent advances in understanding non-celiac gluten sensitivity. F1000Research, 7.
https://doi.org/10.12688/f1000research.15849.1
Bénabou, R., & Tirole, J. (2016). Mindful Economics: The Production, Consumption, and Value of Beliefs. The Journal of Economic Perspectives: A Journal of the American Economic Association, 30(3), 141–164.
Biesiekierski, J. R. (2017). What is gluten? Journal of Gastroenterology and Hepatology,
32 Suppl 1, 78–81.
Biesiekierski, J. R., Newnham, E. D., Shepherd, S. J., Muir, J. G., & Gibson, P. R. (2014). Characterization of Adults With a Self-Diagnosis of Nonceliac Gluten
Sensitivity. Nutrition in Clinical Practice: Official Publication of the American Society for Parenteral and Enteral Nutrition, 29(4), 504–509.
Choung, R. S., Unalp-Arida, A., Ruhl, C. E., Brantner, T. L., Everhart, J. E., & Murray, J. A. (2016). Less Hidden Celiac Disease But Increased Gluten Avoidance Without a
Diagnosis in the United States: Findings From the National Health and Nutrition Examination Surveys From 2009 to 2014. Mayo Clinic Proceedings. Mayo Clinic. https://doi.org/10.1016/j.mayocp.2016.10.012
Copelton, D. A., & Valle, G. (2009). “You don’t need a prescription to go gluten-free”: The scientific self-diagnosis of celiac disease. Social Science & Medicine, 69(4), 623– 631.
Dickey, W., & Kearney, N. (2006). Overweight in celiac disease: prevalence, clinical characteristics, and effect of a gluten-free diet. The American Journal of
Gastroenterology, 101(10), 2356–2359.
Dunn, C., House, L., & Shelnutt, K. P. (2014). Consumer Perceptions of Gluten-Free Products and the Healthfulness of Gluten-Free Diets. Journal of Nutrition Education and Behavior, 46(4, Supplement), S184–S185.
Garsed, K., & Scott, B. B. (2007). Can oats be taken in a gluten-free diet? A systematic review. Scandinavian Journal of Gastroenterology, 42(2), 171–178.
Haboubi, N. Y., Taylor, S., & Jones, S. (2006). Coeliac disease and oats: a systematic review. Postgraduate Medical Journal, 82(972), 672–678.
Handel, B., & Schwartzstein, J. (2018). Frictions or Mental Gaps: What’s Behind the Information We (Don't) Use and When Do We Care? The Journal of Economic Perspectives: A Journal of the American Economic Association, 32(1), 155–178.
Hart, W., Albarracín, D., Eagly, A. H., Brechan, I., Lindberg, M. J., & Merrill, L. (2009). Feeling validated versus being correct: a meta-analysis of selective exposure to
information. Psychological Bulletin, 135(4), 555–588.
Hartmann, C., Hieke, S., Taper, C., & Siegrist, M. (2018). European consumer healthiness evaluation of “Free-from” labelled food products. Food Quality and Preference, 68, 377–388.
Kabbani, T. A., Goldberg, A., Kelly, C. P., Pallav, K., Tariq, S., Peer, A., … Leffler, D. A. (2012). Body mass index and the risk of obesity in coeliac disease treated with the gluten-free diet. Alimentary Pharmacology & Therapeutics, 35(6), 723–729.
Lee, A. R., Ng, D. L., Dave, E., Ciaccio, E. J., & Green, P. H. R. (2009). The effect of substituting alternative grains in the diet on the nutritional profile of the gluten-free diet.
Journal of Human Nutrition and Dietetics: The Official Journal of the British Dietetic Association, 22(4), 359–363.
Lee, A. R., Ng, D. L., Zivin, J., & Green, P. H. R. (2007). Economic burden of a gluten-free diet. Journal of Human Nutrition and Dietetics: The Official Journal of the British Dietetic Association, 20(5), 423–430.
Missbach, B., Schwingshackl, L., Billmann, A., Mystek, A., Hickelsberger, M., Bauer, G., & König, J. (2015). Gluten-free food database: the nutritional quality and cost of packaged gluten-free foods. PeerJ, 3, e1337.
Niland, B., & Cash, B. D. (2018). Health Benefits and Adverse Effects of a Gluten-Free Diet in Non-Celiac Disease Patients. Gastroenterology & Hepatology, 14(2), 82–91.
Prada, M., Godinho, C., Rodrigues, D. L., Lopes, C., & Garrido, M. V. (2019). The impact of a gluten-free claim on the perceived healthfulness, calories, level of processing and expected taste of food products. Food Quality and Preference, 73, 284–287.
Priven, M., Baum, J., Vieira, E., Fung, T., & Herbold, N. (2015). The Influence of a Factitious Free-From Food Product Label on Consumer Perceptions of Healthfulness.
Journal of the Academy of Nutrition and Dietetics, 115(11), 1808–1814.
Nutritional Quality. Nutrients, 2(1), 16–34.
Shaw, D., & Shiu, E. (2002). The role of ethical obligation and self-identity in ethical consumer choice. International Journal of Consumer Studies, 26(2), 109–116.
Sneijder, P., & Te Molder, H. (2009). Normalizing ideological food choice and eating practices. Identity work in online discussions on veganism. Appetite, 52(3), 621–630.
Topic: Gluten-free Foods Market. (n.d.). Retrieved June 24, 2019, from
www.statista.com website: https://www.statista.com/topics/2067/gluten-free-foods-market/
Worosz, M. R., & Wilson, N. L. W. (2012). A Cautionary Tale of Purity, Labeling and Product Literacy in the Gluten-Free Market. The Journal of Consumer Affairs, 46(2), 288–318.
Xiao, N., Sharman, R., Rao, H. R., & Upadhyaya, S. (2014). Factors influencing online health information search: An empirical analysis of a national cancer-related survey.
Decision Support Systems, 57, 417–427.
Zander, K., & Hamm, U. (2012). Information search behaviour and its determinants: the case of ethical attributes of organic food. International Journal of Consumer Studies,
APPENDIX I – SURVEY QUESTIONNAIRE
DEMOGRAPHICS1. Age (Please select one)
1. Under 19 2. 19-24 3. 25-34 4. 35-44 5. 45-54 6. 55-64 7. 65 and older
8. Prefer not to answer
2. Gender (Please select one)
1. Female
2. Male
3. Prefer not to answer
3. Ethnicity (Please select all that apply)
1. White
2. Hispanic or Latino
3. Black or African American
4. Native American of American Indian 5. Asian or Pacific Islander
6. Other
7. Prefer not to answer
4. Household Income (Please select one)
1. Less than $20,000 2. $20,000 - $39,999 3. $40,000 – $59,999 4. $60,000 – $79,999 5. $80,000 – $99,999 6. $100,000 or more 7. Prefer not to answer
5. Education completed (Please select one)
1. Less than high school 2. High school/G.E.D.
3. Some college/associate degree 4. Bachelor’s degree
5. Advanced degree (M.B.A., M.D., J.D., M.S., M.A., Ph.D.) 6. Prefer not to answer
5b. Please tell us which state you currently live in. (Select one)
6a. Height ____ feet ____ inches 6b. Weight ____ pounds
SHOPPING PRACTICES
7. How frequently do you look at the following information when purchasing a food product? (Please select one per row)
Never 0 Rarely 1 Sometimes 2 Usually 3 Always 4 1. Ingredients list 2. Nutritional Information 3. Certification Logos (e.g. Organic, GMO-Free, Gluten-GMO-Free, etc.)
4. Price
8. How frequently do you consume bread, pasta, cereal, crackers, and/or bakery items?
(Please select one)
1. Never to a few times a year 2. A few times a month 3. A few times a week 4. Once a day
5. Multiple times a day
9. How often do you consume gluten-free foods that have gluten and gluten-free variants? (Please select one)
1. Never (0 percent of the time) 2. Rarely (25 percent of the time) 3. Sometimes (50 percent of the time) 4. Usually (75 percent of the time)
5. Always (100 percent of the time)
10.Think of the most recent time you consumed a gluten-free product that has a conventional (gluten-containing) counterpart. What influenced you to choose the gluten-free version rather than the conventional version? Select all that apply.
1. I am gluten sensitive
2. I have been diagnosed with Celiac Disease
3. I was advised to eat gluten-free by a health professional
4. After comparing the nutrition facts panel, the gluten-free version was healthier 5. Gluten-free products are healthier
6. The gluten-free version was cheaper 7. The gluten-free version is tastier 8. I wanted to try a new product
97.Other (please specify ______________) 98.I do not know
99.I have never consumed gluten free products.
11. A gluten-reduced product is a food product that is not free from gluten but does contain less gluten than its conventional, gluten-containing, version. Answer the following two questions based on your own opinion. Select one per row.
PERSONAL DIET HISTORY
The following questions are based on your personal diet experience. There are no right or wrong answers.
12.Select how much you agree or disagree with this statement: My eating habits are very healthy. Select one.
Yes 1 No 2 I do not know 98
1. Would you be interested in purchasing gluten-reduced products?
2. Do you think other consumers would be interested in purchasing gluten-reduced products?
1. Strongly Disagree 2. Disagree
3. Neutral
4. Agree
5. Strongly Agree
13.Have you ever tried the following diets? Please select one response per row.
Never tried
0
Not currently following, but followed in the past
1 Currently following 2 1. Pescatarian 2. Vegetarian, Vegan 3. Gluten-free diet
4. Low-gluten diet or avoid, but not completely remove, gluten
5. Low FODMAP
6. Ketogenic “Keto” diet (High fat, low carbohydrate diet)
7. Atkins diet (High protein, low carbohydrate)
8. Paleo or “caveman diet” 9. Alkaline diet
10. Military or Israeli Army diet
11. Mediterranean diet
12. Baby Food diet
14. Liquid diet including juice fasting
15. South Beach diet
16. Grapefruit “Hollywood” diet
17. DASH diet
18. Blood type diet
19. Cabbage soup diet
20. KE diet or feeding tube diet
14.<Q13 response 3 and 4 = 0>
Is there a reason you have never tried a gluten-free or low-gluten diet? Select all that apply.
1. I have never considered it
2. I do not feel a need to be on a diet 3. I have no gluten-related health concerns
4. I do not think that reducing gluten consumption is beneficial for my health 5. Gluten-free products are too expensive
6. I do not think gluten-free products taste as good as conventional (gluten-containing) versions
7. I do not want to avoid gluten
8. It is too inconvenient to avoid eating gluten 9. I do not know enough about the diet
10.I have never heard of the diet
97.Other (please specify ______________) <SKIP TO Q18>
15.<Q13 response 3 or 4 = 1 or 2>
How many times have you followed a GF/Low-Gluten diet? Please select one. <INSERT DROP DOWN WITH 1-5 AND 5+>
16.<Q13 response 3 or 4 = 1 or 2>
What was the longest period of time you followed a GF/Low-Gluten diet? Please select one.
2. More than 2 weeks - 1 month 3. More than 1 month - 3 months 4. More than 3 months - 6 months 5. More than 6 months - 1 year 6. More than 1 year
17.<Q13 response 3 or 4 = 1 or 2> How frequently do/did you knowingly consume gluten when you intend to be eating a gluten-free diet? If you are not currently on the diet but have in the past, base your answer on your most recent successful duration of the diet. This does not include accidental consumption of gluten. Please select one.
1. At least once a week
2. Once every two weeks
3. Once a month
4. Less than once every month - 6 months 5. Less than once every 6 months
6. I have never knowingly broken the diet 7. I do not recall
18.When you consume foods that contain gluten, what symptoms do you experience?
Select all that apply. <RANDOMIZE> 1. Acne or facial breakout
2. Acid Reflux
3. Abdominal pain
4. Bloating or inflammation
5. Body aching (including muscle or joint discomfort) 6. Diarrhea or constipation
7. Nausea
8. Headache or migraine 9. Brain fog
10.Fatigue or lack of energy 11.Seasonal allergies
12.Painful menstrual periods
97.Other (please specify ______________) 98.I do not recall or I do not know
99.I do not experience any symptoms
19.<IF Q18 response 98 or 99 selected skip to Q20>
A. How much of a gluten-containing food does it take for you to experience symptoms?
Select one.
1. A few crumbs of a gluten-containing food
2. A cracker size amount of a gluten-containing food 3. A bread slice amount of a gluten-containing food
4. A meal entree of a gluten-containing food
B. How severe are your symptoms when you consume that amount? Select one.
5. Very severe 6. Somewhat severe 7. Average 8. Not severe 9. Felt no change 10.I do not recall
20.<IF Q17 = 1, 2, 3, 4, 5, or 7, ask Q20, else skip to Q21>
What was the reason for consuming gluten when you intended to be avoiding gluten in your diet? Select all that apply. <RANDOMIZE>
1. I was taking a “break” from the diet
2. I occasionally treat myself to a gluten-containing product 3. There were no other food options
4. I was craving something that contained gluten 5. I did not want to cause inconvenience to others 6. Religious reasons
97.Other (please specify ______________) 99.I do not know
21.<IF Q13 row 3 or 4 = 1 ask 21, else skip to text before Q22>
What are that reasons you decided to stop avoiding gluten? Select all that apply.
<RANDOMIZE>
1. I saw no improvements after going on the diet 2. Gluten-free products were too expensive 3. I lost motivation or interest in avoiding gluten 4. I reached my health goal so I went off the diet
5. I no longer believed it was helpful for my health issues or desires 6. I felt that it was too inconvenient or too difficult to eat gluten-free 7. I felt that the diet was decreasing my health
8. I missed eating foods that contain gluten 9. I found out that I was not sensitive to gluten 97.Other (please specify ______________) 98.I do not know
BELIEF
The following questions are about your personal beliefs about gluten and gluten-free diets. There are no right or wrong answers.
22.What percent of people in the United States do you think are avoiding or eliminating gluten from their diets? Please select one.
1. Less than 1% 2. 1%-10% 3. 11%-20% 4. 21%-30% 5. 31%-40% 6. 41%-50%
7. <include a drop down menu with 51-100%> 8. I do not know
23.What percent of people in the United States do you think should be avoiding or eliminating gluten from their diets? Please select one.
1. Less than 1% 2. 1%-10% 3. 11%-20% 4. 21%-30% 5. 31%-40% 6. 41%-50%
7. <include a drop down menu with 51-100%> 8. I do not know
24.We would like to know your opinion about the following statements. Please indicate whether you agree, disagree or do not have an opinion about the statement. Please select one per row.
<RANDOMIZE> Strongly Agree 1 Agree 2 No opinion 3 Disagree 4 Strongly disagree 5
1. Wheat allergy and celiac disease are the same thing
2. The gluten-free diet is only beneficial for people suffering from celiac disease or non-celiac gluten sensitivity.
3. The gluten-free diet can prevent the development of celiac disease or non-celiac gluten sensitivity.
4. Gluten can cause diseases in non-gluten sensitive people.
5. In general, a free or gluten-reduced diet is healthier for people than a full-gluten containing diet.
6. Gluten-free products are generally more nutritious than their gluten-containing variant.
7. Gluten is only present in bread, bakery items, pasta, and crackers.
8. Occasionally there will be a survey respondent who will attempt to rush through a survey by
submitting answers without reading the questions. To help us ensure the accuracy of your survey, please select “No opinion” for this row. 9. “Wheat-free” and “gluten-free” are interchangeable terms.
10. It is deceptive for a food
company to label a food gluten-free when the original product is
naturally gluten-free.
11. Gluten should be listed as an allergen on food packages.
25.Fill in each blank below comparing whole wheat bread to gluten-free bread. Please select one per row.
1
amounts of
2
3
1. Whole wheat bread typically contains (_____) calories than gluten-free bread.
2. Whole wheat bread typically contains (_____) fat than gluten-free bread.
3. Whole wheat bread typically contains (_____) sodium than gluten-free bread.
4. Whole wheat bread typically contains (_____) fiber than gluten-free bread.
5. Whole wheat bread typically contains (_____) protein than gluten-free bread.
6. Whole wheat bread typically contains (_____) vitamins and minerals than gluten-free bread.
26.To what extent do you believe a gluten-free diet can help with the following health issues? Please select one per row.
<RANDOMIZE> Disbelieve Somewhat
Disbelieve
Neutral Somewhat Believe
Believe
1. Acne
2. Chronic stomach pain, bloating, inflammation or acid reflux
3. Chronic constipation or diarrhea
4. Bone Loss (Osteoporosis or osteopenia)
5. Fatigue or low energy
7. Celiac Disease
8. Tingling, numbness or pain in the hands and feet
(Peripheral neuropathy)
9. Seasonal allergies
10. Infertility or recurrent miscarriage
11. Painful menstrual periods
12. High cholesterol 13. Headaches, migraines, or brain fog 14. Nausea 15. Depression or anxiety 16. Cancer KNOWLEDGE
Answer the following questions to the best of your ability.
26.Please mark how much you agree with the following statements. Please select one per row. <RANDOMIZE> Strongly Disagree 5 Disagree 4 Neutral 3 Agree 2 Strongly Agree 1
“I have a lot of knowledge about nutrition.”
“I have a lot of knowledge about gluten.”
I have a lot of knowledge about grain-based products.
27.Which is the healthiest fat to consume? Please select one. <RANDOMIZE> 1. Saturated fat
2. Unsaturated Fat 3. Trans fat 4. All fat is bad 99.None of the above
28.Which is a good source of Vitamin D? Please select one. <RANDOMIZE> 1. Cheese
2. Fatty Fish 3. Vegetables 4. Liver
99.None of the above
29.What are the 3 macronutrients? Please select one. <RANDOMIZE> 1. Fat, Sugar, Protein
2. Fat, Carbohydrates, Protein 3. Fiber, Sugar, Salt
4. Vitamin A, B, C 99.None of the above
30.The American Heart Association suggests people should consume less than (____) mg of sodium in a day? Please select one.
1. 2300 mg
2. 2500 mg
3. 3500 mg
4. 5000 mg
99.None of the above
31.Which of these is not considered a nutrient? Please select one. <RANDOMIZE> 1. Vitamins
2. Minerals 3. Fiber 4. Fats
99.None of the above
32.All foods with carbohydrates contain gluten. Please select one.
1. True 2. False
33.Complete the sentence. Gluten is (____). Please select one. <RANDOMIZE> 1. a fat
2. a preservative 3. an artificial sugar 4. a protein
5. a genetically modified organism (GMO)
34.Does this product have gluten in it? Please select one per row.
<RANDOMIZE> Yes 1 No 2 I am not sure 97
Ingredients: Organic Whole Grain Wheat Flour,
Canola Oil, Salt, Sugar, Cornstarch, Maple Syrup, Natural Flavor, Vitamin E
Ingredients: Beef Broth, Beans, Rice, Tomatoes, Celery, Onion, Salt
Ingredients: Vegetable Stock, Lentils, Barley, Tomato, Carrots, Celery, Onion, Salt
Ingredients: Quinoa, Spelt, Amaranth, Peanuts, Date, Cane Sugar, Cocoa Powder
Ingredients: Buckwheat, Peanuts, Date, Cane Sugar, Cocoa Powder
35.Please choose the correct definition of celiac disease. Please select one.
<RANDOMIZE>
1. A modern disease that attacks the gastrointestinal system that arises from the consumption of genetically modified foods and the use of pesticides
2. A contagious bacterial disease similar to a cold
3. An autoimmune disorder where the gastrointestinal system becomes inflamed and damaged
4. A virus transported by animals that attacks the gastrointestinal system 97.I do not know <ANCHOR >
36.What percent of people around the world have celiac disease? Please select one.
1. Less than 1%
2. 1%-10%
4. 21%-30%
5. 31%-40%
6. 41%-50%
7. <include a drop down menu with 51-100%> 97.I do not know
37.In the United States, are there GMO wheat varieties? Please select one.
1. Yes
2. No
97.I am not sure
38.Which grain provides a complete source of protein (contains all of the essential amino acids)? Please select one. <RANDOMIZE>
1. Brown Rice
2. Oats
3. Sprouted wheat 4. Quinoa
99.None of the above
39.Whole grains help to reduce your risk of which disease? Please select one.
<RANDOMIZE> 1. Diabetes 2. Stroke
3. Heart Disease 4. Hypertension 5. All of the above
40.Which of the following is not a whole grain? Please select one. <RANDOMIZE>
1. Sprouted Wheat
2. Popcorn
3. Oats 4. Quinoa
5. All of the above <ANCHOR >
41.What nutrient is lost during the processing of refined wheat products before any enrichment or fortification is added? Please select one. <RANDOMIZE>
1. Iron 2. Vitamin D 3. Vitamin A
4. Sodium
CELIAC SOURCE/DIAGNOSIS
The following questions are about your personal health experience. There are no right or wrong answers.
42.How satisfied are you with your current health status? Please select one.
1. Not Satisfied
2. Somewhat Unsatisfied 3. Neutral
4. Somewhat Satisfied 5. Satisfied
6. Prefer not to answer
43.Do you or have you experienced any of the following health conditions? Please select all that apply. <RANDOMIZE>
1. Acne
2. Acid reflux or heartburn 3. Chronic stomach pain
4. Chronic bloating or inflammation 5. Chronic diarrhea
6. Chronic constipation
7. Bone Loss (osteoporosis or osteopenia) 8. Chronic fatigue or lack of energy 9. Unexplained iron-deficiency anemia 10.Unexplained weight gain or weight loss
11.Tingling, numbness or pain in the hands and feet (peripheral neuropathy) 12.Seasonal allergies
13.Joint (arthritis)
14.Infertility or recurrent miscarriage 15.Painful menstrual periods
16.High cholesterol
17.Recurring headaches, migraines, nausea, or brain fog 18.Depression or anxiety
19.Canker sores inside the mouth
20.Itchy skin rash (dermatitis herpetiformis) 99.None of the above <ANCHOR, EXCLUSIVE >
44.<IF 99 SELECTED IN 43, SKIP TO 45, ELSE ASK 44> How much has this condition affected your wellbeing? Please select one per row.
Severely for a long period of time 1 Severely for a short period of time 2 Moderately for a long period of time 3 Moderately for a short period of time 4 Lightly for a long period of time 5 Lightly for a short period of time 6 <INSERT SELECTIONS FOR 43>
45.<IF Q13 row 3 or 4 = 1 or 2 ask 45, else skip 46>
Did limiting or avoiding gluten help you with any of the following health issues? Please select one per row.
Yes 1 No 2 I am not sure 3 <INSERT SELECTIONS FOR 43>
46.Have you been tested for celiac disease? Please select one.
1. Yes
2. No
47. <IF 46 = 1 ASK 47, ELSE SKIP TO 48>
What was the diagnosis? Please select one.
1. Celiac disease
2. Non-celiac gluten sensitivity 3. Other
4. No condition 98.I am not sure
48.<IF 46 = 2 ASK 48, ELSE SKIP TO 49>
Is there a reason you have not been tested for celiac disease? Select all that apply.
<RANDOMIZE>
1. I am not familiar with celiac disease or non-celiac gluten-sensitivity 2. I am avoiding gluten for reasons other than celiac disease
3. I have not experienced symptoms that indicate I might have celiac disease 4. The testing would have been too expensive, time-consuming, and or invasive 5. I can determine if I feel better on a gluten-free diet without an official
diagnosis from a health professional
97.Other (please specify ______________) <ANCHOR>
98.I am not sure<ANCHOR, EXCLUSIVE >
<IF 14 = 1,2,3,4,5,6,7,8,9, or 97 OR if Q13_4 = 1 or 2 or if Q13_3 = 1 or 2 ask Q49 Else skip to Q50>
49.Where have you heard of the gluten-free diet? Select all that apply. <RANDOMIZE> 1. Healthcare center or health professional (doctor, dietitian, etc.)
2. Wellness coach, personal trainer, and or sports coach/Nutrition/Fitness shop or gym employee
3. Family member or friend
4. Blogs, video blogs, forums, social media, television talk shows 5. Published book or magazine article
6. Self (including through personal research)
97.Other (please specify ______________) <ANCHOR>
98.I do not recall <ANCHOR, EXCLUSIVE >
50.Who, if anyone, has suggested that you try a gluten-free diet? Select all that apply. <RANDOMIZE>
1. Healthcare center or health professional (doctor, dietitian, etc.)
2. Wellness coach, personal trainer, and or sports coach/Nutrition/Fitness shop or gym employee
3. Online checklist suggested I try it 4. Family member or friend
5. TV personality, blogger, video blogger, and or celebrity 6. Self (including through personal research)
97.Other (please specify ______________)
7. No one has ever suggested that I try a gluten-free diet 98.I do not recall
51. How trustworthy do you think the following sources are for diet and nutrition information? Select one per row.
Untrustworthy 1 Somewhat Untrustworthy 2 Neutral 3 Somewhat Trustworthy 4 Trustworthy 5 1. Doctors 2. Dietitians 3. Wellness coach, personal trainer, and or sports
coach/Nutrition/Fitness shop or gym employee 4. Food or health bloggers
5. Food activists 6. Family member or friend
7. Blogs, video blogs, forums, social media, television talk shows 8. Government organizations (ex. FDA, USDA) 9. Large food corporations 10. Small food corporations 11. Public research (funded by the government or a university etc.)