Corporate Ownership Around the World
RAFAEL LA PORTA, FLORENCIO LOPEZ-DE-SILANES, and ANDREI SHLEIFER*
ABSTRACT
We use data on ownership structures of large corporations in 27 wealthy economies to identify the ultimate controlling shareholders of these firms. We find that, ex-cept in economies with very good shareholder protection, relatively few of these firms are widely held, in contrast to Berle and Means’s image of ownership of the modern corporation. Rather, these firms are typically controlled by families or the State. Equity control by financial institutions is far less common. The con-trolling shareholders typically have power over firms significantly in excess of their cash f low rights, primarily through the use of pyramids and participation in management.
IN THEIR1932CLASSIC,The Modern Corporation and Private Property, Adolph
Berle and Gardiner Means call attention to the prevalence of widely held corporations in the United States, in which ownership of capital is dispersed among small shareholders, yet control is concentrated in the hands of man-agers. For at least two generations, their book has fixed the image of the modern corporation as one run by professional managers unaccountable to shareholders. The book stimulated an enormous “managerialist” literature on the objectives of such managers, including the important work of Baumol
~1959!, Marris ~1964!, Penrose ~1959!, and Williamson ~1964!, as well as Galbraith’s ~1967!popular and inf luential account. More recently, the mod-ern field of corporate finance has developed around the same image of a widely held corporation, as can be seen in the central contributions of Jensen and Meckling ~1976! or Grossman and Hart ~1980!. The Berle and Means image has clearly stuck.
In recent years, several studies have begun to question the empirical va-lidity of this image. Eisenberg ~1976!, Demsetz ~1983!, Demsetz and Lehn
~1985!, Shleifer and Vishny ~1986!, and Morck, Shleifer and Vishny ~1988! show that, even among the largest American firms, there is a modest con-centration of ownership. Holderness and Sheehan ~1988! have found in the United States several hundred publicly traded firms with majority~greater * Harvard University. We are grateful to Alexander Aganin, Carlos Berdejo-Izquierdo, David Grossman, Bernardo Lopez-Morton, Tatiana Nenova, Ekaterina Trizlova, and David Witkin for help with assembling the data, to Lucian Bebchuk, Marco Becht, Mihir Desai, Oliver Hart, Louis Kaplow, Mark Roe, Roberta Romano, René Stulz, Robert Vishny, Luigi Zingales, and two anonymous referees for advice, and to the NSF for financial support.
THE JOURNAL OF FINANCE • VOL. LIV, NO. 2 • APRIL 1999
~ !! ~ ~ !
~1994!!, Italy ~Barca ~1995!!, and seven OECD countries ~European Corpo-rate Governance Network ~1997!!. In developing economies, ownership is also heavily concentrated ~La Porta et al. ~1998!!. This research suggests that in many countries large corporations have large shareholders and, fur-ther, that these shareholders are active in corporate governance ~e.g., Kang and Shivdasani~1995!, Yafeh and Yosha~1996!!, in contrast to the Berle and Means idea that managers are unaccountable.1
As a result of this research, the Berle and Means image of the modern corporation has begun to show some wear. Still, we have relatively little systematic evidence about the ownership patterns of large publicly traded firms in different countries, and we lack a comparative perspective on the relevance of the Berle and Means description of the firm. This paper at-tempts to provide some such evidence. Specifically, we look at the ownership structures of the 20 largest publicly traded firms in each of the 27 generally richest economies, as well as of some smaller firms so that we can keep size constant across countries. We focus on the largest firms in the richest econ-omies precisely because, for these firms, the likelihood of widely dispersed ownership is the greatest—and we find that this is indeed the case. Our principal contribution is to find wherever possible the identities of the ulti-mate owners of capital and of voting rights in firms, so when shares in a firm are owned by another company, we examine the ownership of that com-pany, and so on.2For most countries, this is the only way to understand the
relationship between ownership and control. These data enable us to ad-dress, in a comparative perspective, four broad questions related to the Berle and Means thesis.
First, how common are widely held firms in different countries, as op-posed to firms that have owners with significant voting rights? Second, to the extent that firms have significant owners, who are they? Are they fam-ilies, the government, financial institutions, or other, possibly widely held, firms? How often do banks control companies—a big issue in corporate fi-nance in light of the extensive discussion of the German corporate gover-nance model? Third, how do these owners maintain their power? Do they use shares with superior voting rights that enable them to exercise control with
1There is a parallel theoretical literature on the role of large shareholders, including Shlei-fer and Vishny~1986!, Stulz~1988!, Grossman and Hart~1988!, Harris and Raviv~1988!, Be-bchuk~1994!, and Burkart, Gromb, Panunzi~1997, 1998!.
2La Porta et al.~1998!examine first level ownership of the 10 largest publicly traded firms in 49 countries, but do not look for the ultimate owners. This paper attempts to establish the identities of the ultimate owners.
only limited ownership of capital? Alternatively, do they create complicated cross-ownership patterns to reduce the threat to their control? Or do they build pyramids, whereby they control firms through a chain of companies— another form of separating ownership of capital and control? By answering these questions empirically, we hope to provide a comprehensive description of ownership patterns of large firms in rich countries.
The fourth question we address is: What explains the differences between countries in their ownership patterns? Why, for example, is the Berle and Means image of a widely held firm so much more descriptive of the United States than of Mexico or Italy? Our earlier work ~La Porta et al. ~1997, 1998!!suggests that the Berle and Means widely held corporation should be more common in countries with good legal protection of minority sharehold-ers ~which are often the rich common law countries!. In these countries, controlling shareholders have less fear of being expropriated themselves in the event that they ever lose control through a takeover or a market accu-mulation of shares by a raider, and so might be willing to cut their owner-ship of voting rights by selling shares to raise funds or to diversify. In contrast, in countries with poor protection of minority shareholders, losing control involuntarily and thus becoming a minority shareholder may be such a costly proposition in terms of surrendering the private benefits of control that the controlling shareholders would do everything to keep control. They would hold more voting rights themselves and would have less interest is selling shares in the market.3In view of this analysis, we assess the relationship between
own-ership concentration and minority shareholder protection in terms of the vot-ing rights of the principal shareholders rather than their cash f low rights.4
Relatedly, we evaluate the relationship between shareholder protection and the incidence of various control arrangements, including cross-shareholdings, differential voting rights, and pyramids. The theory in this area is not com-pletely developed, but some articles do help us think about the data. Gross-man and Hart ~1988! and Harris and Raviv ~1988! suggest that deviations from one-share one-vote should be larger when private benefits of control are higher, which must be the case in countries with poorer shareholder protection. Wolfenzon~1998!argues that pyramids should also be more com-mon in countries with poor shareholder protection, because it is easier for controlling shareholders there to make minority shareholders in existing firms pay for starting up new firms as partial subsidiaries without fully sharing with these minorities the benefits of a new venture. Pyramids and multiple classes of stock are of course two different ways of separating cash f low and control rights in firms.
3Bebchuk~1998!establishes in a formal model that dispersed ownership is unstable when private benefits of control are large because raiders would gain control of companies with dis-persed ownership at low prices and extract these benefits of control.
4The distinction between control and cash f low rights is due to Grossman and Hart~1986!. For the various ways in which the controlling shareholders can divert resources to themselves, and thereby obtain the “private benefits of control,” see Shleifer and Vishny~1997!.
from universal, and is quite rare for some definitions of control. Similarly, the so-called German model of bank control through equity is uncommon. Instead, controlling shareholders—usually the State or families—are present in most large companies. These shareholders have control rights in firms in excess of their cash f low rights, largely through the use of pyramids, but they also participate in management. The power of these controlling share-holders is evidently not checked by other large shareshare-holders. The results suggest that the theory of corporate finance relevant for most countries should focus on the incentives and opportunities of controlling shareholders to both benefit and expropriate the minority shareholders.
The next section of the paper describes our data, and presents a number of examples of ownership patterns in particular companies. Section II presents the basic results on the incidence of various ownership structures around the world. Section III concludes.
I. Data A. Construction of the Database
This paper is based on a new database of ownership structures of compa-nies from 27 countries. As we detail below, the data on corporate ownership are often difficult to assemble, and this limitation determines many of the choices we make. We generally use the richest countries based on 1993 per capita income, but exclude a number of them that do not have significant stock markets~e.g., Kuwait, United Arab Emirates, Saudi Arabia!.5For each
country, we collect two samples of firms. The first sample consists of the top 20 firms ranked by market capitalization of common equity at the end of 1995 ~with some exceptions detailed below!. This sample runs into the ob-jection that the largest companies in some countries are much larger than the largest companies in other countries. This is a particularly serious issue for a study of ownership because larger companies presumably have less concentrated ownership, and hence we should be careful that our measures of block ownership do not simply proxy for size. Accordingly, the second sam-ple collects, whenever possible, the smallest 10 firms in each country with market capitalization of common equity of at least $500 million at the end of 1995. We call the first sample “large firms” and the second sample “medium firms.” For countries with small stock markets, the two samples intersect. 5If we include the poorer countries, the incidence of family and State control would only be higher, and the prevalence of widely held firms significantly lower.
Moreover, for six countries~Argentina, Austria, Ireland, New Zealand, Greece, and Portugal! we do not have 10 publicly traded firms with capitalizations above $500 million. Overall, we have 540 large firms in the large firm sam-ple, and a total of 691 different firms ~out of a possible maximum of 810!.6
There are a few additional restrictions on these samples of companies. First, for both samples, we exclude all affiliates of foreign firms. A firm is defined as an affiliate of a foreign company if at least 50 percent of its votes are directly controlled by a single foreign corporate owner. Further, we ex-clude banks and utilities from the sample of medium firms, to prevent the domination of this sample by these two industries. Finally, by construction, neither sample includes companies that are owned either wholly privately or wholly by the government, and therefore are not listed. This restriction bi-ases our results toward finding fewer firms with significant government and family ownership than actually exist.
As a rule, our companies come from the WorldScope database. In four countries for which WorldScope coverage is limited~Argentina, Israel, Mex-ico, and the Netherlands!, we use other sources ~see the Appendix for data sources!. We generally rely on annual reports, 20-F filings for companies with American Depositary Receipts ~ADRs!, proxy statements, and, for sev-eral countries, country-specific books that detail ownership structures of their companies. We also found the Internet to be very useful because many in-dividual companies ~e.g., in Scandinavia!, as well as institutions ~e.g., the Paris Bourse and The Financial Times! have Web sites that contain infor-mation on ownership structures. Virtually all of our data are for 1995 and 1996, though for a few observations the data do come from the earlier years, and for a few from 1997. Since ownership patterns tend to be relatively stable, the fact that the ownership data do not all come from the same year is not a big problem.
For several countries, our standard procedures do not work because dis-closure is so limited. For Greece and Mexico, we cannot work with the 20 largest firms because we do not have enough ownership data. For Greece, we take the 20 largest corporations for which we could find ownership data
~mostly inBloomberg Financial Systems!. For Mexico, we take the 20 largest firms that have ADRs. For Israel, we rely almost entirely on Lexis0Nexis and Internet sources. For Korea, different sources offer conf licting informa-tion on corporate ownership structures of business groups ~chaebols!. We were advised by Korean scholars that the best source for chaebols contains information as of 1984, so we use the more stale but reliable data.
To describe control of companies, we generally look for all shareholders who control more than 10 percent of the votes. The cutoff of 10 percent is used because ~1! it provides a significant threshold of votes; and ~2! most 6Note that medium firms are, on average, larger in countries with smaller stock markets than in countries with larger stock markets because the latter countries have more firms with capitalizations just above $500 million. In the medium firm sample, therefore, the size bias is toward finding less ownership concentration in countries with poor shareholder protection.
holders in the major shareholders, and so on, until we find the ultimate controllers of the votes. In some cases, the ultimate controller is the State, a widely held financial institution, or a widely held corporation. In other cases, it is an individual or a family. We do not attempt to get inside families, and assume that every family owns and votes its shares collectively.
B. Definitions of Variables
We ask whether firms have substantial owners. We do not try to measure ownership concentration, because a theoretically appropriate measure re-quires a model of the interactions between large shareholders, which we do not have. Rather, we try to define owners in a variety of ways, summarized in Table I and discussed in this subsection. In the following subsection, we illustrate these definitions using several companies from our sample.
Our definitions of ownership rely on voting rights rather than cash f low rights. Recall that Berle and Means want to know who controls the modern corporation: shareholders or managers. We too want to know whether cor-porations have shareholders with substantial voting rights, either directly or through a chain of holdings. This idea motivates our definitions.
We divide firms into those that are widely held and those with ultimate owners. We allow for five types of ultimate owners:~1! a family or an indi-vidual,~2!the State,~3!a widely held financial institution such as a bank or an insurance company, ~4! a widely held corporation, or ~5! miscellaneous, such as a cooperative, a voting trust, or a group with no single controlling investor. State control is a separate category because it is a form of concen-trated ownership in which the State uses firms to pursue political objectives, while the public pays for the losses ~Shleifer and Vishny ~1994!!. We also give widely held corporations and widely held financial institutions separate categories as owners because it is unclear whether the firms they control should be thought of as widely held or as having an ultimate owner. A firm controlled by a widely held corporation or financial institution can be thought of either as widely held since the management of the controlling entity is not itself accountable to an ultimate owner, or as controlled by that manage-ment. For these reasons ~and because bank ownership is of independent interest!, we keep these categories separate.
As a first cut, we say that a corporation has a controlling shareholder
~ultimate owner!if this shareholder’s direct and indirect voting rights in the firm exceed 20 percent. A shareholder has x percent indirect control over firm A if ~1! it directly controls firm B, which in turn directly controls x percent of the votes in firm A; or~2!it directly controls firm C, which in turn controls firm B~or a sequence of firms leading to firm B, each of which has
control over the next one, i.e., they form a control chain!, which directly controls x percent of the votes in firm A. Table I provides a more precise definition. The idea behind using 20 percent of the votes is that this is usu-ally enough to have effective control of a firm. Indeed, below we present evidence that, in the majority of cases, our ultimate owners are also part of the management of the firm.
In the simplest case, each sample firm would have an ultimate owner of the above five types. There may, alternatively, be a legal entity that has more than 20 percent voting rights in our sample firm, which itself has a shareholder with more than 20 percent of the votes, and so on. We classify all firms that do not have such a 20 percent chain of voting rights as widely held, and firms with such a chain as having owners. On this definition, if company B has 23 percent of the votes in company A, and individual C has 19 percent of the votes in B, we still classify A as controlled by a widely held corporation~unless C has additional indirect control in A; see the discussion of Korea below!. In addition to the definition of ultimate owners using this 20 percent of votes rule, we consider a second definition that relies on a chain of more than 10 percent of voting rights.
The preceding definitions give us a reasonably conservative way to an-swer the question: Does the firm have shareholders with a substantial amount of control, or does it have ultimate owners? But this is not the only inter-esting aspect of ownership. To evaluate the potential for agency problems between ultimate owners and minority shareholders, we also want to know whether the cash f low ownership rights of the controlling shareholders are substantially different from their voting rights. One way in which the ulti-mate owners can reduce their ownership below their control rights is by using shares with superior voting rights; another way is to organize the ownership structure of the firm in a pyramid. Finally, the ultimate owners might wish to solidify their control through cross-shareholdings—having the firm own shares in its shareholdings.
We describe the role of multiple classes of shares in the simplest possible way. For each firm in the sample, we ask: What is the minimum percentage of its capital at par value that the immediate shareholder ~who might be different from the ultimate owner! needs to own to have 20 percent of the voting rights under the existing structure of share types of that firm ~as opposed to what might be allowed by law!? For example, if a firm has 50 per-cent of its capital in the form of shares that have 100 perper-cent of voting rights, and 50 percent in the form of nonvoting shares, we would say that a shareholder must own at least 10 percent of capital~in the form of the first kind of shares!to have 20 percent of the votes. Note that we are only com-puting this measure for the firms in the sample; we do not capture a devi-ation from one-share one-vote if a publicly held corporate shareholder in our sample firm itself has multiple classes of stock.
We say that a firm’s ownership structure is a pyramid~on the 20 percent definition! if: ~1! it has an ultimate owner, and ~2! there is at least one publicly traded company between it and the ultimate owner in the chain of 20 percent voting rights. Thus, if a publicly traded firm B has 43 percent of
~ !
shareholders to mail their proxy vote to the firm;~2!shareholders are not required to deposit their shares prior to a General Shareholders Meeting;~3!cumulative voting or proportional representation of minor-ities in the board of directors is allowed; ~4!an oppressed minorities mechanism is in place; ~5! the minimum percentage of share capital that entitles a shareholder to call an Extraordinary Shareholders Meet-ing is less than or equal to 10 percent; or~6!shareholders have pre-emptive rights that can only be waived by a shareholders vote. The index ranges from 0 to 6. Source: La Porta et al.~1998!.
Widely Held Equals one if the there is no controlling shareholder. To measure control we combine a shareholder’sdirect~i.e., through shares registered in her name!andindirect ~i.e., through shares held by entities that, in turn, she controls!votingrights in the firm. A shareholder has anx percent indirect controlover firm A if:~1!it controls directly firm B which, in turn, directly controls x percent of the votes in firm A; or~2!it controls directly firm C which in turn controls firm B~or a sequence of firms leading to firm B each of which has control over the next one; i.e., they form a control chain!, which, in turn, directly controls x percent of the votes in firm A. A group ofncompanies form achain of controlif each firm 1 throughn21 controls the consecutive firm. Therefore, a firm in our sample has a controlling shareholder if the sum of a shareholder’s direct and indirect voting rights exceeds an arbitrary cutoff value, which, alternatively, is 20 percent or 10 percent. When two or more sharehold-ers meet our criteria for control, we assign control to the shareholder with the largest~direct plus indirect!voting stake.
Family Equals one if a person is the controlling shareholder, and zero otherwise. State Equals one if the ~domestic or foreign! State is the controlling
share-holder, and zero otherwise. Widely Held
Financial
Equals one if a widely held financial company is the controlling share-holder, and zero otherwise.
Widely Held Corporation
Equals one if a widely held nonfinancial company is the controlling share-holder, and zero otherwise.
Miscellaneous Equals one if Widely Held, Family, State, Widely Held Financial, and Widely Held Corporation are all equal to zero, and zero otherwise. When it equals one, it includes control by pension funds, mutual funds, voting trusts, management trusts, groups, subsidiaries ~firms that, in turn, are at least 50 percent owned by the firm in the sample!, nonprofit organizations, and employees.
Cap520% V Minimum percent of the book value of common equity required to control 20 percent of the votes. Source:Moodys International.
Cross-Shhs Equals one if the firm both has a controlling shareholder~i.e., it is not widely held!and owns shares in its controlling shareholder or in a firm that belongs to her chain of control, and zero otherwise.
Pyramid Equals one if the controlling shareholder exercises control through at least one publicly traded company, and zero otherwise.
%Mkt Fam Aggregate market value of common equity of firms controlled by families divided by the aggregate market value of common equity of the 20 larg-est firms in a given country.
Table I—Continued
Variable Description
Firms0Avg Fam Number of firms among the top 20 controlled by an average family in a given country.
Management Equals one if a member of the controlling family is also the CEO, Hon-orary Chairman, Chairman, or Vice-Chairman of the Board, and zero if they do not hold any of the mentioned positions.
%Mkt WHF Aggregate market value of common equity of firms controlled by widely held financial firms divided by the aggregate market value of common equity of the 20 largest firms in a given country.
Firms0Avg WHF Number of firms among the top 20 controlled by an average widely held financial firm in a given country.
Independent Financials
Equals one when a ~widely held! financial institution controls at least 10 percent of the votes and its control chain is separate from that of the controlling owner, and zero otherwise. More precisely, the variable takes the value of one when the following three conditions are met: ~1! it controls at least 10 percent of the votes of the firm; ~2!it is not the controlling owner; and~3!its control chain does not overlap with that of the controlling owner.
Associated Financials
Equals one when a ~widely held! financial institution controls at least 10 percent of the votes and its control chain overlaps with that of the controlling owner, and zero otherwise. More precisely, equals one when a financial institution meets the following three conditions:~1!it controls at least 10 percent of the votes of the firm;~2!it is not the controlling owner; and~3!its control chain overlaps with that of the controlling owner. Controlling
Shareholder is Alone
Equals one if the firm has a 20 percent controlling owner and no other shareholder has control of at least 10 percent of the votes through a control chain that does not overlap with that of the controlling share-holder. Equals zero if the firm has a shareholder other than the con-trolling one with at least 10 percent of the votes through a control chain that does not overlap with that of the controlling shareholder. The vari-able is otherwise set to missing.
Common Law Origin
Equals one if the origin of the commercial law of a country is English Common Law, and zero otherwise. Source: Reynolds and Flores~1989!. Civil Law Origin Equals one if the origin of the commercial law is the French Commercial Code, the German Commercial Code, or if the commercial law belongs to the Scandinavian commercial-law tradition, the Scandinavian Com-mercial Code, and zero otherwise. Source: Reynolds and Flores~1989!. Strong Banks Equals one if commercial banks are allowed to own majority stakes in industrial firms and to invest at least 60 percent of their capital in a portfolio of industrial firms, and zero otherwise. Source: Institute of International Bankers~1997!.
Private Claims0 GDP
Ratio of the claims of the banking sector on the private sector to gross domestic product in 1995. Source: International Monetary Fund~1998!. Corporate
Dividends are Taxed
Equals one if corporate taxes are levied on dividends received from an investment representing at least 20 percent of the share capital of the dividend-paying corporation, and zero otherwise. Source: Price Water-house~1995!and Ernst & Young~1994!.
Consolidation for Tax Purposes
Equals one if the tax authorities permit the use of consolidated account-ing for tax purposes; that is, they allow corporations to offset the profits of one subsidiary against the losses of another. Source: Price Water-house~1995!and Ernst & Young~1994!.
the votes in a sample firm A, and an individual C has 27 percent of the votes in firm B, we would say that C controls A, and that the ownership structure is a pyramid. But if B is 100 percent owned by C, we would still call C the ultimate owner, but would not call the ownership structure a pyramid. Pyr-amids require publicly traded intermediate companies. We also use a paral-lel definition of pyramids with 10 rather than 20 percent of voting rights.
We say that there is cross-shareholding by sample firm A in its control chain if A owns any shares in its controlling shareholder or in the companies along that chain of control. So, if firm B has 20 percent of the votes in A, a publicly held firm C owns 20 percent of the votes in B, and A owns two percent of the votes in C, we would say that C is the ultimate owner of A, that A is owned through a pyramid, and that there is a cross-shareholding by A. On the other hand, if, instead of A owning 2 percent in C, it were the case that B owned two percent in C, we would not call this a cross-shareholding by A because B is not a f irm in our sample. We do not look for cross-shareholdings by firm A in firms outside its control chain because of data limitations.
We use some further measures of ownership which are summarized in Table I, but introduce them later as we present our findings in Section II. First, we present some examples.
C. Examples of Ownership Structures
To describe the database and to illustrate our variables, we present sev-eral cases of ownership structures of individual companies, in roughly in-creasing order of complexity.
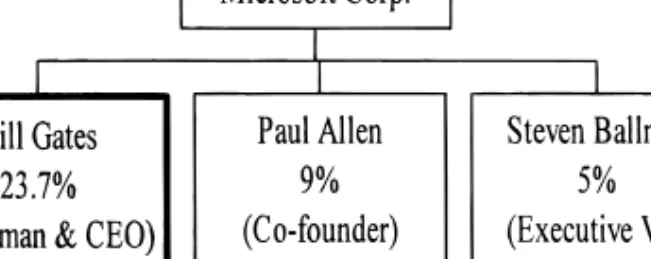
Begin with the United States. The three most valuable firms in the United States at the end of 1995, General Electric, AT&T, and Exxon, are all widely held. The fourth most valuable, Microsoft, has three large shareholders~ Fig-ure 1!: the cofounders Bill Gates ~with 23.7 percent of the votes as well as shares! and Paul Allen ~with nine percent!, and Steven Ballmer ~with five percent!. We say that Microsoft has an ultimate owner on the 20 percent~as GDP per Capita Gross domestic product per capita in dollars in 1995. Source: World Bank
~1997!. Corruption
Index
Transparency International’s corruption perception index for 1996. Aver-age of up to 10 independent surveys on businessmen’s perception of the degree of corruption in a given country. Scale from 1 to 10, with lower scores for higher levels of corruption. Source: Transparency International~1996!.
well as on the 10 percent! definition, namely Bill Gates, and is a family-owned firm. It is obviously not a pyramid, does not have cross-shareholdings, and it takes 20 percent of the capital to amass 20 percent of the votes.
The fourth most valuable company in Canada is Barrick Gold, and it has a more complex ownership structure~Figure 2!. Its founder, Chairman, and CEO is Peter Munk, who is also Chairman and CEO of a holding company called Horsham, that owns 16.3 percent of votes and capital in Barrick Gold. Munk controls the publicly traded Horsham with 79.7 percent of its votes, but only 7.3 percent of capital. Even though Munk evidently controls Bar-rick, we say that Barrick Gold is widely held on the 20 percent definition of control because Horsham only has 16.3 percent of the votes. On the 10 per-cent definition, Barrick Gold has an ultimate owner, a family. Since Hor-sham is publicly traded, we call Barrick’s ownership structure a pyramid on the 10 percent but not the 20 percent definition. Finally, even though Hor-sham has multiple classes of stock, it takes 20 percent of Barrick’s capital to have 20 percent of the votes, and so the company has a one-share0one-vote structure.7
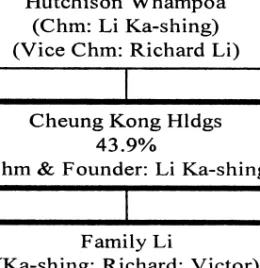
The next example is Hutchison Whampoa, the third most valuable com-pany in Hong Kong~Figure 3!. It is 43.9 percent controlled by Cheung Kong Holdings, which happens to be the fifth largest publicly traded company in Hong Kong and is therefore also in our sample. In turn, the Li Ka-Shing family owns 35 percent of Cheung Kong. Hutchison Whampoa and Cheung Kong are thus both family controlled companies, except the former is owned through a pyramid but the latter is not. Note that the Li Ka-Shing family controls three of the 20 largest companies in Hong Kong ~also the eleventh-largest Hong Kong Electric Holdings!, a number that we keep track of.
7Tufano~1996!shows that, among gold-mining firms in North America, those with higher management ownership do more hedging of gold prices. This result is consistent with the dom-inance of the controlling shareholders’ motives rather than minority shareholders’ motives in the hedging decisions because costly hedging is more attractive to the undiversified controlling shareholders than to the diversified minority shareholders.
Figure 1. Microsoft Corporation (USA).The principal shareholders of Microsoft~the fourth largest company in the United States!are shown. All shares carry one vote. Under the 20 per-cent rule, we assign control to Bill Gates and represent his control chain with a thick bordered box.
After the State-controlled NT&T, Toyota Motor is the most valuable com-pany in Japan ~Figure 4!. Toyota has several nontrivial shareholders, but none of them is very large. Four of these shareholders~Sakura Bank, Mitsui Fire and Marine, Mitsui T&B, and Mitsui Life!are part of the Mitsui Group and together control 12.1 percent of both capital and votes in Toyota. This is a common situation in Japan, and we say that Toyota is widely held on the 20 percent definition, but “miscellaneous” on the 10 percent definition, be-cause that is where we put business groups as well as voting trusts. There are no pyramids or deviations from one-share one-vote here, but Toyota has cross-shareholdings in firms in the Mitsui Group.8
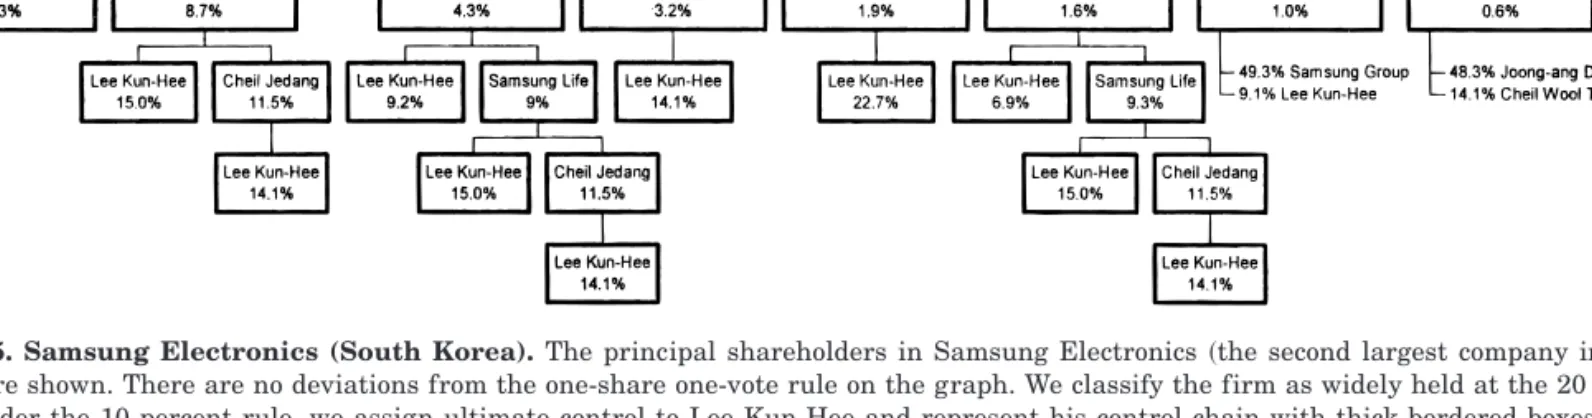
Ownership in Japanese companies is straightforward relative to that in Korean ones, as the example of Korea’s second largest firm, Samsung Elec-tronics ~Figure 5!, illustrates. Lee Kun-Hee, the son of Samsung’s founder, controls 8.3 percent of Samsung Electronics directly. But he also controls 15 percent of Samsung Life, which controls 8.7 percent of Samsung Electronics, as well as 14.1 percent of Cheil Jedang, which controls 3.2 percent of Sam-sung Electronics directly and 11.5 percent of SamSam-sung Life. Lee Kun-Hee has additional indirect stakes in Samsung Electronics as well. Because there are no 20 percent ownership chains, we call Samsung Electronics widely held on the 20 percent definition. But we classify it as a family-controlled firm on the 10 percent definition because the total of Lee Kun-Hee’s direct 8Because Toyota does not have a controlling shareholder, and because we only report cross-shareholdings by the sample firms in the firms in their control chains, Toyota and similar Japanese firms would not appear in Table IV as having cross-shareholdings.
Figure 2. Barrick Gold (Canada). The principal shareholders of Barrick Gold ~the fourth largest company in Canada!are shown. All shares in Barrick Gold, but not in Horsham Cor-poration, carry one vote. Ownership stakes are denoted with “C” and voting stakes with “V.” We classify the firm as widely held at the 20 percent level. Under the 10 percent rule, we assign ultimate control to Peter Munk and represent his control chain with thick-bordered boxes.
holdings and his holdings in Samsung Life is more than 10 percent of the votes in Samsung Electronics. It is also controlled through a pyramid on that definition because, for example, Samsung Life is publicly traded.
Finally, to illustrate the really complicated cases, we consider the owner-ship structure of five companies from Continental Europe. We begin with Germany, where the most valuable company is Allianz Insurance~Figure 6!. Allianz is a one-share one-vote company with several large shareholders, of whom the largest, with a 25 percent stake, is Munich Reinsurance, the third most valuable company in Germany. However, Allianz has cross-shareholdings in most of its large shareholders, including a 25 percent stake in Munich Reinsurance~Allianz also has a 22.5 percent stake in Dresdner Bank, which has a 10 percent stake in Munich Reinsurance!. Allianz presents a difficult case: One could argue that it is widely held because it controls its controlling shareholder, that it is controlled by a widely held financial institution, or that it belongs in the “miscellaneous” category. We allocate it to the first category, while ~happily! recognizing that there are only four such contro-versial cases in the sample, including Munich Reinsurance itself.
The fourth largest company in Germany is Daimler Benz ~Figure 7!. It is 24.4 percent owned by Deutsche Bank, so its ultimate owner is a widely held financial institution ~the largest shareholder in Deutsche Bank is Allianz, with five percent!. Other shareholders of Daimler Benz form an enormous pyramid, but we do not call its ownership structure a pyramid because it does not involve publicly traded firms in the control chain and does not lead to the ultimate owner. Although there are other greater than 10 percent Figure 3. Hutchison Whampoa Ltd. (Hong Kong).The principal shareholders are shown for Hutchison Whampoa Ltd.~the third largest company in Hong Kong!. All shares in Hutch-ison Whampoa and Cheung Kong Holdings carry one vote. Under the 20 percent rule, we assign ultimate control to the Li family and represent their control chain with thick-bordered boxes.
shareholders and chains of shareholders in Daimler Benz, for the purposes of most of our analysis we look only at the largest shareholder, namely Deutsche Bank. Also, by looking only at the banks’ own equity ownership, we ignore the voting arrangements that enable Deutsche Bank and other Ger-man banks to vote the shares they hold in custody for their brokerage cli-ents, thereby biasing our results in favor of Berle and Means.
The fourth most valuable company in Sweden is ABB~Figure 8!. Like five of the top 10 most valuable companies in Sweden, ABB is controlled by the Wallenberg family, characteristically through a pyramid of companies that have shares with differential cash f low and voting rights. Incentive, the 17th most valuable company in Sweden, owns 24.3 percent of capital and has 32.8 percent of the votes in ABB. The Wallenberg Group owns 32.8 per-cent of the capital, but has 43.1 perper-cent of the votes in Inper-centive. The Wal-lenberg Group is a voting arrangement controlled by Investor ~which has 35.7 percent of the Group’s total of 43 percent of the votes in Incentive!. Investor is the fifth most valuable company in Sweden, controlled by the Wallenberg Group with 41.2 percent of the votes. Here we have family con-trol, pyramids, and deviations from one-share one-vote.
ABB is a good company to illustrate how we measure the extent of devi-ations from one-share one-vote. The company has 24,345,619 shares with 0.1 votes per share and a par value of 50 SEK, as well as 66,819,757 shares with one vote per share and a par value of 5 SEK. Here the cheapest way to buy a 20 percent voting stake is to acquire the second kind of shares only. The number of required votes is 13,850,865 5 0.2 * ~24,345,619 * 0.1 1 66,819,757!, and each of these votes costs 5 SEK at par value. The par value of the firm is SEK 1,551 billion. Therefore, the cost of buying the required votes as a percentage of the total book value of the firm’s capital is Figure 4. Toyota Motor (Japan).The principal shareholders are shown for Toyota Motor~the second largest company in Japan!. All shares carry one vote. Members of the Mitsui group ~Sakura Bank, Mitsui F&M, Mitsui T&B, and Mitsui M. Life Ins.!hold 12.1 percent of Toyota’s shares. Therefore, under the 10 percent rule, we assign ultimate control to the Mitsui Group and represent its control chain with a thick bordered box. In turn, Toyota Motors owns shares in members of the Mitsui Group~i.e., there are cross-shareholdings!. For example, Toyota Motor owns 2.4 percent of the shares of Sakura Bank. Cross-shareholdings are denoted with “CS”.
Figure 5. Samsung Electronics (South Korea). The principal shareholders in Samsung Electronics~the second largest company in South Korea!are shown. There are no deviations from the one-share one-vote rule on the graph. We classify the firm as widely held at the 20 percent level. Under the 10 percent rule, we assign ultimate control to Lee Kun-Hee and represent his control chain with thick-bordered boxes.
Corporate Ownership Around the W orld 485
~SEK 5* 13,850,864!0~SEK 1,551 billion!54.46 percent. To acquire 20 per-cent of the votes in ABB, one can buy only 4.46 perper-cent of the capital, a sharp deviation from one-share one-vote.
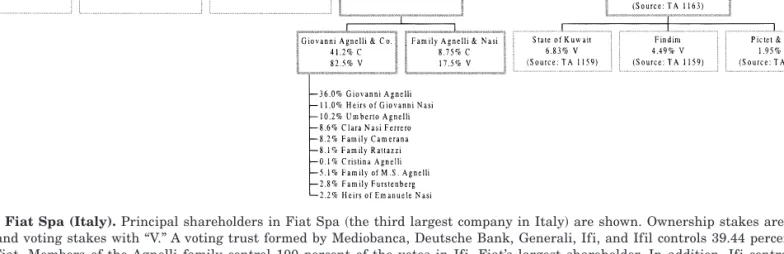
The third most valuable company in Italy is Fiat ~Figure 9!. Many of its shares are controlled by a voting trust, of which the most important member is Ifi, with 14.8 percent of the capital and 22.3 percent of the votes. Another large shareholder is Ifil, with 6.1 percent of the capital and 9.2 percent of the votes. Ifi is controlled by Giovanni Agnelli and his family, who have 41.2 plus 8.75, or 49.95, percent of the capital and 100 percent of the votes. Ifi also controls Ifil with 26.5 percent of the capital and 52.25 percent of the votes. Here we have family control through pyramids and voting trusts, though no evident cross-shareholdings by Fiat. The majority of Fiat’s shares are ordinary, but there are a few savings shares with no voting rights. As a consequence, one can control 20 percent of Fiat’s votes with 15.47 percent of its capital.
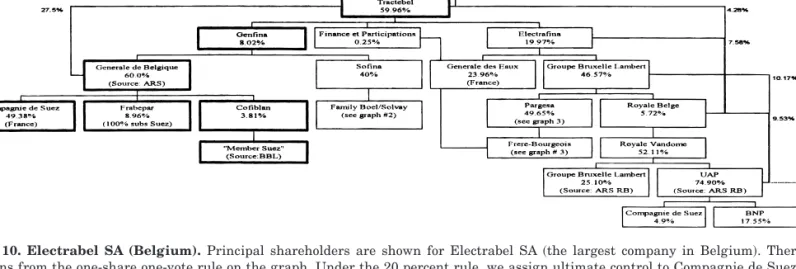
The last, and possibly most complicated, example we present is Electrabel, the largest listed company in Belgium ~Figure 10!. Fortunately, voting and cash f low rights are the same here. One can see that 26.34 percent of Elec-trabel is controlled by Powerfin, the eleventh largest company in Belgium. In turn, 60 percent of Powerfin is owned by Tractebel, which is the third largest company in Belgium, and which also controls 16.2 percent of Elec-trabel directly. But who owns Tractebel? The Belgian bank, Générale de Bel-gique, owns 27.5 percent of the company directly, and also controls 8.02 percent of the votes held by Genfina. Générale de Belgique does not itself enter the Belgian sample because it is 49.4 percent owned by a French bank, Compagnie de Suez, and hence is defined to be a foreign affiliate. Thus, through this pyramid, Electrabel is controlled by a widely held finan-cial institution. Tractebel, however, has an additional significant set of own-ers. Actually, 20 percent of its shares are owned by Electrafina, the twelfth largest company in Belgium. Electrafina, in turn, is controlled with a 46.6 per-cent stake by Groupe Bruxelle Lambert, a holding company that is the ninth largest in Belgium. Groupe Bruxelle Lambert is in turn controlled with Figure 6. Allianz Holding (Germany).Principal shareholders of Allianz Holdings~the larg-est company in Germany!are shown. There are no deviations from the one-share one-vote rule on the graph. Allianz and Munchener Ruckversicherung own 25 percent of the shares of each other. Allianz also owns 22.5 percent of Dresdner Bank, which in turn owns 9.99 percent in Munchener Ruckversicherung. We classify Allianz as widely held since it, arguably, controls its largest shareholder.
Figure 7. Daimler Benz (Germany). The principal shareholders are shown for Daimler Benz ~the fourth largest company in Germany!. Ownership stakes are denoted with “C” and voting stakes with “V.” Under the 20 percent rule, we assign ultimate control to Deutsche Bank and represent its control chain with a thick-bordered box.
Corporate Ownership Around the W orld 487
Figure 8. ABB AB (Sweden).The principal shareholders in ABB AB~the fourth largest company in Sweden!are shown. Ownership stakes are denoted with “C” and voting stakes with “V.” Under the 20 percent rule, we assign ultimate control to the Wallenberg family and indicate its control chain with thick-bordered boxes.
The
Journal
of
Figure 9. Fiat Spa (Italy).Principal shareholders in Fiat Spa~the third largest company in Italy!are shown. Ownership stakes are denoted with “C” and voting stakes with “V.” A voting trust formed by Mediobanca, Deutsche Bank, Generali, Ifi, and Ifil controls 39.44 percent of the votes in Fiat. Members of the Agnelli family control 100 percent of the votes in Ifi, Fiat’s largest shareholder. In addition, Ifi controls 52.25 percent of the votes in Ifil, Fiat’s second largest shareholder. Therefore, we assign ultimate control ~under the 20 percent rule!to the Agnelli family and indicate its control chain with thick-bordered boxes.
Corporate Ownership Around the W orld 489
Figure 10. Electrabel SA (Belgium). Principal shareholders are shown for Electrabel SA~the largest company in Belgium!. There are no deviations from the one-share one-vote rule on the graph. Under the 20 percent rule, we assign ultimate control to Compagnie de Suez because it is the largest shareholder in Tractebel. In turn, Tractebel owns directly 16.2 percent of Electrabel and controls Powerfin’s 26.34 percent stake by virtue of its 59.96 percent investment in Powerfin. We represent Suez’s control chain with thick-bordered boxes.
The
Journal
of
49.7 percent by Pargesa, a Swiss-listed holding controlled by the Belgian Frere family. Thus the Freres can also be viewed as the owners of Electrabel, except that we count only the largest ultimate owner, and hence Electrabel goes to Compagnie de Suez. There are many other relationships between the various companies in these pyramids, which are presented in Figure 10. Electrabel offers a good reason to look only at the largest shareholders rather than measure ownership concentration.
The preceding examples are not intended to prejudge the reader’s opinion as to the relative frequency of widely held versus owner-controlled firms, but rather to show how complicated ownership structures can be, and to illustrate our biases toward classifying firms as widely held. In the next section, we abstract from the many subtleties of ownership and present the simple statistics on the relative frequency of different arrangements.
II. Results A. Who Owns Firms?
Tables II and III present the basic information from our sample on who the ultimate owners of firms are in different countries. We divide the 27 countries in the sample into 12 with better than median shareholder pro-tection using the scores from La Porta et al. ~1998! ~four and five!, and 15 with median and worse than median protection ~zero, one, two, and three!. These scores aggregate a number of legal shareholder protections used in different countries~Table I!. The good protection subsample is dominated by common law countries, and the bad protection subsample by civil law coun-tries. We describe average ownership patterns for each country, and then compare average patterns for the world~meaning the 27 rich countries!, the good protection countries, and the bad protection countries. We have two tables because we do each calculation for the large and the medium firm samples.
Within each country, for a given sample and a given definition of control, we classify every firm following the rules described in the previous section as one of six types: widely held, family-controlled, State-controlled, con-trolled by a widely held financial institution, concon-trolled by a widely held corporation, or miscellaneous. We then compute and report the frequency of each type of firm in each country, and take appropriate averages. Thet-tests comparing groups of countries treat each country’s average as one observation. Table II, Panel A, shows that, for the sample of large firms, and using the 20 percent definition of control, 36 percent of the firms in the world are widely held, 30 percent are family-controlled, 18 percent are State-controlled, and the remaining 15 percent are divided between the residual categories. To us, the fact that only slightly more than one-third of the firms in the richest countries, selected for their large size and using the stiff 20 percent chain definition of control, are widely held suggests that the image of the Berle and Means corporation as the dominant ownership structure in the world is misleading. It is true that, on this definition, all 20 firms in the United
~by stock market capitalization of equity at the end of 1995!in 27 countries.~Definitions for each of the variables are given in Table I.!This table also reports tests of means for countries above and below the median antidirector rights.
Panel A: 20% Cutoff
Country
Widely
Held Family State
Widely Held Financial Widely Held Corporation Miscellaneous Argentina 0.00 0.65 0.15 0.05 0.15 0.00 Australia 0.65 0.05 0.05 0.00 0.25 0.00 Canada 0.60 0.25 0.00 0.00 0.15 0.00 Hong Kong 0.10 0.70 0.05 0.05 0.00 0.10 Ireland 0.65 0.10 0.00 0.00 0.10 0.15 Japan 0.90 0.05 0.05 0.00 0.00 0.00 New Zealand 0.30 0.25 0.25 0.00 0.20 0.00 Norway 0.25 0.25 0.35 0.05 0.00 0.10 Singapore 0.15 0.30 0.45 0.05 0.05 0.00 Spain 0.35 0.15 0.30 0.10 0.10 0.00 U.K. 1.00 0.00 0.00 0.00 0.00 0.00 United States 0.80 0.20 0.00 0.00 0.00 0.00
High antidirector avg. 0.4792 0.2458 0.1375 0.0250 0.0833 0.0292
Austria 0.05 0.15 0.70 0.00 0.00 0.10 Belgium 0.05 0.50 0.05 0.30 0.00 0.10 Denmark 0.40 0.35 0.15 0.00 0.00 0.10 Finland 0.35 0.10 0.35 0.05 0.05 0.10 France 0.60 0.20 0.15 0.05 0.00 0.00 Germany 0.50 0.10 0.25 0.15 0.00 0.00 Greece 0.10 0.50 0.30 0.10 0.00 0.00 Israel 0.05 0.50 0.40 0.00 0.05 0.00 Italy 0.20 0.15 0.40 0.05 0.10 0.10 South Korea 0.55 0.20 0.15 0.00 0.05 0.05 Mexico 0.00 1.00 0.00 0.00 0.00 0.00 Netherlands 0.30 0.20 0.05 0.00 0.10 0.35 Portugal 0.10 0.45 0.25 0.15 0.00 0.05 Sweden 0.25 0.45 0.10 0.15 0.00 0.05 Switzerland 0.60 0.30 0.00 0.05 0.00 0.05
Low antidirector avg. 0.2733 0.3433 0.2200 0.0700 0.0233 0.0700
Sample average 0.3648 0.3000 0.1833 0.0500 0.0500 0.0519
Test of Means~t-statistic! Low vs. high
antidirector
Kingdom, 18 out of 20 in Japan, and 16 out of 20 in the United States fit the widely held description. Still, in Argentina, Greece, Austria, Hong Kong, Portugal, Israel, or Belgium, there are hardly any widely held firms in this
Table II—Continued Panel B: 10% Cutoff
Country
Widely
Held Family State
Widely Held Financial Widely Held Corporation Miscellaneous Argentina 0.00 0.65 0.20 0.10 0.05 0.00 Australia 0.55 0.10 0.05 0.05 0.25 0.00 Canada 0.50 0.30 0.00 0.00 0.15 0.05 Hong Kong 0.10 0.70 0.05 0.05 0.00 0.10 Ireland 0.45 0.15 0.00 0.05 0.05 0.30 Japan 0.50 0.10 0.05 0.00 0.00 0.35 New Zealand 0.05 0.45 0.25 0.05 0.20 0.00 Norway 0.05 0.25 0.40 0.10 0.00 0.20 Singapore 0.05 0.45 0.45 0.00 0.00 0.05 Spain 0.15 0.25 0.45 0.15 0.00 0.00 U.K. 0.90 0.05 0.00 0.05 0.00 0.00 United States 0.80 0.20 0.00 0.00 0.00 0.00
High antidirect. avg. 0.3417 0.3042 0.1583 0.0500 0.0583 0.0875
Austria 0.05 0.15 0.70 0.00 0.00 0.10 Belgium 0.00 0.50 0.05 0.35 0.00 0.10 Denmark 0.10 0.35 0.20 0.05 0.00 0.30 Finland 0.15 0.10 0.35 0.25 0.00 0.15 France 0.30 0.20 0.20 0.20 0.10 0.00 Germany 0.35 0.10 0.30 0.25 0.00 0.00 Greece 0.05 0.65 0.30 0.00 0.00 0.00 Israel 0.05 0.50 0.40 0.00 0.05 0.00 Italy 0.15 0.20 0.50 0.00 0.00 0.15 South Korea 0.40 0.35 0.15 0.00 0.05 0.05 Mexico 0.00 1.00 0.00 0.00 0.00 0.00 Netherlands 0.30 0.20 0.05 0.00 0.10 0.35 Portugal 0.00 0.50 0.25 0.20 0.00 0.05 Sweden 0.00 0.55 0.10 0.30 0.00 0.05 Switzerland 0.50 0.40 0.00 0.05 0.00 0.05
Low antidirector avg. 0.1600 0.3833 0.2367 0.1100 0.0200 0.0900
Sample average 0.2407 0.3481 0.2019 0.0833 0.0370 0.0889
Test of Means~t-statistic! Low vs. high
antidirector
21.92 0.88 1.05 1.50 21.50 0.06
market capitalization of common equity at the end of December of 1995 of at least $500 million or higher in 27 countries.~Definitions for each of the variables are given in Table I.!This table also reports tests of means for countries above and below the median antidirector rights.
Panel A: 20% Cutoff
Country
Widely
Held Family State
Widely Held Financial Widely Held Corporation Miscellaneous Argentina 0.00 0.80 0.20 0.00 0.00 0.00 Australia 0.30 0.50 0.00 0.00 0.20 0.00 Canada 0.60 0.30 0.10 0.00 0.00 0.00 Hong Kong 0.00 0.90 0.00 0.00 0.00 0.10 Ireland 0.63 0.13 0.00 0.00 0.13 0.13 Japan 0.30 0.10 0.00 0.00 0.00 0.60 New Zealand 0.57 0.29 0.14 0.00 0.00 0.00 Norway 0.20 0.40 0.20 0.10 0.00 0.10 Singapore 0.40 0.40 0.20 0.00 0.00 0.00 Spain 0.00 0.30 0.20 0.40 0.10 0.00 U.K. 0.60 0.40 0.00 0.00 0.00 0.00 United States 0.90 0.10 0.00 0.00 0.00 0.00
High antidirector avg. 0.3750 0.3850 0.0867 0.0417 0.0358 0.0775
Austria 0.00 0.17 0.83 0.00 0.00 0.00 Belgium 0.20 0.40 0.30 0.10 0.00 0.00 Denmark 0.30 0.40 0.20 0.00 0.00 0.10 Finland 0.20 0.20 0.20 0.10 0.10 0.20 France 0.00 0.50 0.20 0.20 0.00 0.10 Germany 0.10 0.40 0.20 0.20 0.10 0.00 Greece 0.00 1.00 0.00 0.00 0.00 0.00 Israel 0.10 0.60 0.30 0.00 0.00 0.00 Italy 0.00 0.60 0.00 0.00 0.10 0.30 South Korea 0.30 0.50 0.00 0.00 0.20 0.00 Mexico 0.00 1.00 0.00 0.00 0.00 0.00 Netherlands 0.10 0.20 0.10 0.00 0.10 0.50 Portugal 0.00 0.50 0.50 0.00 0.00 0.00 Sweden 0.10 0.60 0.20 0.00 0.00 0.10 Switzerland 0.50 0.50 0.00 0.00 0.00 0.00
Low antidirector avg. 0.1267 0.5047 0.2020 0.0400 0.0400 0.0867
Sample average 0.2370 0.4515 0.1507 0.0407 0.0381 0.0826
Test of Means~t-statistic! Low vs. high
antidirector
sample and on this definition. A critic might remark that most of the value of the world stock market is in the United States, United Kingdom, Japan, and other countries with Berle and Means firms, so who cares about Argen-tina or Austria? We care because to understand corporate governance in
Table III—Continued Panel B: 10% Cutoff
Country
Widely
Held Family State
Widely Held Financial Widely Held Corporation Miscellaneous Argentina 0.00 0.80 0.20 0.00 0.00 0.00 Australia 0.10 0.50 0.00 0.10 0.20 0.10 Canada 0.40 0.50 0.10 0.00 0.00 0.00 Hong Kong 0.00 0.90 0.00 0.00 0.00 0.10 Ireland 0.50 0.25 0.00 0.00 0.00 0.25 Japan 0.20 0.10 0.00 0.00 0.00 0.70 New Zealand 0.00 0.86 0.14 0.00 0.00 0.00 Norway 0.10 0.40 0.20 0.10 0.00 0.20 Singapore 0.10 0.60 0.30 0.00 0.00 0.00 Spain 0.00 0.30 0.30 0.40 0.00 0.00 U.K. 0.10 0.60 0.00 0.10 0.00 0.20 United States 0.50 0.30 0.00 0.00 0.00 0.20
High antidirector avg. 0.1667 0.5092 0.1033 0.0583 0.0167 0.1458
Austria 0.00 0.17 0.83 0.00 0.00 0.00 Belgium 0.10 0.40 0.30 0.20 0.00 0.00 Denmark 0.00 0.40 0.20 0.00 0.00 0.40 Finland 0.00 0.20 0.20 0.20 0.10 0.30 France 0.00 0.50 0.20 0.20 0.00 0.10 Germany 0.10 0.40 0.20 0.30 0.00 0.00 Greece 0.00 1.00 0.00 0.00 0.00 0.00 Israel 0.10 0.60 0.30 0.00 0.00 0.00 Italy 0.00 0.80 0.10 0.00 0.00 0.10 South Korea 0.00 0.80 0.00 0.00 0.20 0.00 Mexico 0.00 1.00 0.00 0.00 0.00 0.00 Netherlands 0.10 0.20 0.10 0.00 0.10 0.50 Portugal 0.00 0.50 0.50 0.00 0.00 0.00 Sweden 0.10 0.60 0.20 0.10 0.00 0.00 Switzerland 0.40 0.50 0.00 0.00 0.00 0.10
Low antidirector avg. 0.0600 0.5380 0.2087 0.0667 0.0267 0.1000
Sample average 0.1074 0.5252 0.1619 0.0630 0.0222 0.1204
Test of Means~t-statistic! Low vs. high
antidirector
21.83 0.28 1.47 0.20 0.44 20.65
this sample is not surprising given that we are sampling the largest firms, and privatization is not finished in most countries. Still, the fact that 70 percent of the largest traded firms in Austria, 45 percent in Singapore, and 40 percent in Israel and Italy are State-controlled is a reminder of massive post-war State ownership around the world. Indeed, the magnitude of State ownership among the largest companies would be even higher if we included firms that are entirely State owned, and hence do not trade publicly. It is perhaps more surprising that by far the dominant form of controlling own-ership in the world is not that by banks and other corporations, but rather by families.
A comparison of countries with good and poor shareholder protection shows that widely held firms are more common in countries with good protection: 48 percent versus 27 percent. This difference is statistically significant ~t5
21.95!. Countries with poor shareholder protection have more of most other types of firms, including family-controlled: 34 versus 25 percent ~t 51.09!, and State-controlled: 22 versus 14 percent~t51.20!. Interestingly, firms in countries with good protection are more commonly controlled by a widely held corporation: eight percent versus two percent~t5 22.38!. These results suggest that dispersion of ownership goes together with good shareholder protection, which enables controlling shareholders to divest at attractive prices. Table II, Panel B, presents the results for the sample of large firms using the 10 percent chain definition of control. Under this definition, only 24 per-cent of the large companies in rich countries are widely held, compared to 35 percent that are family-controlled, 20 percent are State-controlled, and 21 percent are in the three residual categories. We stress that using the 10 percent control chain to define control is not incredibly tough on the Berle and Means thesis; many people would consider 10 percent ownership of a U.S. firm to be sufficient for control. Indeed, 90 percent of the large U.K. firms, 80 percent of the large U.S. firms, and 50 percent of the large Japanese firms remain widely held.9 Still, in the rich world as a whole,
dispersed ownership is rare on this definition.
One finding shown in Panel B is that many Japanese firms shift into the miscellaneous category because, like Toyota, they are controlled by groups with no dominant members. Individual members of these groups hold very
9Some seminar participants have argued that the larger the firm, the smaller the percent-age of equity needed to control it. If that were the case, many of the firms in the United States, Japan, and the United Kingdom that we designate as widely held would also have controlling shareholders, further diminishing the Berle and Means category. Our sample of medium firms, which holds size roughly constant across countries, addresses this point as well.
small equity stakes in sample companies, and even groups as a whole often have stakes of 10 to 20 percent. In this respect, the Japanese model of own-ership seems to be closer to that in other countries with good shareholder protection, like the United States or the United Kingdom, than it is to the continental European model. Specifically, most shares in Japanese firms are owned by small individual shareholders and relatively small corporate share-holders~French and Poterba ~1991!!, there are few controlling shareholders per se, and even the groups have a relatively small share of the total votes. Of course, the groups may have control in excess of their voting rights be-cause of lending and supply arrangements.
A comparison of countries with good and poor shareholder protection shows that widely held firms remain more common in the former: 34 percent ver-sus only 16 percent in countries with poor shareholder protection~t5 21.92!. The latter countries have relatively more firms with ultimate owners in al-most all categories: family, the State, and financial institutions, though the differences are not statistically significant. The bottom line is that the larg-est firms typically have ultimate owners, particularly in countries with poor shareholder protection.
What about the medium-sized firms, defined here as those with market valuations above, but near, $500 million? Recall that we focus on these firms in part to address the criticism that firms in countries with good share-holder protection are larger, and hence have more dispersed ownership. Table III presents the results for these firms using the 20 percent chain definition of control. Among the medium firms, the world average incidence of dispersed ownership is 24 percent, compared to 36 percent for the large firms. So going down in size has the same effect as relaxing the strictness of the definition of control: it makes widely held firms more scarce. Note, how-ever, that in the United States and the U.K., though not in Japan, the me-dium firms remain mostly widely held—a testimony to the attractiveness of selling out in the United States and the U.K.. For medium firms, the per-centage of firms controlled by families rises to a world average of 45 percent, making it the dominant ownership pattern.
The comparison of countries with good and poor shareholder protection reinforces this picture. Only 13 percent of the medium firms in poor protec-tion countries are widely held, compared to 38 percent in good protecprotec-tion countries ~t 5 22.86!. Families control 39 percent of medium firms in the good shareholder protection countries, and 50 percent in the poor investor protection countries ~this difference is not statistically significant!. State control is more common in bad protection countries: 20 percent versus nine per-cent ~t 5 1.64, significant at the 10 percent level!. Using even the tough definition of control, we see that medium-sized firms generally have owners, especially in countries with poor shareholder protection.
Table III, Panel B, shows that, if we soften the definition of control by using the 10 percent control chain, only 11 percent of the medium-sized firms in the world are widely held ~50 percent in the United States and Ireland.! By contrast, 53 percent of firms are family controlled, 16 percent are State
protection~t5 21.83!. In both groups, the predominant ownership pattern is family control. The conclusion from this evidence is inescapable: If we look at the largest firms in the world and use a very tough definition of control, dispersed ownership is about as common as family control. But if we move from there to medium-sized firms, to a more lenient definition of control, and to countries with poor investor protection, widely held firms become an exception. Berle and Means have created an accurate image of ownership of large American corporations, but it is far from a universal image.
B. How are Firms Owned?
In this subsection, we describe some of the mechanisms through which controlling shareholders exercise their power in the large firm sample. We address several related questions. First, how commonly are voting rights separated from cash f low rights through multiple classes of stock, cross-shareholdings, and pyramids? Second, how do families that control firms do so, and in particular is management separate from ownership in these firms? Third, do financial institutions play a bigger role in the control of firms than our earlier discussion has indicated? And finally, who, if anyone, monitors the controlling shareholders? By answering these questions, we hope to provide a more detailed picture of ownership of very large firms, as well as suggest what might be some of the problems in the governance of such firms.
Table IV begins by showing, for each country, the average fraction of book capital needed to control 20 percent of the votes, the incidence of cross-shareholdings by the sample firms, and the frequency of pyramids in firms with controlling owners at the 20 percent control level.
For the large firms, themagnitude of deviations from one-share one-vote through shares with differential voting rights tends to be small. In our sam-ple, it takes on average about 18.6 percent of capital to control 20 percent of the votes, assuming that the only mechanism at the disposal of a controlling shareholder is shares with differential voting rights in the sample firm.10
Companies obviously do not use anything like the opportunities for high and low voting shares allowed by national laws~La Porta et al.~1998!!.11Indeed,
even in countries with poor shareholder protection, it takes on average 17.7 per-cent of capital to buy 20 perper-cent of the votes, compared to 19.7 perper-cent for 10We do not, in this calculation, take account of the voting caps and other possible restric-tions on voting in different countries.
11De Angelo and De Angelo~1985!and Zingales~1994!report similar findings for the United States and Italy, respectively.
good shareholder protection countries~t5 22.53!. Some countries, particu-larly in Scandinavia, have much more significant deviations, but the aver-age deviation from one-share one-vote is small. The results suggest that multiple classes of shares are not a central mechanism of separating
owner-Table IV
One-Share One-Vote, Cross-Shareholdings, and Pyramids This table classifies countries according to their ranking in antidirector rights. We form two groups of countries: ~1! high antidirectors; and ~2! low antidirectors, based on whether the country’s antidirector index is above the median or not. This table presents means for each variable using 20 percent as the criterion for control for a sample of the 20 largest firms~by stock market capitalization of equity at the end of 1995!in 27 countries.~Definitions for each of the variables are given in Table I.!This table also reports tests of means for countries above and below the median antidirector rights.
Country Cap520% V
Pyramid and
Not Widely Held Cross-Shhs
Argentina 19.6013 0.05 0.00 Australia 20.0000 0.14 0.10 Canada 19.3618 0.13 0.00 Hong Kong 19.5107 0.39 0.05 Ireland 20.0000 0.00 0.00 Japan 20.0000 0.00 0.00 New Zealand 20.0000 0.36 0.00 Norway 18.1548 0.13 0.00 Singapore 20.0000 0.41 0.10 Spain 20.0000 0.38 0.00 U.K. 20.0000 . 0.00 United States 19.1927 0.00 0.00
High antidirector avg. 19.6518 0.1808 0.0208
Austria 19.8933 0.47 0.15 Belgium 20.0000 0.79 0.05 Denmark 14.8661 0.08 0.00 Finland 15.7533 0.00 0.00 France 19.9957 0.38 0.00 Germany 18.6137 0.40 0.20 Greece 20.0000 0.11 0.00 Israel 20.0000 0.53 0.00 Italy 18.0399 0.25 0.00 South Korea 20.0000 0.33 0.05 Mexico 16.4490 0.25 0.00 Netherlands 15.0000 0.14 0.00 Portugal 20.0000 0.44 0.05 Sweden 12.6283 0.53 0.10 Switzerland 14.1783 0.00 0.00
Low antidirector avg. 17.6945 0.3137 0.0400
Sample average 18.5644 0.2575 0.0315
Test of Means~t-statistic!
Low vs. high antidirector 22.53 1.64 0.91
tion. Relative to shares with differential voting rights, pyramidal ownership appears to be a more important mechanism used by controlling shareholders to separate their cash f low ownership in sample firms from their control rights. These results are consistent with Wolfenzon’s ~1998! theory on pyr-amids, which suggests that they can be used by controlling shareholders to make existing shareholders pay the costs, but not share in all the benefits of new ventures, particularly in countries with poor shareholder protection. Through pyramids, more so than through high voting rights shares, control-ling shareholders acquire power disproportionate to their cash f low rights. Finally, with the exception of a few countries, such as Sweden and Ger-many, cross-shareholdings by sample firms in the firms that control them or in the controlling chain are rare. This is particularly interesting because cross-shareholdings are restricted by law in only six of our sample countries
~Belgium, France, Germany, Italy, Korea, and Spain!, and, if anything, ap-pear to be more common in the countries where they are restricted.12
Table V examines the firms that are controlled by families more specifi-cally.13 The second column shows that in an average country, the ultimate
family owners control, on average, 25 percent of the value of the top 20 firms. Following up on the predominance of the Wallenbergs in Sweden, we also ask how many of the largest firms a controlling family controls, on average. Our sample average answer is 1.33, though in countries such as Israel and Sweden, an average ultimate family ownercontrols 2.5 of the top 20 firms. Again, this is evidence of very significant control of productive resources by the largest shareholding families.
The next-to-last column of Table V speaks to the crucial issue concerning family control, namely the separation of ownership and management. We ask how often a member of the controlling family is the CEO, the Chairman, the Honorary Chairman, or the Vice-Chairman of the firm that the family controls. We do not catch all the family members by this procedure because a CEO who is married into the family but does not have the same last name would not be recorded as a family member. For the universe as a whole, the answer is that ~at least! 69 percent of the time, families that control firms also participate in management. In countries with good shareholder protec-tion, this fraction is 75 percent, whereas in countries with poor protecprotec-tion, it
12The Japanese Commercial Code prohibits cross-shareholdings by subsidiaries in their par-ents, and places restrictions on voting by companies with large cross-shareholdings~Kita~1996!!. However, modest cross-shareholdings are not restricted and are widely used.
13On preliminary calculations, about one-third of the family-controlled firms are run by their founders, and the rest by the descendants of founders or families that came to own them later.
is 64 percent ~t 5 22.33!. This result shows that the standard problem of separation of ownership and management is not important for most of these firms, which is not to say that controlling shareholders act in the interest of minorities.
Table V
Family Control in a Sample of Large Publicly Traded Firms around the World
This table classifies countries according to their ranking in antidirector rights. We form two groups of countries: ~1! high antidirectors; and ~2! low antidirectors, based on whether the country’s antidirector index is above the median or not. This table presents means for each variable using 20 percent as the criterion for control for a sample of the largest 20 firms~by stock market capitalization of equity at the end of 1995!in 27 countries.~Definitions for each of the variables are given in Table I.!This table also reports tests of means for countries above and below the median antidirector rights.
Country Family %Mkt Fam Firms0Avg Fam Management Pyramids
Argentina 0.65 0.5258 1.18 0.62 0.00 Australia 0.05 0.1218 1.00 1.00 0.00 Canada 0.25 0.2770 1.25 1.00 0.20 Hong Kong 0.70 0.6342 1.56 0.86 0.50 Ireland 0.10 0.0417 2.00 1.00 0.00 Japan 0.05 0.0287 1.00 1.00 0.00 New Zealand 0.25 0.1511 1.00 0.60 0.40 Norway 0.25 0.1327 1.00 0.80 0.00 Singapore 0.30 0.1514 1.20 0.67 0.67 Spain 0.15 0.1697 1.50 0.67 0.33 U.K. 0.00 0.0000 . . . United States 0.20 0.1827 1.00 0.75 0.00
High antidirector avg. 0.2458 0.2014 1.2441 0.7475 0.1909
Austria 0.15 0.0620 1.50 0.33 0.67 Belgium 0.50 0.4124 1.67 0.50 0.80 Denmark 0.35 0.3167 1.17 0.57 0.14 Finland 0.10 0.0613 1.00 0.50 0.00 France 0.20 0.2569 1.00 0.75 0.25 Germany 0.10 0.0751 1.00 0.50 0.00 Greece 0.50 0.4746 1.00 0.60 0.00 Israel 0.50 0.3099 2.50 0.60 0.60 Italy 0.15 0.1424 1.50 1.00 0.33 South Korea 0.20 0.2160 1.33 0.75 0.50 Mexico 1.00 1.0000 1.05 0.95 0.25 Netherlands 0.20 0.0610 1.00 0.50 0.25 Portugal 0.45 0.3798 1.80 0.44 0.44 Sweden 0.45 0.3545 2.50 0.56 0.78 Switzerland 0.30 0.2874 1.00 1.00 0.00
Low antidirector avg. 0.3433 0.2940 1.4010 0.6367 0.3343
Sample average 0.3000 0.2528 1.3347 0.6859 0.2736
Test of Means~t-statistic!
Low vs. high antidirector 1.09 1.06 0.94 22.33 1.34