MPRA
Munich Personal RePEc Archive
The Export Performance of the Euro
Area countries in the period 1996-2007
Cafiso, Gianluca
Univeristy of Catania, Economics Department
July 2009
Online at
http://mpra.ub.uni-muenchen.de/20263/
The Export Performance
of the Euro Area countries in the period 1996-2007
Gianluca Cafiso
Abstract
This paper studies the export performance of the Euro Area and the majority of the Euro Area countries through a Constant Market Share Analysis. We keep a special focus on the three largest countries: Germany, France and Italy. The Constant Market Share Analysis provides a breakdown of an economy’s export performance into the separate components that are due to a Structure Effect, resulting from the product and destination market of its exports, and a broad Competitiveness Effect which is a residual category assumed to capture both price and non-price competitiveness.
JEL codes: F10, F14
Keywords: Constant Market Share Analysis, Export Performance, Specialization, Competitiveness, Euro Area.
July 2009
[Preliminary Draft]
I. Introduction
The aim of this paper is to understand how the pattern of industrial specialization has influenced the export performance of the Euro Area (EAA) as a whole and of the single EAA countries. We keep a special focus on the three largest EAA countries: Germany, France and Italy.1 The analytical tool employed is the Constant Market Share Analysis (CMSA) applied to nominal export flows outside the Euro Area.2 The period that we consider for this study is the closest in time with available data: 1996-2007.
The general idea behind the CMSA is that the product and geographical structure of a country’s exports can affect its total export growth. In simple terms, if a country is more specialized in export products and destination markets where demand is strong in comparison to other products and markets, then the country’s aggregate export market share will tend to rise. The CMSA builds on this idea by providing a breakdown of a country’s export performance into the separate components that are due to a Structure Effect (resulting from the product and destination market specialisation of its exports) and a broad Competitiveness Effect (ie, a residual category which is assumed to be capturing price and non-price competitiveness). The analysis is carried out on exports in value terms, which is the usual methodology for CMSA given that the necessary data disaggregated by sector and destination are usually only available in values but not in volumes. 2. Methodology and Data
A Constant Market Share Analysis (CMSA) decomposes the variation in the aggregate export market share (values) of a country into two main components: (a) the structure of exports, and (b) competitiveness. Various methodologies can be used to carry out a CMSA (Simonis 2000), but the methodology used here is the same as ESCB (2005). In simple terms, the analysis explains the export growth-rate differential between the exports of a specific country (defined as “E”) and the export of a reference country or group of countries (“W”).3 The differential is called the Total Effect (TE), if the TE is positive over the chosen sample period, then country E’s export share has increased.
Total Effect = gTXtEgTXtW,
1We study the other EAA countries as well, the results for these countries are in appendix II. 2
Note that in our analysis the export-performance relates to trade outside the EAA (ie, intra-EAA export flows are excluded).
3
One could compare a country’s performance with respect to a group in which the country under analysis is nested (to wit, a EU country wrt to the EU group or the world); but also two separate countries (i.e. Germany with respect to France).
where E t
gTX is the growth rate of country E’s aggregate export; W t
gTX is the growth rate of the reference group’s exports (“W”).
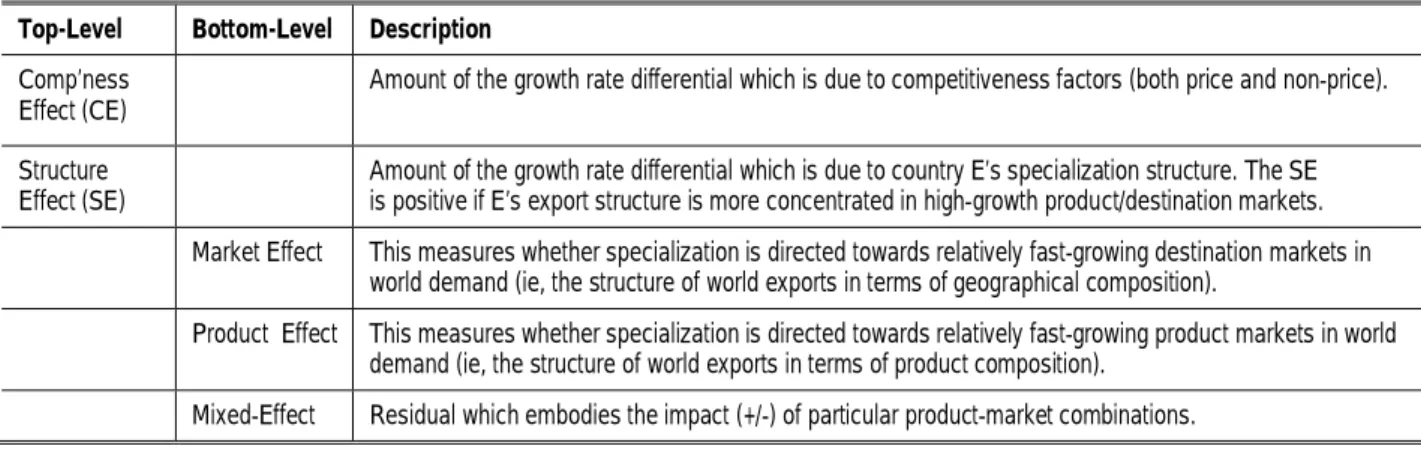
The analysis consists of a two-level decomposition: first, the Total Effect is decomposed into the Structure and Competitiveness effects; second, the Structure Effect is decomposed into the Product, Market and Mixed Effects.
Total Effect = Structure Ef + Competitiveness Ef Structure Effect =Market Ef + Product Ef + Mixed Ef
The Structure Effect is the core calculation of the CMSA. Indeed, the Structure Effect is the amount of the growth rate differential that one would observe if country E’s export share remains constant in every product/destination market. The SE is therefore a benchmark growth-rate differential based on the export structure (product/market specialization). The difference between the Total Effect and the Structure Effect is the Competitiveness Effect (i.e., between the observed and the benchmark value). Accordingly, the competitiveness effect is implicitly a residual of the analysis whose interpretation is difficult given the many factors which, in addition to the Structure Effect, determine a country’s export performance. The intuition for each effect is provided in the following table.
Table 1. Explanation of the different effects Top-Level Bottom-Level Description Comp’ness
Effect (CE)
Amount of the growth rate differential which is due to competitiveness factors (both price and non-price).
Structure Effect (SE)
Amount of the growth rate differential which is due to country E’s specialization structure. The SE is positive if E’s export structure is more concentrated in high-growth product/destination markets. Market Effect This measures whether specialization is directed towards relatively fast-growing destination markets in
world demand (ie, the structure of world exports in terms of geographical composition).
Product Effect This measures whether specialization is directed towards relatively fast-growing product markets in world demand (ie, the structure of world exports in terms of product composition).
Mixed-Effect Residual which embodies the impact (+/-) of particular product-market combinations.
Given the following export concepts:
xijk t, , country i ‘s export of good k to country j at time t (i=E,W; j=1,…,J; k=1,…,K; t=1,…,T),
, ,
1
J
i i
k t j jk t
X
x , country i’s total export of good k at time t, , , 1 K i i j t k jk t X x
, country i’s total export to country j at time t, ,
1 1
K J
i i
t k j jk t
, , , 1 , 1 i i jk t jk t i jk t i jk t x x g x
, growth rate of country i‘s export of good k to country j at time t,
, 1 , , , , 1 , , 1 J i i i i jk t jk t j k t k t i k t i i k t k t g X X g X
, growth rate of country i’s total export of good k at time t, 1 , , , , 1 , , , 1 K i i i i jk t jk t j t j t i k j t i i j t j t g X X g X
, growth rate of country i’s total export to country j at time t, 1 1 i i i t t t i t TX TX gTX TX
, growth rate of country i‘s overall export at time t,
, , 1 1 i jk t i jk t i t x TX
, share of “export to j of product k” in country i’s overall export at time t-1,
k ti,
Jj1ijk t, , share of product k in country i’s overall export at time t-1, ij t,
Kk1ijk t, , share of market j in country i’s overall export at time t-1, the equations of the abovementioned effects are:
, ,
,
, ,
,1 1 1 1
Structure Effect Competitiveness Effect
Total Effect = tE gTXtE gTXtW Jj kK Ejk t Wjk t gWjk t Jj kK gEjk t gWjk t jk tE
, , , , , , 1 1Product Effect Market Effect
, , , , , , , , Structure Effect = K J E E W W E W W t k k t k t k t j j t j t j t W jk t E W E W E W jk t jk t k t k t W j t j t k t g g
, , 1 1 , Mixed Effect W J K jk t W jk t W j k j t g
The CMSA calculations are performed using exports of goods data for the aggregate Euro Area, as well as the majority of the individual Euro Area countries, based on extra-Euro Area trade data (i.e. intra-Euro Area trade is excluded) disaggregated into 46 sectors/products and the 15 most important geographical destinations. The analysis is carried out excluding exports of fuels in order to avoid distortions resulting from highly volatile oil prices. Exports are then separated out into 12 broad product groups which are then allocated according to their technological intensity (i.e. low, medium, and high-tech). One important point to note is that exports are denominated in USD in
value terms, hence developments in export market share are mechanically influenced by changes in the exchange rate.
3. Overview of Results: Export Performance and Export Structure
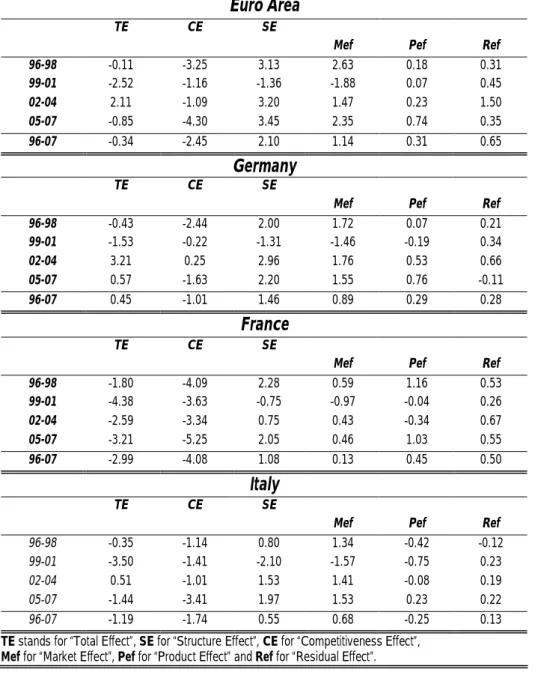
Table 1 shows the CMSA results for the Euro Area, Germany, France and Italy. The bottom row for each economy shows the result for the whole sample period (1996-2007),4 while the other rows show the results for four sub-periods. The Total Effect (TE) column shows that the euro area, France and Italy lost export market share over the whole sample period, while Germany gained market share (Section 4 and the Appendix shows results for the majority of the other Euro Area countries). In terms of the sub-periods, the Total Effect shows significant losses in export share across the board for 1999-2001. This is due to a strong decline in export-value share in 1999 and 2000, which recovers strongly in 2001 and 2002 (see Chart 1 for the Euro Area). The strong variability in share over the period 1999-2002 is largely explained by the bilateral exchange rate of the euro vis-à-vis the USD which first depreciated markedly before appreciating.5
One key result for the whole period, is that all four economies show a negative impact from the Competitiveness Effect (CE), particularly for France. Meanwhile, the Structure Effect (SE) is positive for all four economies, implying that the product and geographical composition of the Euro Area and its three largest countries had for the most part a beneficial effect on their export market shares. The one exception is Italy which had a negative effect from the product effect for the whole sample period.
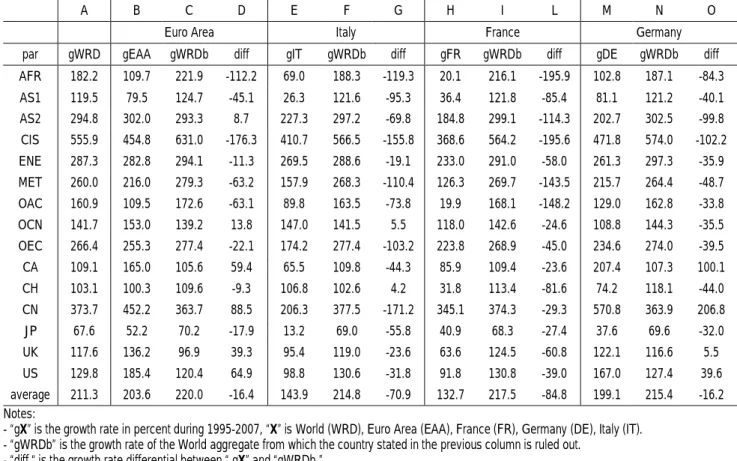
In Table 3 and Table 4 we report specific growth rates for the Euro Area (EAA), France, Germany and Italy between 1995 and 2007. Table 3 includes the growth rates by destination market, to wit, column D comprises the growth-rate differentials of exports towards specific destination markets between the Euro Area and the World (less the Euro Area: “gWRDb”). The EAA’s growth rate towards the Community of Independent States surfaces as the lowest, while the EAA growth rate towards China is the highest (both with respect to “gWRDb”). In Table 4 the growth rates are with respect to sectors which differ by technological intensity. The EAA’s growth rate in the “low-Tech” sector is low, column D, while it is high in the “medium-tech” sector (both with respect to “gWRDb”). These growth-rates can be used to interpret the CMSA results but need caution to
4The complete sample period for the trade data is 1995-2007, while CMSA results are for the period 1996-2007 as
they are based on growth rates.
5Exchange rate and price level variations that are not symmetric across countries are likely to bias the figures used in
avoid misunderstandings. On this regard, one could come to the conclusion that a positive differential in one sector entails a positive contribution from that sector, but this is not necessarily the case. For example, Italy’s growth-rate differential is negative in all sectors while the contribution of the Low and Medium-Tech sectors to Italy’s product effect is positive (Table 11), there’s no inconsistency in this. Indeed, even though Italy’s exports have grown less than the world’s, Italy’s specialization in these two sectors has contributed positively to its Structure Effect because the world demand of these goods has grown very much (this is recorded by the World’s growth rate). On the other hand, Italy’s lack of specialization in the “high-tech” sector causes the negative contribution of this sector to its product effect.
In the next subsections we comment on the export performance of the Euro Area, Germany, France and Italy in greater detail. We consider the contribution of each sector to the overall performance of each country in order to detect in which sector/destination market a country has performed better/worse than its competitors.
Table 2. Constant Market Share Analysis Results
Euro Area
TE CE SE
Mef Pef Ref
96-98 -0.11 -3.25 3.13 2.63 0.18 0.31 99-01 -2.52 -1.16 -1.36 -1.88 0.07 0.45 02-04 2.11 -1.09 3.20 1.47 0.23 1.50 05-07 -0.85 -4.30 3.45 2.35 0.74 0.35 96-07 -0.34 -2.45 2.10 1.14 0.31 0.65 Germany TE CE SE
Mef Pef Ref
96-98 -0.43 -2.44 2.00 1.72 0.07 0.21 99-01 -1.53 -0.22 -1.31 -1.46 -0.19 0.34 02-04 3.21 0.25 2.96 1.76 0.53 0.66 05-07 0.57 -1.63 2.20 1.55 0.76 -0.11 96-07 0.45 -1.01 1.46 0.89 0.29 0.28 France TE CE SE
Mef Pef Ref
96-98 -1.80 -4.09 2.28 0.59 1.16 0.53 99-01 -4.38 -3.63 -0.75 -0.97 -0.04 0.26 02-04 -2.59 -3.34 0.75 0.43 -0.34 0.67 05-07 -3.21 -5.25 2.05 0.46 1.03 0.55 96-07 -2.99 -4.08 1.08 0.13 0.45 0.50 Italy TE CE SE
Mef Pef Ref
96-98 -0.35 -1.14 0.80 1.34 -0.42 -0.12
99-01 -3.50 -1.41 -2.10 -1.57 -0.75 0.23
02-04 0.51 -1.01 1.53 1.41 -0.08 0.19
05-07 -1.44 -3.41 1.97 1.53 0.23 0.22
96-07 -1.19 -1.74 0.55 0.68 -0.25 0.13 TE stands for “Total Effect”, SE for “Structure Effect”, CE for “Competitiveness Effect”,
Table 3. Growth rates of Export values by destination market (1995-2007, percent).
A B C D E F G H I L M N O
Euro Area Italy France Germany
par gWRD gEAA gWRDb diff gIT gWRDb diff gFR gWRDb diff gDE gWRDb diff AFR 182.2 109.7 221.9 -112.2 69.0 188.3 -119.3 20.1 216.1 -195.9 102.8 187.1 -84.3 AS1 119.5 79.5 124.7 -45.1 26.3 121.6 -95.3 36.4 121.8 -85.4 81.1 121.2 -40.1 AS2 294.8 302.0 293.3 8.7 227.3 297.2 -69.8 184.8 299.1 -114.3 202.7 302.5 -99.8 CIS 555.9 454.8 631.0 -176.3 410.7 566.5 -155.8 368.6 564.2 -195.6 471.8 574.0 -102.2 ENE 287.3 282.8 294.1 -11.3 269.5 288.6 -19.1 233.0 291.0 -58.0 261.3 297.3 -35.9 MET 260.0 216.0 279.3 -63.2 157.9 268.3 -110.4 126.3 269.7 -143.5 215.7 264.4 -48.7 OAC 160.9 109.5 172.6 -63.1 89.8 163.5 -73.8 19.9 168.1 -148.2 129.0 162.8 -33.8 OCN 141.7 153.0 139.2 13.8 147.0 141.5 5.5 118.0 142.6 -24.6 108.8 144.3 -35.5 OEC 266.4 255.3 277.4 -22.1 174.2 277.4 -103.2 223.8 268.9 -45.0 234.6 274.0 -39.5 CA 109.1 165.0 105.6 59.4 65.5 109.8 -44.3 85.9 109.4 -23.6 207.4 107.3 100.1 CH 103.1 100.3 109.6 -9.3 106.8 102.6 4.2 31.8 113.4 -81.6 74.2 118.1 -44.0 CN 373.7 452.2 363.7 88.5 206.3 377.5 -171.2 345.1 374.3 -29.3 570.8 363.9 206.8 JP 67.6 52.2 70.2 -17.9 13.2 69.0 -55.8 40.9 68.3 -27.4 37.6 69.6 -32.0 UK 117.6 136.2 96.9 39.3 95.4 119.0 -23.6 63.6 124.5 -60.8 122.1 116.6 5.5 US 129.8 185.4 120.4 64.9 98.8 130.6 -31.8 91.8 130.8 -39.0 167.0 127.4 39.6 average 211.3 203.6 220.0 -16.4 143.9 214.8 -70.9 132.7 217.5 -84.8 199.1 215.4 -16.2 Notes:
- “gX” is the growth rate in percent during 1995-2007, “X” is World (WRD), Euro Area (EAA), France (FR), Germany (DE), Italy (IT). - “gWRDb” is the growth rate of the World aggregate from which the country stated in the previous column is ruled out.
- “diff “ is the growth rate differential between “ gX” and “gWRDb.”
- the “gEAA-CN” cell is the growth rate of the Euro Area’s exports to China (CN)
Table 4. Growth rates of Export values by sector (1995-2007, percent).
A B C D E F G H I L M N O
Euro Area Germany France Italy
TechInt gWRD gEAA gWRDb diff gDE gWRDb diff gFR gWRDb diff gIT gWRDb Diff High 174.2 178.6 173.4 5.2 177.9 174 3.9 70.6 177 -106.4 88.3 176 -87.7 Medium 182 213.7 168.5 45.2 190.6 181 9.6 114.2 186 -71.8 158.1 183 -24.9 Low 140.8 143 140.1 3 149 140 9 71.4 144 -72.6 117.1 142 -24.9 average 165.7 178.5 160.7 17.8 172.5 165 7.5 85.4 169 -83.6 121.2 167 -45.8 Notes:
- “gX” is the growth rate in percent during 1995-2007, “X” is World (WRD), Euro Area (EAA), France (FR), Germany (DE), Italy (IT). - “gWRDb” is the growth rate of the World aggregate from which the country stated in the previous column is ruled out.
- “diff “ is the growth rate differential between “ gX” and “gWRDb.”
3.1 Euro Area’s export performance.
The export-value share of the Euro Area (EAA) over the period 1995-2007 has declined only marginally by around -2.21% (Chart 1), which is equivalent to an average export growth-rate differential of -0.34% vis-à-vis world export growth.6 Despite the fall in market share, the product/market specialization provided a positive contribution to the Euro Area’s export performance, resulting in a Structure Effect of + 2.1%. This was more than offset by a negative contribution from the Competitiveness Effect (-2.45). Accordingly, the Euro Area’s loss in export market share occurred not because of specialization in sector/destination markets for which demand is weak, but because of factors which hampered its competitiveness.
Although the Euro Area’s export market share in values (Chart 1) and in volumes (Chart 2) both show a decline over the sample period, the volume indicator shows a much larger fall. The differences between these indicators are due to several factors, for example: the volume indicator weights the geographical export markets according to their share in the Euro Area’s total exports, while the value indicator is an unweighted measure of export share; the value indicator excludes trade in fuel products, etc.7
Chart 1. EAA’s export-value share (percent). Chart 2. EA’s export volume market share (Index 2000 = 100).
Source: ECB monthly bulletin.
Note: Export-value share of the Euro Area as percentage of world exports to a selected group of partners.
Source: ECB monthly bulletin.
Note: Export market share, volume-based indicator (i.e., export volumes divided by a weighted average of import volumes of major export destinations).
As shown in Table 1, the positive Structure Effect is mostly due to the Market Effect (1.1%) with a smaller positive contribution from the Product effect (0.3%).8 Although the Product Effect (Pef) is positive, this is only due to the medium-tech sector, while exports of high- and low-tech products
6The Euro Area’s export share was 25.7 % in 1995 and 25.1% in 2007, the development of the share is shown in Chart
1.
7
contributed negatively to the export performance of the Euro Area (see sector contribution to the Pef in Table 5).
Overall, the positive Market Effect mostly comes from exports to the EU non-EA countries (ENE), the UK and the Other European Countries (OCE), while exports to the Developed Asian Countries, the United States as well as China contribute negatively (see destination contribution “to the Mef”, Table 3).9 As regards the adverse impact of the Competitiveness Effect of –2.4%(Table 2), this mostly comes from the low- and medium-tech sectors (see contribution “to the CE” Table 2), while the contribution has been negative for all the destinations with the exception of China (see destination contribution to the CE in Table 3). However, the Competitiveness Effect was particularly adverse in export destinations such as the EU non-EA countries (ENE), the Community of Independent States (CIS), the Middle East (MET) and Switzerland (CH).
Table 5. CMSA – Euro Area: Sector Contribution by Technological Content Low-tech Medium-tech High-tech Sum
to the CE -1.175 -1.051 -0.221 -2.447
to the Pef -0.157 1.562 -1.098 0.306
Table 6.: CMSA – Euro Area: Destination Market Contribution
Destination to the CE to the Mef Destination to the CE to the Mef
AFR -0.111 0.033 CA -0.003 -0.349 AS1 -0.126 -0.89 CH -0.242 0.451 AS2 -0.072 -0.114 CN 0.048 -0.674 CIS -0.283 0.467 JP -0.097 -0.19 ENE -0.535 1.946 UK -0.34 1.038 MET -0.292 0.158 US -0.054 -0.785 OAC -0.194 -0.358 OCN -0.015 -0.06 OEC -0.132 0.469 Sum -2.447 1.144
Note: AFR, Africa; AS1, Asia Developed; AS2, Asia Other; CIS, Community of
Independent States; MET, Middle East; OCN, Oceania; OAC, Other American Countries; OEC, Other European Countries; ENE, European Union non-Euro Area countries; CA, Canada; CN, China; JP, Japan; CH, Switzerland; US, United States; UK, United Kingdom.
8
Note that a positive contribution from a sector/destination market means that the Euro Area is relatively more specialized than its competitors in a relatively faster growing export sector/destination market.
9 Weak specialization towards Asia is an enduring outcome of the CMSA applied to the EA, this result is also
3.2 Germany’s Export Performance.
Germany’s export-value share increased in the period 1995-2007 by about 4.70%, which is equivalent to an average positive export growth-rate differential of about 0.46% vis-à-vis world export growth, with most of this strong export performance occurring mainly in the last six years of the sample period (see Table 2). 10 Germany’s product/market specialization contributed positively to its export performance recording an overall Structure Effect of +1.46%, which was only partially offset by a negative Competitiveness Effect of -1.01% (Table 1).
The direction of the evolution of Germany’s export market share (in values) is in line with the volume-based indicator (charts 3 and 4 below), although the rise in the export volume share is larger. Part of the general reasons for differences between volume and value shares has already been explained, but another reason is that the volume based indicator includes both intra- and extra-Euro Area exports implying that Germany has also registered a strong export performance within the area and vis-à-vis the other Euro Area countries.
Chart 3. Germany’s export-value share (percent). Chart 4. Germany’s export vol. market share (Index 2000 = 100).
Source: ECB monthly bulletin.
Note: Export-value share of the Euro Area as percentage of world exports to a selected group of partners.
Source: ECB monthly bulletin.
Note: Export market share, volume-based indicator (i.e., export volumes divided by a weighted average of import volumes of major export destinations).
As shown in Table 1, the positive Structure Effect is mostly due to the Market Effect (0.9%) with a smaller positive contribution from the Product effect (0.3%). In terms of the sector contribution to the Product Effect (Pef), Germany is more specialized in medium-tech products, while it is least specialized in low-tech products (Table 4). As regards the destination contribution to the Market Effect (Mef), Germany strongly exports towards the EU non-EA countries (ENE), the UK and the
10
CIS countries, while it is relatively less specialized towards the Developed Asian countries, the US and China.
Turning to the sectorial explanation of the negative Competitiveness Effect of –1.0% (Table 2), this mostly comes from the low- and medium-tech sectors (Table 4). In terms of export destinations, Germany has been competitive in the US and China, while losing share due to competiveness factors in virtually all of the other geographical markets, particularly in the CIS countries and the EU non-EA countries (ENE) as shown in Table 5.
Table 7. Constant Market Share Analysis - Germany: Sector Contribution by Technological Content
Low-tech Medium-tech High-tech Sum
to the CE -0.397 -0.421 -0.191 -1.009
to the Pef -0.821 1.872 -0.756 0.294
Table 8. Constant Market Share Analysis -Germany: Destination Market Contribution
Destination to the CE to the Mef Destination to the CE to the Mef
AFR -0.04 -0.07 CA 0.05 -0.29 AS1 -0.07 -0.72 CH -0.20 0.38 AS2 -0.05 -0.14 CN 0.12 -0.39 CIS -0.22 0.47 JP -0.11 -0.13 ENE -0.36 1.93 UK 0.01 0.50 MET -0.11 -0.04 US 0.15 -0.53 OAC -0.09 -0.34 OCN -0.03 -0.06 OEC -0.07 0.33 Sum -1.01 0.89
Note: AFR, Africa; AS1, Asia Developed; AS2, Asia Other; CIS, Community
of Independent States; MET, Middle East; OCN, Oceania; OAC, Other American Countries; OEC, Other European Countries; ENE, European Union non-EA countries; CA, Canada; CN, China; JP, Japan; CH, Switzerland; US, United States; UK, United Kingdom.
3.3 France’s Export Performance.
France’s export-value share decreased over the period 1995-2007 by about -27.13%, which is equivalent to to a negative export growth-rate differential of about -2.99% vis-à-vis world export growth.11 France’s weak export performance is fairly constant in all of the sub-periods, which is entirely attributable to a negative Competitiveness Effect of -4.1%, which was only marginally offset by a positive contribution from its product/market specialization which resulted in a positive Structure Effect of +1.1% (Table 1). Meanwhile, the evolution of France’s export-value share is in line with the export-volume share indicator both in terms of direction and magnitude (Chart 5 and Chart 6).
Chart 5. France’s export-value share (percent). Chart 6. France’s export volume market share (Index 2000 = 100).
Source: ECB monthly bulletin.
Note: Export-value share of the Euro Area as percentage of world exports to a selected group of partners.
Source: ECB monthly bulletin.
Note: Export market share, volume-based indicator (i.e., export volumes divided by a weighted average of import volumes of major export destinations).
As shown in Table 1, the positive Structure Effect is mostly due to the Product Effect (0.5%), which is due to its good performance in medium-tech products (see sector contribution to the Pef, Table 9). As for the destination markets, France’s specialization in exports to the UK, the EU non-EA countries (ENE) and the Middle East (MET) was beneficial, while it is relatively less specialized towards the Developed Asian Countries (AS1), China and the US (see destination contribution to the Mef, Table 10) – which is somewhat similar to Germany.
As regards the negative Competitiveness Effect (-4.1%), this was spread across all three sectors, but was particularly evident in the medium-tech sector in which France is more specialized (see sector contribution to the CE, Table 9). From the geographical destination market perspective,
11 France’s Export-value Share was 4.54 % in 1995 and 3.31 % in 2007, the development of the share is shown in Chart
France experienced negative competitiveness effects in all of its destination markets, with particularly pronounced negative effects in the UK and the US (see destination contribution to the CE, Table 10).
Table 9. CMSA-France: Sector Contribution by Technological Content
Low-tech Medium-tech High-tech Sum
to the CE -1.028 -2.151 -0.899 -4.077
to the Pef -0.275 1.730 -1.005 0.451
Table 10. CMSA-France: Destination Contribution
Destination to the CE to the Mef Destination to the CE to the Mef
AFR -0.36 0.23 CA -0.06 -0.25 AS1 -0.35 -0.61 CH -0.32 0.26 AS2 -0.08 -0.10 CN -0.03 -0.54 CIS -0.12 0.01 JP -0.08 -0.11 ENE -0.28 0.67 UK -0.81 1.00 MET -0.41 0.30 US -0.54 -0.65 OAC -0.48 -0.26 OCN -0.05 0.02 OEC -0.09 0.16 Sum -4.08 0.13
Note: AFR, Africa; AS1, Asia Developed; AS2, Asia Other; CIS, Community
of Independent States; MET, Middle East; OCN, Oceania; OAC, Other American Countries; OEC, Other European Countries; ENE, European Union non-EA countries; CA, Canada; CN, China; JP, Japan; CH, Switzerland; US, United States; UK, United Kingdom.
3.4 Italy’s Export Performance.
Italy’s export-value fell during the period 1995-2007 by about -13.0%, which is equivalent to a negative growth-rate differential of approximately -1.19% vis-à-vis world export growth. 12 As in the case of France, although to a lesser extent, Italy’s negative performance is due to the Competitiveness Effect of -1.7% which is partly offset by a positive Structure Effect of 0.6% (Table 1). Although the direction of the evolution of Italy’s export-value share is the same as the volume-based indicator (charts 7-8), the decline in share is much greater for the latter.
Chart 7. Italy’s export-value share (percent). Chart 8. Italy’s export volume market share (Index 2000 = 100).
Source: ECB monthly bulletin.
Note: Export-value share of the Euro Area as percentage of world exports to a selected group of partners.
Source: ECB monthly bulletin.
Note: Export market share, volume-based indicator (i.e., export volumes divided by a weighted average of import volumes of major export destinations).
As shown in Table 1, the positive Structure Effect is only due to the Market Effect (+0.68%) as the Product Effect is negative (-0.25%). The latter is comes about because Italy is relatively more specialized in Low-Tech products, and less specialized in medium- and higher tech products than, say, France and Germany (see sector contribution to the Product Effect, Table 11). As for the destination markets, Italy is specialized towards the EU non-Euro Area (ENE) and the Other European Countries (OEC). Similarly to France and Germany, Italian exports are less directed towards Asia.
In terms of the negative Competitiveness Effect (-1.74%), this is spread fairly evenly across all the sectors (see sector contribution to the CE, Table 11), with negative competitiveness effects
particularly evident in geographical Markets such as Asia (and China) as well as the US (destination contribution to the CE, Table 12 ).
Table 11. CMSA-Italy: Sector Contribution by Technological Content Low Medium High Sum
to the CE -0.713 -0.615 -0.416 -1.744
to the Pef 0.853 0.527 -1.634 -0.255
Table 12. CMSA-Italy: Destination Contribution.
Destination to the Mef to the CE Destination to the Mef to the CE
AFR 0.00 -0.07 CA -0.25 -0.04 AS1 -0.63 -0.21 CH 0.36 0.03 AS2 -0.09 -0.01 CN -0.57 -0.02 CIS 0.40 -0.14 JP -0.13 -0.10 ENE 1.03 -0.02 UK 0.41 -0.20 MET 0.33 -0.27 US -0.64 -0.31 OAC -0.12 -0.19 OCN -0.01 0.00 OEC 0.59 -0.19 Sum 0.68 -1.74
Note: AFR, Africa; AS1, Asia Developed; AS2, Asia Other; CIS, Community
of Independent States; MET, Middle East; OCN, Oceania; OAC, Other American Countries; OEC, Other European Countries; ENE, European Union non-EA countries; CA, Canada; CN, China; JP, Japan; CH, Switzerland; US, United States; UK, United Kingdom.
4. Export performance of the majority of the remaining Euro Area countries.
In this section, we describe the results of the constant market share analysis for the majority of the remaining Euro Area countries.13 Chart 9 shows the key results for the Euro Area and all of the countries covered in the analysis for the sample period 1996-2007, with the countries arranged in descending order of magnitude of the Total Effect (in other words, those countries towards the left of the chart experienced gains in export market share, while those towards the right recorded losses).14 Starting from the left, the positive Total Effects in many cases was partly due to positive Structure Effects, but for Austria, Netherlands, Ireland and Spain gain in export share was mostly due to strong positive Competitiveness Effects. However, it should be noted that in more recent years some of these countries show negative Competitiveness Effects, particularly Spain and Ireland. When focussing on economies which lost export market share on the right-side of Chart 9, we tend to see significantly larger positive Structure Effects – mostly driven by specialisation in geographical markets which grew relatively rapidly – which are more than offset by substantial negative impacts from Competiveness Effects. This is particularly apparent for Greece and Finland. Meanwhile, Portugal’s loss in export share is explained by a large negative Competitiveness Effect as well as a negative product effect, with the latter due to a relatively high specialisation in slower growing low-tech product markets.
Similar to the analysis in the earlier sections, the Euro Area countries tend to be specialising in destination markets - and, in a significant number of cases, product markets - which have been beneficial to export performance. However, the negative competitiveness effects of many of the Euro Area countries in those same sectors and geographical markets has outweighed this advantage and caused losses in export share. Part of the explanation for the poor competitiveness is the decline in price competitiveness resulting from the nominal appreciation of the euro that occurred over the latter part of the sample period. However, non-price factors probably also partially explain the negative competitiveness effects and may be related to claims that the Euro Area lags its competitors in terms of technological competitiveness.15 Another factor which may be captured by the competitiveness effect is the emergence of China as a major player in world
13 Not all of the Euro Area countries are shown due to data problems preventing a full analysis of all countries. 14
The results for the relative export performance of the individual countries, as well as the estimated relative importance of the various effects of the CMSA, are similar to those reported by the European Commission in Box 1 “Constant Market Share Analysis of Euro Area Countries’ Exports” pp. 21-22 of “Broader Macroeconomic Surveillance – A Review of Competitiveness Developments in the Euro Area” (ECFIN/C1 (2008) REP55742).
15
markets which by its very nature has resulted in the shrinking of export market shares of advanced industrialised economies such as the Euro Area.
Chart 9. CMSA for the Euro Area and the majority of the Euro Area countries 1996-2007
-5.00 -4.00 -3.00 -2.00 -1.00 0.00 1.00 2.00 3.00 A T NL IE ES BE - LU DE EA GR IT FI PT FR TE CE SE Mef Pef
Notes: TE "Total Effect", SE "Structure Effect", CE "Competitiveness effect", Mef "Market effect", Pef "Product effect"; Countries arranged in descending order of magnitude of Total Effect (TE) .
5. Concluding Remarks
Over the sample period 1996-2007, the Euro Area marginally lost export market share (in value terms) while France and Italy experienced greater losses in share, and Germany gained share. The structure effect had a beneficial impact on their export performance as they specialised in products and destination markets which grew relatively rapidly in comparison to the world average (eg, medium-tech products and to export destinations such as other EU countries). Meanwhile, they are less specialized in high-tech products and fast growing destination markets such as Asia and the US. However, the exports of the Euro Area and the majority of the Euro Area countries experienced a substantially negative competitiveness effect. This negative impact from competitiveness is prevalent in almost all sectors and destination markets, including those where the Euro Area economies are highly specialised (eg, medium-tech sectors, and in geographical markets such as other EU Members). The weak competitiveness may be partly explained by the decline in price competitiveness due to the nominal appreciation of the euro over the sample period, with non-price factors such as technological competitiveness, as well as the emergence of China as a major player in world export markets, also playing a role.
In summary, the Euro Area and the majority of Euro Area countries’ exports have specialised in products and destination markets which have been beneficial to export performance, although weak competitiveness performance has more than offset these positive effects in many of the countries.
Bibliographical References
Anderton B. (1999), “Innovation, product quality, variety, and trade performance: an empirical analysis of Germany and the UK”, Oxford economic papers, 51: 152-167.
ECB (2005), “Competitiveness and the Export Performance of the EA”, European Central Bank Occasional Paper no. 30.
EC (2008) “Broader Macroeconomic Surveillance – A Review of Competitiveness Developments in the Euro Area”, European Commission (ECFIN/C1 (2008) REP55742.
APPENDIX I. Features of the Sample and Dataset used.
The Constant Market Share Analysis discussed in this paper uses nominal US$ export flows extracted from the UN Comtrade dataset, the time-span is 1995-2007, yearly frequency. The export flows are grouped into 46 sectors (SITC rev. 3, 2-digit); we consider almost all sectors, but we intentionally exclude “Mineral fuels, lubricants and related materials” in accordance with ECB OP 30. The Sectors are further classified into Low, Medium and High Tech as in Anderton (1999). The analysis considers 15 destination markets, of which 6 are single countries and 7 geographical aggregates. Altogether, these cover all the destination markets of the Euro Area countries. A list of the sectors and partners included can be found in the appendix. Intra Euro Area export flows are excluded as we study the external performance of the Euro Area and how this is decomposed into the performance of the majority of the Euro Area countries.
Id_sec Commodity SITC Commodity Description Sector Technological
1 S3-00 live animals FOD low
2 S3-01 meat, meat preparations FOD low
3 S3-02 dairy products, bird eggs FOD low
4 S3-03 fish, crustaceans, mollusc FOD low
5 S3-04 Cereals, cereal preprtns. FOD low
6 S3-05 vegetables and fruit FOD low
7 S3-06 sugar,sugr.preptns,honey FOD low
8 S3-07 coffee,tea,cocoa,spices FOD low
9 S3-08 animal feed stuff FOD low
10 S3-09 misc.edible products etc FOD low
11 S3-11 beverages FOD low
12 S3-12 tobacco,tobacco manufact FOD low
13 S3-23 crude rubber CHE Medium
14 S3-51 organic chemicals CHE Medium
15 S3-52 inorganic chemicals CHE Medium
16 S3-53 dyes,colouring materials CHE Medium
17 S3-54 medicinal,pharm.products CHE Medium
18 S3-55 essentl.oils,perfume,etc CHE Medium
19 S3-56 fertilizer,except grp272 CHE Medium
20 S3-57 plastics in primary form CHE Medium
21 S3-58 plastic,non-primary form CHE Medium
22 S3-59 chemical materials nes CHE Medium
23 S3-61 leather, leather goods TEX low
24 S3-62 rubber manufactures, nes CHE Medium
25 S3-63 cork, wood manufactures WOD low
26 S3-64 paper,paperboard,etc. PAP low
27 S3-65 textile yarn,fabric,etc. TEX low
28 S3-66 non-metal.mineral manfct MNM low
29 S3-67 iron and steel BMI low
30 S3-68 non-ferrous metals BMI low
31 S3-69 metals manufactures,nes BMA low
32 S3-71 power generatng.machines MAI Medium
33 S3-72 special.indust.machinery MAI Medium
34 S3-73 metalworking machinery MAI Medium
35 S3-74 general industl.mach.nes MAI Medium
36 S3-75 office machines,adp mach MIO High
37 S3-76 telecomm.sound equip etc MEL High
38 S3-77 elec mch appar,parts,nes MEL High
39 S3-78 road vehicles MTR Medium
40 S3-79 othr.transport equipment MTR Medium
41 S3-82 furniture,bedding,etc. WOD low
42 S3-83 travel goods,handbgs etc TEX low
43 S3-84 clothing and accessories TEX low
44 S3-85 footwear TEX low
45 S3-87 scientific equipment nes MIO High
Country or aggregate code
Country or aggregate name
list of countries included if Aggregate
AFR Africa Algeria, Egypt, Libya, Morocco, Northern Africa, nes, Sudan, Tunisia, Western Sahara, Angola, Benin, Botswana, Br. Indian Ocean Terr., Burkina Faso, Burundi, Cape Verde, Comoros, Côte d'Ivoire, Dem. Rep. of the Congo, Djibouti, Eritrea, Ethiopia, Fmr Ethiopia, Fmr Rhodesia Nyas, Fmr Tanganyika, Fmr Zanzibar and Pemba Isd, Fr. South Antarctic Terr., Gambia, Ghana, Guinea, Guinea-Bissau, Kenya, Lesotho, Liberia, Madagascar, Malawi, Mali, Mauritania, Mauritius, Mozambique, Namibia, Niger, Nigeria, Other Africa, nes, Réunion, Rwanda, Saint Helena, Sao Tome and Principe, Senegal, Seychelles, Sierra Leone, Somalia, South Africa, Swaziland, Togo, Uganda, United Rep. of Tanzania, Zambia, Zimbabwe
AS1 Asia 1 (Developed) China, Hong Kong SAR, Indonesia, Malaysia, Philippines, Rep. of Korea, Singapore, Thailand
AS2 Asia 2 (Other Asian Countries, incl. India)
Bangladesh, Bhutan, Brunei Darussalam, Cambodia, Dem. People's Rep. of Korea, India, Lao People's Dem. Rep., Maldives, Mongolia, Myanmar, Nepal, Pakistan, Sri Lanka, Viet Nam
CIS Community of Independent States
Armenia, Azerbaijan, Belarus, Georgia, Kazakhstan, Kyrgyzstan, Rep. of Moldova, Russian Federation, Tajikistan, Turkmenistan, Ukraine, Uzbekistan
ENE Countries which are in the European Union but not in the Euro Area
Bulgaria, Czech Rep., Denmark, Estonia, Hungary, Latvia, Lithuania, Poland, Romania, Sweden
MET Middle East Afghanistan, Bahrain, Fmr Dem. Yemen, Iran, Iraq, Israel, Jordan, Kuwait, Lebanon, Oman, Qatar, Saudi Arabia, Syria, United Arab Emirates, Yemen
OCN Oceania Australia, Christmas Isds, Cocos Isds, Cook Isds, Fiji, Fmr Pacific Isds, French Polynesia, FS Micronesia, Kiribati, Marshall Isds, N. Mariana Isds, Nauru, New Caledonia, New Zealand, Niue, Norfolk Isds, Oceania, nes, Palau, Papua New Guinea, Pitcairn, Samoa, Solomon Isds, Tokelau, Tonga, Tuvalu, US Misc. Pacific Isds, Vanuatu, Wallis and Futuna Isds
OAC Other American Countries Anguilla, Antigua and Barbuda, Argentina, Aruba, Bahamas, Barbados, Belize, Bolivia, Br. Antarctic Terr., Br. Virgin Isds, Brazil, CACM, nes, Caribbean, nes, Cayman Isds, Chile, Colombia, Costa Rica, Cuba, Dominica, Dominican Rep., Ecuador, El Salvador, Falkland Isds (Malvinas), Fmr Panama, excl.Canal Zone, Fmr Panamá-Canal-Zone, French Guiana, Grenada, Guadeloupe, Guatemala, Guyana, Haiti, Honduras, Jamaica, LAIA, nes, Martinique, Mexico, Montserrat, Neth. Antilles, Neth. Antilles and Aruba, Nicaragua, Panama, Paraguay, Peru, Rest of America, nes, Saint Kitts and Nevis, Saint Kitts, Nevis and Anguilla, Saint Lucia, Saint Vincent and the Grenadines, Suriname, Trinidad and Tobago, Turks and Caicos Isds, Uruguay, US Virgin Isds, Venezuela
OEC Other European Countries Albania, Bosnia Herzegovina, Croatia, Gibraltar, Iceland, Norway, Serbia and Montenegro, Turkey
CA Canada UK United Kingdom CN China CH Switzerland JP Japan
APPENDIX II. Constant Market Share Analysis output.
Table AII 1. CMSA-Euro Area Aggregate
yr TE CE SE
Mef Pef Ref
1996 -2.72 -7.42 4.70 4.21 0.45 0.05 1997 -2.40 -2.20 -0.19 -0.68 -0.08 0.57 1998 4.77 -0.11 4.88 4.38 0.19 0.31 1999 -7.04 -3.44 -3.61 -3.45 -0.56 0.41 2000 -10.64 -6.81 -3.82 -3.53 -1.26 0.96 2001 10.13 6.78 3.35 1.34 2.04 -0.03 2002 4.72 3.29 1.42 -0.06 0.43 1.06 2003 2.49 -2.38 4.87 1.88 0.65 2.35 2004 -0.89 -4.18 3.29 2.60 -0.41 1.10 2005 -6.73 -8.52 1.79 1.00 0.69 0.10 2006 0.27 -1.92 2.19 2.78 -0.45 -0.14 2007 3.92 -2.45 6.37 3.28 1.99 1.11 96-07 -0.34 -2.45 2.10 1.14 0.31 0.65
Table AII 2. CMSA-Germany.
yr TE CE SE
Mef Pef Ref
1996 -3.98 -7.00 3.01 2.75 -0.13 0.40 1997 -4.61 -4.33 -0.27 -0.65 0.31 0.07 1998 7.29 4.01 3.27 3.06 0.04 0.17 1999 -6.06 -2.45 -3.61 -2.69 -0.69 -0.23 2000 -10.78 -7.29 -3.50 -3.58 -0.84 0.92 2001 12.25 9.07 3.18 1.88 0.97 0.33 2002 4.91 2.68 2.23 1.08 0.86 0.29 2003 3.83 0.06 3.77 2.57 0.22 0.98 2004 0.90 -1.97 2.87 1.64 0.52 0.71 2005 -3.29 -2.96 -0.33 -0.05 0.11 -0.39 2006 2.95 1.45 1.49 1.70 0.26 -0.47 2007 2.07 -3.38 5.45 3.01 1.90 0.54 96-07 0.45 -1.01 1.46 0.89 0.29 0.28
Table AII 3. CMSA-France
yr TE CE SE
Mef Pef Ref
1996 -9.24 -10.94 1.70 -0.12 1.27 0.55 1997 -1.91 -2.02 0.10 -0.70 -0.09 0.90 1998 5.74 0.70 5.04 2.60 2.30 0.14 1999 -3.70 -0.44 -3.26 -1.94 -0.73 -0.59 2000 -13.75 -8.75 -5.02 -3.64 -2.92 1.56 2001 4.31 -1.70 6.01 2.68 3.53 -0.19 2002 -1.20 -2.09 0.89 0.12 0.64 0.12 2003 -0.64 -2.21 1.57 0.55 -0.29 1.31 2004 -5.92 -5.72 -0.19 0.63 -1.38 0.56 2005 -8.00 -8.52 0.53 -0.47 -0.12 1.10 2006 -0.70 -2.27 1.57 -0.17 1.11 0.63 2007 -0.92 -4.96 4.04 2.02 2.09 -0.07 96-07 -2.99 -4.08 1.08 0.13 0.45 0.50
Table AII 4. CMSA-Italy.
yr TE CE SE
Mef Pef Ref
1996 7.43 6.39 1.04 1.59 -0.34 -0.21 1997 -9.68 -8.89 -0.79 -0.22 -0.35 -0.21 1998 1.22 -0.91 2.14 2.65 -0.57 0.05 1999 -11.31 -6.11 -5.20 -3.39 -2.08 0.27 2000 -6.94 -2.14 -4.81 -3.10 -1.90 0.20 2001 7.74 4.03 3.71 1.78 1.73 0.21 2002 0.72 -1.26 1.98 0.99 0.59 0.40 2003 2.29 0.09 2.21 1.84 0.00 0.36 2004 -1.47 -1.87 0.40 1.41 -0.82 -0.20 2005 -7.70 -7.41 -0.30 0.50 -0.54 -0.26 2006 -3.76 -5.08 1.32 0.95 -0.10 0.47 2007 7.14 2.25 4.90 3.13 1.32 0.44 96-07 -1.19 -1.74 0.55 0.68 -0.25 0.13
Table AII 5. CMSA-Spain.
yr TE CE SE
Mef Pef Ref
1996 10.50 9.40 1.26 0.58 -0.09 0.72 1997 1.35 -0.40 1.70 1.63 -0.38 0.45 1998 1.87 -2.17 4.04 3.93 0.77 -0.66 1999 -2.86 2.11 -4.97 -4.03 -0.74 -0.21 2000 -10.04 -4.43 -5.61 -3.43 -3.04 0.85 2001 4.37 0.37 4.00 2.19 2.45 -0.64 2002 6.94 6.12 0.83 -1.26 1.87 0.20 2003 8.45 7.25 1.21 -0.58 0.00 1.78 2004 -4.63 -6.04 1.42 0.80 -1.50 2.11 2005 -3.41 -2.60 -0.81 -0.91 -0.03 0.13 2006 -2.24 -3.40 1.16 0.08 0.46 0.61 2007 5.10 0.89 4.21 2.36 1.49 0.36 96-07 1.28 0.59 0.70 0.11 0.10 0.48
Table AII 6. CMSA-The Netherlands.
yr TE CE SE
Mef Pef Ref
1996 -7.84 -9.33 1.52 1.99 0.53 -1.03 1997 17.76 18.31 -0.59 -0.34 0.09 -0.33 1998 -16.64 -20.57 3.93 4.45 -0.27 -0.25 1999 3.42 6.61 -3.21 -3.34 -0.14 0.28 2000 -5.81 -0.40 -5.41 -4.71 -1.06 0.35 2001 5.92 2.07 3.85 2.91 1.65 -0.71 2002 3.44 4.28 -0.84 0.79 -0.43 -1.19 2003 13.24 11.22 2.02 1.50 1.20 -0.68 2004 6.76 5.92 0.84 0.82 -0.46 0.49 2005 -1.05 -0.75 -0.30 -0.79 0.21 0.28 2006 -2.03 -2.53 0.51 1.12 -1.13 0.51 2007 6.24 4.00 2.24 3.09 -0.04 -0.81 96-07 1.95 1.57 0.38 0.63 0.01 -0.26
Table AII 7. CMSA-Austria
yr TE CE SE
Mef Pef Ref
1996 -0.71 -3.13 2.52 3.05 -0.30 -0.34 1997 -1.37 0.54 -1.91 -1.54 -0.39 0.01 1998 5.35 0.94 4.34 4.05 0.24 0.16 1999 -4.86 0.40 -5.32 -4.19 -1.16 0.11 2000 -6.23 -0.56 -5.57 -5.09 -1.45 0.82 2001 9.79 5.26 4.52 2.77 1.39 0.39 2002 6.38 3.44 3.00 2.29 0.86 -0.23 2003 11.19 6.07 5.22 4.31 0.34 0.41 2004 7.57 5.88 1.89 2.18 0.02 -0.59 2005 -6.78 -6.17 -0.54 0.44 -0.35 -0.71 2006 -0.63 -3.40 2.83 2.26 0.07 0.41 2007 5.37 -0.09 5.46 3.68 1.99 -0.20 96-07 2.09 0.76 1.37 1.18 0.11 0.02
Table AII 8. CMSA-Portugal
yr TE CE SE
Mef Pef Ref
1996 -2.17 -1.56 0.26 -0.34 -0.52 0.40 1997 -4.69 -6.03 1.28 0.21 0.27 0.75 1998 3.42 -1.13 4.34 5.98 -1.17 -0.21 1999 -8.94 -8.35 -0.65 -2.39 0.31 1.56 2000 -10.52 -2.95 -7.39 -6.08 -1.69 0.17 2001 2.12 -1.61 3.92 2.90 0.72 0.10 2002 2.70 0.59 2.16 -0.20 1.13 1.14 2003 8.51 8.71 0.04 -0.68 -1.05 1.44 2004 -10.46 -7.44 -2.71 -0.38 -2.96 0.22 2005 -18.42 -14.79 -3.20 -2.53 -1.97 1.01 2006 0.48 1.36 -0.86 -0.68 -1.66 1.36 2007 7.96 7.85 0.25 1.36 -1.69 0.43 96-07 -2.50 -2.11 -0.21 -0.23 -0.86 0.70
Table AII 9. CMSA-Greece.
yr TE CE SE
Mef Pef Ref
1996 9.20 1.90 7.36 6.27 0.92 -0.13 1997 -4.82 -3.70 -0.99 0.71 -1.75 -0.01 1998 -0.18 -1.39 0.76 3.08 -1.14 -0.95 1999 -8.60 -1.82 -6.45 -6.45 -2.23 2.10 2000 -4.50 2.12 -6.38 -3.93 -3.04 0.29 2001 14.47 8.43 5.95 3.91 2.31 -0.17 2002 -10.14 -12.93 2.79 3.18 -0.69 0.28 2003 14.81 7.39 7.71 6.00 -0.37 1.79 2004 -9.52 -10.80 1.77 3.05 -1.29 -0.53 2005 -0.56 -0.89 0.81 0.80 -0.24 -0.30 2006 -10.75 -16.14 5.92 2.09 1.68 1.77 2007 6.11 0.97 5.42 5.25 0.50 -0.74 96-07 -0.37 -2.24 2.05 2.00 -0.45 0.28
Table AII 10. CMSA-Finland.
yr TE CE SE
Mef Pef Ref
1996 -1.28 -5.28 4.17 4.80 -1.32 0.50 1997 -4.62 -4.41 -0.21 0.01 -0.91 0.70 1998 2.61 0.14 2.31 1.66 0.44 0.42 1999 -10.80 -5.46 -5.42 -5.28 -0.44 0.41 2000 -2.77 -2.82 0.11 -3.07 1.76 1.36 2001 -0.47 -4.22 3.77 4.02 -0.62 0.37 2002 -0.91 -2.35 1.48 2.58 -1.15 0.08 2003 2.88 -0.73 3.69 5.04 -0.49 -0.95 2004 -0.70 -6.84 6.30 3.08 2.40 0.65 2005 -0.75 -4.91 4.31 2.92 0.84 0.41 2006 -1.84 -5.40 3.64 5.09 0.32 -1.86 2007 2.70 -4.49 7.29 7.19 0.98 -0.97 96-07 -1.33 -3.90 2.62 2.34 0.15 0.09
Table AII 11. CMSA-Ireland
yr TE CE SE
Mef Pef Ref
1996 8.61 8.71 0.16 -0.08 1.20 -1.30 1997 8.18 6.59 1.61 0.34 1.03 0.21 1998 20.15 16.22 3.83 3.39 -0.07 0.66 1999 14.04 9.59 4.26 0.64 3.24 0.64 2000 1.70 5.33 -3.56 -3.90 0.42 -0.19 2001 16.87 15.98 0.95 0.44 1.20 -0.75 2002 -1.23 -1.26 0.06 -1.29 0.29 1.00 2003 -16.50 -17.19 0.85 -1.94 3.70 -1.14 2004 -9.63 -6.54 -2.89 -1.92 0.27 -1.52 2005 -8.97 -6.14 -2.76 -3.77 0.18 0.74 2006 -13.61 -10.98 -2.57 -2.98 -1.38 1.73 2007 1.08 6.00 -4.78 -2.91 -0.99 -1.04 96-07 1.72 2.19 -0.40 -1.16 0.76 -0.08
Table AII 12. CMSA- Belgium - Luxembourg
yr TE CE SE
Mef Pef Ref
1996 -1.81 -1.81 0.00 0.68 -2.82 2.14 1997 2.76 3.25 -0.50 -0.68 -0.44 0.62 1998 6.20 4.19 2.01 3.79 -0.75 -1.03 1999 -0.16 0.09 -0.25 -3.22 0.62 2.34 2000 -6.36 -1.54 -4.82 -4.82 -0.53 0.53 2001 5.48 3.48 2.00 3.30 2.67 -3.96 2002 12.05 2.59 9.46 0.72 1.74 6.99 2003 -1.32 -5.35 4.02 1.74 1.03 1.25 2004 -2.62 -2.56 -0.07 -1.03 -0.67 1.64 2005 -2.14 -0.93 -1.21 -0.91 -0.01 -0.28 2006 -6.27 -4.86 -1.42 1.12 -2.22 -0.31 96-06 0.53 -0.31 0.84 0.06 -0.13 0.90