9
POST-CRISIS FINANCIAL INTERMEDIATION
Ilie MIHAI* E-mail:[email protected]
Cristian OPREA* E-mail: [email protected]
*Spiru Haret University, Bucharest
Abstract
The recent financial crisis that begun in 2007 in the US, which then swept around the world, has left deep scars on the already wrinkled face of the global economy.
Some national and regional economies, which had money for expensive makeup, or created money1, managed to blur or hide the scars left by the crisis, others are still facing difficulties in overcoming the effects of this.
The rapacity of banks, their greed and risk ignorance, were the origin of the outbreak of the last major economic and financial crisis but unfortunately those who were responsible or, rather, irresponsible, paid little or nothing at all for the burden of their bad loan portfolio. This cost has been supported by the population, either directly by paying high interest and fees [Mihai I., 2007], or indirectly, through the use of public budgets to cover the losses of banks, most of which had private capital.
In this context, we intend to examine the state of financial intermediation in Romania in the post-crisis period, and to primarily follow: (i) The structure and evolution of the banking system; (ii) Non-government credit situation; (iii) The level of savings; (iiii) Loan-deposit ratio; (v) The degree of financial intermediation and disintegration phenomenon etc., and to articulate some conclusions and suggestions on the matters that have been explored.
Keywords: financial (dis)intermediation, loans, deposits, banking system, nonperforming loans, interest, inflation, foreign/Romanian capital
JEL Classification: G01; G15
Developments in the Romanian banking system
The effects of the recent economic and financial crisis made themselves
strongly felt on the global and European banking system, states around the world
1
In 2009-2011, the US Central Bank (FED) printed and injected into the market over 2300 billion USD, the Central Bank of Britain the equivalent of approx. 315 billion USD and the European Central Bank, following the example of the British and the Americans,
launched, staring with January 2015, a quantitative relaxation program totalling 1100 billion Euro.
10
having to face resounding bankruptcies [Lehman Brothers, 2008], important
losses of budget revenues as a result of failure to achieve the expected profits of the
banks and, in particular, huge public expenses for support and for avoiding chain
collapse of banking institutions
2, virtually all of them being private owned.
In Romania, although the government has not directly allocated public money
to support banking institutions with majority Romanian capital, the effects of the
crisis have been felt by deep cuts, even the freeze of crediting, and failure to collect
the expected budget revenue form taxes on the banking system, the banks having
faced significant losses determined by a reduced banking intermediation and by the
expenses related to the reorganising of bad loans balances.
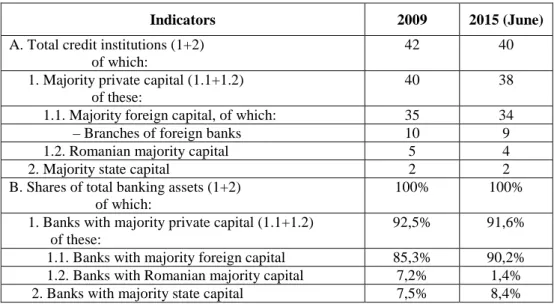
Structural changes in the Romanian banking system in the post-crisis period
are as follows (Table no. 1):
Table no. 1 Structural developments in the Romanian banking system
Indicators 2009 2015 (June)
A. Total credit institutions (1+2) of which:
42 40
1. Majority private capital (1.1+1.2) of these:
40 38
1.1. Majority foreign capital, of which: 35 34
– Branches of foreign banks 10 9
1.2. Romanian majority capital 5 4
2. Majority state capital 2 2
B. Shares of total banking assets (1+2) of which:
100% 100%
1. Banks with majority private capital (1.1+1.2) of these:
92,5% 91,6%
1.1. Banks with majority foreign capital 85,3% 90,2% 1.2. Banks with Romanian majority capital 7,2% 1,4% 2. Banks with majority state capital 7,5% 8,4%
Source: National Bank of Romania – Financial Stability Report, June 2009, ISSN 1843-3235; National Bank of Romania – Financial Stability Report, September 2015,
ISSN 1843-3235.
In the analysed post-crisis period (2009-2015) the number of credit
institutions operating in Romania decreased from 42 banks to 40 banks, through
the exit from the system of:
– Royal Bank of Scotland;
– Volksbank, taken over by Banca Transilvania.
Also in this period, the Romanian branch of Bank of Cyprus closed its
operations in Romania.
2 The financial effort of the USA for saving the banking system amounted to approx. 12600 billion USD.
11
At the same time, the number of Romanian majority capital banks (private
and public) was reduced from seven banks to six banks through foreign takeover of
the majority capital of Banca Transilvania.
3Banks with majority private capital continue to hold shares in total bank
assets of 91.6%, virtually all of them being of foreign majority capital, with 90.2%
of share in total banking assets.
The six banks
4with Romanian majority capital (private and public) have,
together, only 9.8% market share, decreasing by approx. 5% compared with 2009,
due mainly to the reclassification of Banca Transilvania from Romanian majority
capital banks to that of foreign majority capital banks and to the removal of large
value bad loans from the balance sheets.
In banks with foreign majority capital, Banca Comercial
ă
Român
ă
5continues to
be the leader with a market share of nearly 20%, and between banks with Romanian
majority capital, CEC Bank is the leader with a market share of approx. 7%.
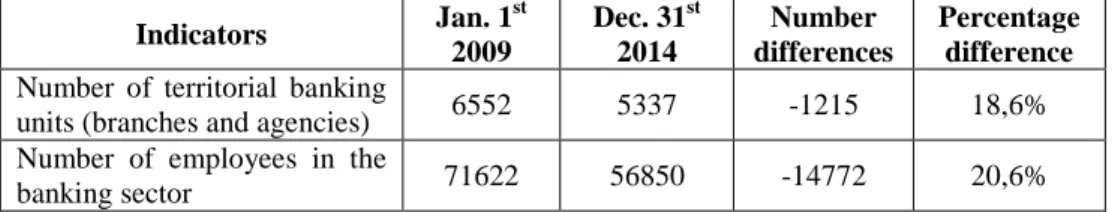
The Romanian banking sector, dominated by foreign capital, has
“contributed” under the pretext of restructuring, to the disappearance of a important
number of territorial banking units (branches and agencies) and numerous jobs
(Table no. 2), Romania reaching the last place in the EU in terms of banking units
and number of employees in the banking sector compared with the population
(Table no. 3).
Table no. 2 Comparison between the number of territorial units and employees
in the banking sector
Indicators Jan. 1 st 2009 Dec. 31st 2014 Number differences Percentage difference Number of territorial banking
units (branches and agencies) 6552 5337 -1215 18,6% Number of employees in the
banking sector 71622 56850 -14772 20,6%
Source: NBR, ARB.
Table no. 3 Banking degree
Indicators Romania EU
Number of inhabitants per employee in the banking sector 345 175
Number of inhabitants per banking unit 3760 2450
Source: National Bank of Romania – Financial Stability Report, September 2015, ISSN 1843-3235, p. 73.
3 The selling by local stockholders of a significant package of shares to International Finance Corporation (IFC).
4 Romanian majority private banks: Banca Carpatica, Libra Bank, Banca Română pentru Credit şi Investiţii (founded by the uptake by Romanian investors of ATE Bank, in December 2013), Banca Centrală Cooperatistă Creditcoop, CECBank, Eximbank.
5
12
Banking system contribution to the income of the state budget has been
decreased given that the banks have ended recent years with losses
6.
Thus, at the end of 2014, the Romanian banking system as a whole recorded
losses amounting to 4.7 billion RON, with the following structure:
– 23 banking companies reported losses amounting to a total of 6.4 billion
RON;
– 17 banking companies reported profit amounting to 1.7 billion RON;
Of the units that reported losses, the largest amounts are found in the balance
sheets of Banca Comerciala Romana, Volksbank, Bancpost etc. and among banks
with a larger profit we mention Raiffeisen Bank, Banca Transilvania, City Bank
România etc.
Not knowing the local market and questionable training of top managers
appointed by foreign shareholders in the management of banks operating in
Romania, materialized in the lack of performance of banking companies led to
frequent changes in the top management.
Thus, many banks have had to change three or even more top managers in the
post-crisis period.
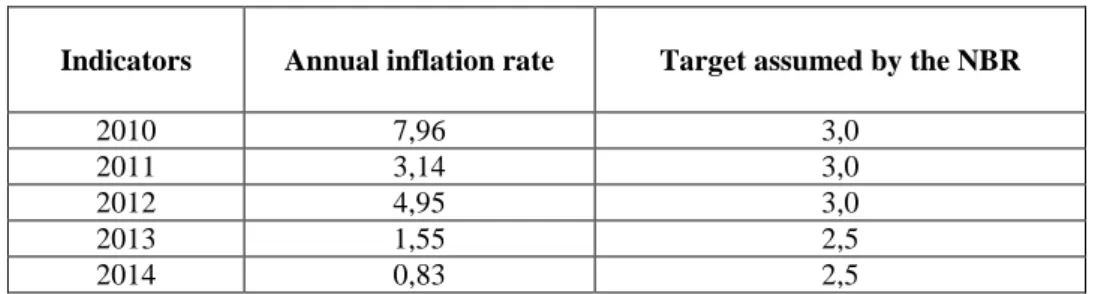
7Table no. 5 Evolution of the inflation rate in the post-crisis period
– % – Indicators Annual inflation rate Target assumed by the NBR
2010 7,96 3,0
2011 3,14 3,0
2012 4,95 3,0
2013 1,55 2,5
2014 0,83 2,5
Source: NBR, annual reports on inflation 2010; 2011; 2012; 2013; 2014.
The share of foreign currency loans in total nongovernmental credit slightly
decreased in the analysed period, from 60.1% in December 2009 to 56.2% in
December 2014 and still remains at a high level, with negative consequences on the
risk of default, due to the unpredictable evolution of the RON exchange rate
against major currencies.
In addition, this situation draws an alarming increase in the number of
litigations and disputes, both in court and in the street, between customers and
banks, due mainly to requests of borrowers in foreign currency that the repayment
of loans to be made at the historical exchange rate (at the date of credit
contraction).
6 With the exception of 2013, when the entire banking system recorded a small profit. 7 Banca Comercial
ă Română: Dominic Bruynseels, Tomas Spurny, Sergiu Manea; Banca Română pentru Dezvoltare – GSG: Patrick Gelin, Guy Poupet, Philippe Lhotte etc.
13
Saving
It is well known that supporting the lending process is performed to a limited
extent on account of the own funds of credit institutions (approx. 10%- 15% of a
banks resources are represented by equity), and the bulk of lending activities is
based on funds raised by banks from retail and corporate customers (approx. 85%-
90% of total resources).
In these circumstances, the saving process is not just „rainy day money” for
those who make the effort to save, but also a process with profound implications
for a long-term healthy development of the economy.
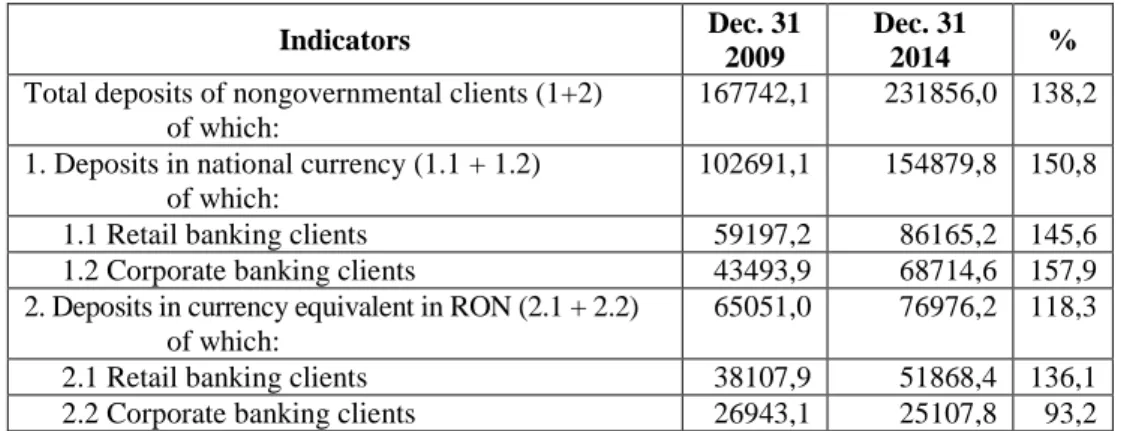
In the post-crisis period, the volume of savings expressed by deposits of
nongovernmental residents (households and firms) evolved as follows (Table no. 6):
Table no. 6
Evolution of bank deposits – mil. RON –
Indicators Dec. 31
2009
Dec. 31
2014 %
Total deposits of nongovernmental clients (1+2) of which:
167742,1 231856,0 138,2 1. Deposits in national currency (1.1 + 1.2)
of which:
102691,1 154879,8 150,8 1.1 Retail banking clients 59197,2 86165,2 145,6 1.2 Corporate banking clients 43493,9 68714,6 157,9 2. Deposits in currency equivalent in RON (2.1 + 2.2)
of which:
65051,0 76976,2 118,3 2.1 Retail banking clients 38107,9 51868,4 136,1 2.2 Corporate banking clients 26943,1 25107,8 93,2
Source: NBR – Monetary indicators 2009; 2014.
With all the difficulties caused by the crisis (cuts in salaries, pensions
taxation, unemployment, inflation, etc.), nongovernmental residents (households
and firms) continued to save, providing banks with numerous financial resource,
which unfortunately, the latter have invested less in lending and more in funding
the needs of the state, through the purchase of stocks and bonds.
A questionable issue is the investment of resources derived from customer
deposits, which usually have maturities of 1-3 years, in government securities
whose maturities are higher, 5-10 years or more, thus infringing one of the golden
rules on banks’ liquidity management.
The total volume of nongovernmental residents’ deposits increased in the
analysed period by 38.2%, of which: the ones in RON by 50.8%, while the ones in
foreign currency equivalent in RON, by 18.3%.
The process of saving was supported mainly by households, who had
suffered most from the crisis (Table no. 7):
14
Table no. 7 Structure of bank deposit holders
– mil. RON – Indicators 2009 2014 % 2014/ 2009 amount % in total amount % in total Total nongovernmental resident deposits (1+2) of which: 167742,1 100 231856,0 100 138,2
1. Household deposits (in RON or foreign currency equivalent in RON)
97305,1 58,0 138033,6 59,5 141,9
2. Corporate deposits (in RON or foreign currency equivalent in RON)
70437,0 42,0 93822,4 40,5 133,2
Source: Processed data from the NBR – Monetary indicators 2009; 2014.
The growth of household deposits in the analysed period was 41.9%, an
average annual rate of 8.3%, while growth in corporate deposits was 33.2%, with
an average annual growth rate of 6.64%.
The populations’ behaviour and efforts in the process of saving are more
laudable because, during the five years, the trend of interest was strongly
decreasing, the NBR relying, through a drastic reduction of the reference interest
rate (Table no.8), on a revival of lending, premise that has proven not to function,
the mass of credit in nominal terms only slightly increasing over the five years
(+5.9%), and in real terms, credit contracted (-12.53%).
Table no. 8 Evolution of the reference interest rate8
– % –
Indicators Reference interest rate
Beginning of the year End of the year
2009 10,25 8,00 2010 8,00 6,25 2011 6,25 6,00 2012 6,75 5,25 2013 5,25 4,00 2014 3,75 2,75 2015 2,50 1,75 (September)
Source: NBR, statistic data.
8 According O.G. no. 13 / 24.08.2011, art. 3 (1) published in the Official Gazette, no. 607/29.08.2011, as from 1 September 2011, the NBR reference interest rate is the
interest rate monetary policy, which is also the financial and legal interest for operations and for the regulation of certain financial and tax measures.
15
Some aspects in the development of the loan/deposit ratio
The structure and evolution of the loan/deposit ratio in the analysed period
highlights some remarkable aspects and even inequities related to:
•
the involvement of shareholders of Romanian banks with foreign capital in
finance/lending of the national economy;
•
unfair redistribution of resources between those who save and those
receiving funding;
•
the mainly good use of financial credit for funding budget deficits to the
detriment of lending to the economy;
•
leakage of national income across the borders through the mechanisms of
financing/refinancing and transfer pricing;
•
excessive privatization of the banking system etc.
Coverage of loans with deposits collected by local banks, calculated as the
ratio of total nongovernmental deposits and loans is as follows (Table no. 9):
Table no. 9 Coverage of loans with deposits
– % –
Indicators 2009 2014
Total coverage, of which (1+2): 83,9 109,5 1. in RON (1.1 + 1.2)
of which:
128,8 167,2
1.1 retail 152,5 199,6
1.2 corporate 106,3 132,2
2. in foreign currency equivalent in RON (2.1 + 2.2)
Of which:
54,1 64,7
2.1. retail 62,1 83,5
2.2. corporate 45,9 44,1
Source: Processed data from the NBR – Monetary indicators 2009; 2014.
If during the full economic and financial crisis loans were covered by local
deposits at a rate of only 83.9%, at the end of 2014 the situation reversed, deposits
exceeding the mass of nongovernment credit by 9.5%, the causes being multiple, of
which we mention two as being the main ones:
•
reduction of loan portfolio by removing bad loans from banks’ balance
sheets, while freezing credit activity;
•
customer behaviour, especially that of the population, which during the
crisis, continued to save “rainy day money”.
A special situation is that of loans in foreign currency which were covered by
foreign currency deposits in proportion of 54.1% in 2009 and 64.7% in 2014,
which created difficulties for customers, especially the population, which could
16
lend foreign currency, taking upon themselves the risk of the exchange rate, with
negative consequences in the future repayment capacity.
The evolution of the structure of loans coverage with deposits sows that, in
fact, shareholders of foreign banks operating in Romania have reduced to zero their
contribution of equity to debt financing of the Romanian economy, as the volume
of deposits collected locally exceeds the mass of credit (109.5% at the end of
2014).
Although through the Vienna Agreement
9, the main nine foreign banks with
subsidiaries in Romania pledged not to reduce their exposure in our country, in
reality, these exposures have been reduced steadily.
In addition, some foreign banks have issued securities directly on the
Romanian market in order to attract financial resources.
10The structure of the coverage of loans with local deposits also highlights
some inequities between customer categories that make efforts to save and those
who receive loans (Table no. 10), the disadvantaged ones being the population
which contribute with deposits larger by 34.3% than loans which they enjoy, in the
favour of companies which had deposits smaller by 13.8% than the loans they
contracted, at the end of 2014.
Table no. 10 Coverage of loans with deposits by categories of clients
– % –
Indicators 2009 2014
Total coverage, of which 83,9 109,5
retail 97,1 134,3
corporate 70,7 86,2
Source: Own calculations according to the NBR – Monetary indicators 2009; 2014.
Degree of (dis)intermediation
The degree of financial intermediation represents the level and impact
that the financial-banking assets have on the economic development and is
calculated as follows:
Dfi =
Fa
× 100
GDP
where: Dfi = degree of financial intermediation
Fa = total financial assets
GDP = Gross Domestic Product
9 The Vienna Agreement – understanding signed in Vienna in March 2009 by the nine major foreign banks with subsidiaries in Romania, under the auspices of the IMF and EC, through which foreign shareholders of Romanian banks pledged not to reduce exposures to Romania in the coming years.
10 In the summer-autumn of 2015 Erste Bank Austria launched an issue of subordinated bonds in RON on the Romanian market which amounted to 135 mil. RON with an annual output between 6.50% and 6.75%.
17
On July 30 2015, the degree of financial intermediation in Romania was
77.4%.
If out of the financial assets only banking assets are taken into account, then
the degree of banking intermediation is obtained.
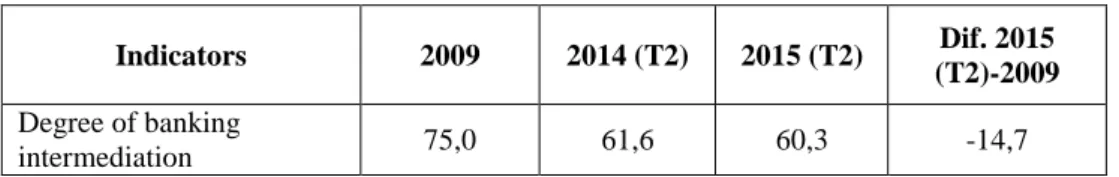
In the post-crisis period, the degree of banking intermediation in Romania
has evolved as follows (Table no. 11):
Table no. 11 Evolution of the degree of banking intermediation
– % – Indicators 2009 2014 (T2) 2015 (T2) Dif. 2015
(T2)-2009 Degree of banking
intermediation 75,0 61,6 60,3 -14,7
Source: Own calculations according to the NBR, Report on financial stability, September 2015, p. 70-80.
Therefore, the degree of financial intermediation and that of banking
intermediation, representing 78% of total financial assets, is recording a continuous
downward trend, thus occurring the phenomenon of banking disintermediation.
This, while the degree of banking intermediation in Romania is about 5 times
less than the average level of banking intermediation recorded in the EU 28
Table no. 12 Degree of banking intermediation in some EU countries – % – Indicators % EU 28 average 320 Bulgaria 121 Hungary 120 Poland 92 Lithuania 70 France 380 The Netherlands 375 Portugal 302 Austria 295 Source: NBR.
In the post-crisis period we are rather witnessing a phenomenon of
financial-banking disintermediation resulting in reducing the share of financial-financial-banking
assets relative to the GDP, the trend in Romania being opposite to the situation in
the EU 28, for which the share of banking assets in the consolidated GDP is over
320%.
18
Conclusions and proposals
The study on the evolution of financial intermediation in Romania between
2009 and 2014 highlights some conclusions and proposals, as follows:
•
the Romanian banking sector regressed in quantity in the post-crisis period,
through the disappearance from the system of some banking institutions and some
subsidiaries owned by foreign banks in Romania, and also by the reducing number
of territorial banking units (subsidiaries and agencies) and that of workplaces in the
banking system;
•
the percentage of Romanian capital(private and public) in total banking
capital is insignificant (below 10%), and the market share of banks with Romanian
private and public capital records a trend of further reduction, with negative
consequences on the effectiveness of government policies correlation with
financial-banking ones;
•
compression of financial intermediation, expressed by the reduction of the
mass of loans in real terms by 12.53% during 2009-2014, created difficulties for
the recovery of the economy which lacked financial resources, both on the
monetary market and on that of capital;
•
the further maintenance of a high share of foreign currency loans in total
nongovernmental loans (56.2% at the end of 2014), with a negative impact on the
reimbursement abilities of clients through the evolution of exchange rates of the
national currency in relation with major currencies;
•
even with all the adverse effects of the economic-financial crisis, the
population continued to save, the growth of bank deposits being higher than that of
loans, so that at the end of 2014, bank deposits have exceeded loans’ mass by
almost 10%;
•
distribution, sometimes discriminatory, of loans on customer categories in
relation to the structure of deposits, the population being disadvantaged (59.5% of
bank deposits were held in late 2014 by the population and only 48.5 of the loans’
mass was contracted by it);
•
foreign shareholders of the banks operating in Romania have continuously
reduced exposure in our country in the post-crisis period, trying to cover additional
capital requirements imposed by Basel III, through subordinated loans based on
resources collected from the local market.
In order to correct, if possible, the shortcomings that arise from the research,
it is necessary, in our opinion, to:
•
genuine involvement of banks in financing the economy through the
resumption of lending in retail and corporate, based on viable projects by targeting
lending resources to such projects, rather than to finance public deficits;
•
consolidated supervision of the financial market through a single
independent authority, to be framed by professionals in the field;
•
ensuring a stronger position of domestic capital (public and private) in total
private capital, both through redemption by the State of stakes held by foreign
investors in Romanian banks, and also through encouraging domestic capital to
establish banking companies or to takeover stakes in existing credit institutions;
19
•
promotion by the authorities of regulations designed to ensure equal
opportunities and treatment of customers in relation to banking institutions,
particularly with regard to unfair terms in contracts, partnership in taking risks,
litigations, etc.
References
•
Adrian, T. (2010). Shadow Banking System: Implications for Financial Regulation, DIANE Publishing.•
Mihai, I. (coord.) (2015) The financial market – fundamental component of the global market, Bucureşti: Editura Fundaţiei România de Mâine.•
Mihai, I. (2009) Management of banking activities, Bucureşti: Editura Fundaţiei România de Mâine.•
Mihai, I. (2007) Financinal-banking management, Bucureşti: Editura Fundaţiei România de Mâine.•
Shin, H. S. (2010), Financial intermediation and the post-crisis financial system, Bank for International Settlements, BIS Working Papers no. 304•
Yellen, J. L. (2011). Macroprudential supervision and monetary policy in the post-crisis world. Business Economics, 46(1), 3-12.•
Lehman Brothers, The most resounding bankruptcy, 15 September 2008.•
NBR, Report on financial stability, June 2009.•
NBR, Report on financial stability, August 2010.•
NBR, Report on financial stability, September 2015.•
NBR, Monetary indicators 2009.•
NBR, Monetary indicators 2014.•
NBR, Annual report on inflation 2009; 2010; 2011; 2012; 2013; 2014; 2015 (T2).•
NBR, Statistic data.•
***, Ziarul Financiar collection 2015.•
***, Law no. 227/4 July 2007 approving Government Emergency Ordinance no.99/2006 on credit institutions and capital adequacy the Official Gazette. Part I, no. 480/ 18 July 2007.