A REVIEW OF BANK PERFORMANCE
IN THE FIFTH DISTRICT, 1986
John R. Waker and David L. Mengle
Despite the heightened competition and con- tinuing adjustments resulting from the first full year of regional interstate banking, Fifth Federal Reserve District’ commercial banks produced during 1986 the highest return on assets and return on equity of the past ten years. On average, Fifth District banks’ earnings reached $1 for every $100 in assets and $15.87 for every $100 of equity. The increased prof- itability was a stark contrast to the decline to 63 cents for each $100 of assets and $10.22 for each $100 of equity experienced by the average of all banks in the United States.
A closer look at the numbers, however, reveals that the rise in return on assets was due to gains from the sale of securities, gains that were the result of falling interest rates. When securities gains are excluded, Fifth District return on assets actually declined from 1985. Since banks nationwide also benefited from securities gains, excluding such gains makes their decline in return on assets even greater. Thus, while gains on securities sales help explain why Fifth District profitability improved, they do little to explain the continuing difference between Fifth District profitability and that of the average of all U.S. banks.
As interest rates fell during 1986, District banks’ net interest margin declined significantly. The decline was largely offset by lower provision for loan and lease losses and noninterest expenses. U.S. banks on average also had a decrease in net interest margin, but had higher provision for loan and lease losses and noninterest expenses as well.
William Whelpley, formerly of the Federal Reserve Bank of Richmond, provided yeoman’s service in the construction of the data base for this article. Frank Fry, Board of Governors of the Federal Reserve System, supplied helpful advice for retrieving the data.
1 Maryland, the District of Columbia, Virginia, North Carolina, South Carolina, and most of West Virginia. At the end of 1986, there were 605 commercial banks in the Fifth District. During 1986, 25 new banks were established while 21 were mereed into other banks for a net gain of four from 1985. No FTfth District commercial banks failed in 1986.
Fifth District banks allowed their capital ratios to decline during 1986 so that at the end of 1986 capital adequacy was diminished somewhat. In contrast, U.S. banks reported increased capital ratios on average.
All ratios and figures in this article are based on book values of liabilities and assets. When interest rates vary or the economic health of borrowers declines, book values do not automatically reflect the changes. While book values are probably the best measures available to the public at this time, it is important to be aware of their limitations. The limita- tions are discussed in the box beginning on page 32 of this article.
Profits
Rettm 01z Asets Net income grew by almost 19 percent at Fifth District banks from 1985 to 1986. Table I shows that return on assets (ROA) in- creased from .98 percent in 1985 to 1.00 percent in 1986.2 For all U.S banks, net income fell by 1.2 percent, leading to a decline in ROA from .70 per- cent in 1985 to .63 percent in 1986 (see Appendix). About 8 percent of Fifth District banks reported losses in 1986, while almost 20 percent of all U.S. banks reported losses for the same period. While the average return on assets and return on equity (ROE) for Fifth District banks reached historically high levels for the year, the average figures for all U.S. banks fell to their lowest levels during the period recorded in the Appendix table.
The improvement in gains on securities relative to average assets from 1985 to 1986 figured impor- tantly in the improved profitability of Fifth District banks. Gains or losses on securities are realized when banks sell securities at prices different from their book values. Since interest rates fell during most of 1986, selling securities produced gains. Because securities gains and losses are considered to arise from factors largely outside the control of management, however, they are often excluded from ROA. Excluding them
z See the definition and discussion of return on assets and return on equity in the box on page 32.
Table I
INCOME AND EXPENSE AS A PERCENT OF AVERAGE ASSETS FIFTH DISTRICT COMMERCIAL BANKS, 1979-86
Item 1979 1980 1981 1982 1983 1984
Gross interest revenue 8.49 9.46 11.15 10.86 9.58 10.02
Gross interest expense 4.53 5.60 7.29 6.93 5.82 6.33 Net interest margin 3.96 3.86 3.86 3.93 3.76 3.69 Noninterest income 0.80 0.90 1.01 1.03 1.16 1.15
Loan and lease loss provision 0.26 0.26 0.25 0.28 0.25 0.33
Securities gains* - 0.02
Noninterest expense 3.24 3.37 3.48 3.53 3.45 3.37 Income before tax 1.26 1.13 1.14 1.15 1.22 1.12
Taxes 0.28 0.20 0.19 0.18 0.22 0.19
OtheP -0.04 - 0.04 - 0.09 -0.10 -0.02 0.00
Return on assets? 0.94 0.89 0.86 0.87 0.98 0.93 Cash dividends declared 0.30 0.32 0.33 0.37 0.34 0.31 Net retained earnings 0.64 0.57 0.53 0.50 0.64 0.62 Return on equity5
Average assets ($ millions)
9.48 5.70 3.78 1.22 0.46 0.06 3.40 1.20 0.22 0.00 0.98 0.31 0.67 15.41 8.51 4.97 3.54 1.22 0.40 0.15 \ 3.29 1.23 0.23 0.00 1.00 0.34 0.66 15.87 13.51 12.79 12.56 13.12 15.21 14.62 80,671 88,280 97,217 108,439 121,173 137,131 156,574 181,133 Note: Discrepancies due to rounding error.
1 Average assets are based on fully consolidated volumes outstanding at the beginning and at the end of the year.
2 Banks were required to report securities gains or losses above the tax line on their income statements for the first time in 1984.
B Includes securities and extraordinary gains or losses after taxes, for 1979-83 data, and extraordinary items and other adjustments after taxes for 1984-86 data.
4 Return on assets is net income divided by average assets.
5 Return on equity is net income divided by average equity. Average equity is based on fully consolidated volumes outstanding at the beginning and it the end of the year.
Source: Consolidated Reports of Condition and Income.
changes the picture for the Fifth District (Table II). Rather than increasing, ROA net of securities gains and losses fell in the Fifth District from .92 in 1985 to 25 in 1986. For all U.S. banks, the measure fell from .64 in 1985 to .50 in 1986. Note that while excluding securities gains affects the comparison be- tween performance in 1985 and in 1986, it does not affect the comparison between Fifth District banks and their peers nationwide.
Chart 1 shows ROAs (including securities gains) for three size classes of Fifth District banks. Only large banks (more than $750 million in 1986 total assets) improved their ROAs in 1986. Large banks’ ROAs averaged .97 percent in 1986 compared with .92 percent in 1985. ROA declined to 1.10 percent for medium Fifth District banks (1986 total assets between $100 million and $750 million) and to 1.17 percent at small banks (less than $100 million in total assets). Table II shows that excluding securities gains from ROA leads to decreases for all the size classes. Large banks’ ROA less securities gains fell from .85 in 1985 to .79 in 1986, while that for medium banks
1985 1986
fell from 1.13 to 1.03 and that for small banks from 1.19 to 1.09.
There were several other factors influencing the changes in ROA for the three size classes in the Fifth District. Net interest margins declined as a percent of average assets for all three. For large banks, lower loan and lease loss provisions added to ROA, while lower noninterest expenses did so for medium-sized banks. For small banks, higher loan and lease loss provisions and lower noninterest revenue helped move ROA down from the preceding year.
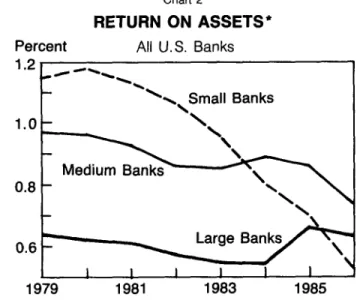
Comparing Chart 2 with Chart 1 reveals a strik- ing difference between the performance of small banks nationwide and those in the Fifth District. While Fifth District small bank ROA has remained high throughout the years shown, U.S. small banks’ average ROA ,began falling in 1981 and has dropped each year since then. The decline in prof- itability outside the Fifth District is largely due to smaller banks’ exposure to geographically limited problems such as those in agriculture and the oil industry.
Table II
PROFITABILITY MEASURES BEFORE AND AFTER ADJUSTMENT FOR SECURITIES GAINS AND LOSSES
FIFTH DISTRICT COMMERCIAL BANKS
ROA ROE
/ Sec. gains/losses Adjusted ROA Adjusted ROE Book value leverage
ROA 1.23 1.14 0.92 0.98
ROE 13.53 14.99 15.95 15.41
Sec. gains/losses 0.04 0.01 0.07 0.06
Adjusted ROA 1.19 1.13 0.85 0.92
Adjusted ROE 13.08 14.87 14.74 14.50 Book value leverage 10.98 13.11 17.42 15.68
1986
Small Medium Large Total 1.17 1.10 0.97 1.00 12.59 14.01 16.99 15.87 0.08 0.07 0.18 0.15 1.09 1.03 0.79 0.85 11.68 13.06 13.88 13.44 10.80 12.69 17.57 15.80 1985
Note: Adjusted ROA (ROE) is net income less securities gains and losses divided by average assets (equity). Leverage is average assets divided by average equity. Discrepancies are due to rounding error.
Looked at differently, in 1981 about 5 percent of all small U.S. banks had negative ROAs, while by 1986 more than 2 1 percent had moved into the loss column. In the Fifth District, in contrast, about
Chart 1
RETURN ON ASSETS*
Percent Fifth District Banks
Medium Banks
1979 1983
* Net income divided by average assets.
1985
Chat-l 2
RETURN ON ASSETS’
Percent All U.S. Banks
0.8 -
I I 1 I 1 - I I 1979 1981 1983 1985
* Net income divided by average assets.
6 percent of small banks had ROAs below zero in 198 1, but this had risen to just 10 percent by 1986. At the other end of the profitability spectrum, in 1981 approximately 60 percent of small U.S. banks had ROAs greater than 1.0 percent. But by 1986 only about 35 percent of small banks could make this claim. In the Fifth District, less than 50 percent of small banks had ROAs over 1 percent in 198 1, but this rose to 54 percent by 1986.
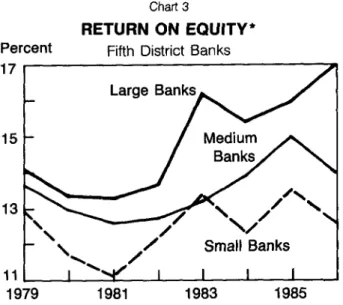
Retzln on Eq.&y Fifth District banks as a group increased average ROE from 15.4 1 percent in 1985 to 15.87 percent in 1986 (Table II). The increase reflected both higher ROA and increased leverage3 at large banks. Chart 3 shows, however, that the average ROE performance conceals the performance of small- and medium-sized banks. Excluding securities gains as in Table II would lead to a decline in ROE for all three size classes and for the average of the District.
On average, U.S. banks experienced a decline in ROE from 11.33 percent to 10.22 percent during
1986. Since leverage at the national level was vir- tually unchanged from 1985, the lower ROE simply reflects the lower ROA for all U.S. banks. During 1986 Fifth District banks lowered their ratio of retained earnings to average assets from .67 percent to .66 percent. Along with the higher ROA, this enabled banks to increase dividends from .31 percent to .34 percent relative to average assets (Table I). Banks at the national level maintained cash dividends at .33 percent of average assets and allowed retained earnings to decline to .31 percent.
3 For a definition and discussion of leverage, see page 3’2.
PROBLEMS IN MEASURING BANK PERFORMANCE
ROA or ROE? The two standard measures of bank profitability are return on assets (ROA) and return on equity (ROE).* ROA is defined as net income as a percent of average assets held during a year, that is,
ROA = Net Income . Average Assets
Average assets is the average book value of assets held at the beginning and at the end of the year. It is used because income is earned throughout the year and assets are likely to vary during the year. ROE is defined as net income as a percent of average book value of equity outstanding during a year, or
ROE _ Net Income . - Average Equity
Which is the more useful profitability measure? As will be seen, neither sums up everything.
ROA is the more straightforward measure of prof- itability because it shows profits as a yield on all a bank’s sources of value. ROA is often used to compare the performance of one bank with another or with the average of all banks. Despite its popularity, there are pitfalls in using ROA to compare banks in a particular year.
For example, a high ROA could be the result of effi- cient operations or a low cost deposit base. Importantly, it could also be the result of lending at high rates to risky borrowers. It is even possible that a small bank with low overhead expenses and access to low cost deposits might earn a high ROA by placing a high percentage of its funds in securities rather than loans. While gross returns may be lower on securities than on loans, so also may be losses and administrative expenses.
A low ROA could stem from heavy reliance on pur- chased funds or relatively high cost time deposits. It could also come from conservative lending policies that yield relatively low rates in the current year but fewer loan and lease loss provisions in future years.
ROA reflects the return to both depositors and owners. In contrast, ROE tells how effectively a bank’s assets are being used to produce income for its owners. As a guide to the profitability of a bank as an invest- ment, then, ROE appears to be more useful than ROA. Unfortunately, ROE also has pitfalls when used to compare banks. The definitions of ROA and ROE given above imply the following relationship:
ROE = ROA x Average Assets/Average Equity
l Higgins (1984, chap. 2) discusses in more detail the in- herent difficulties of various profitability measures.
where the ratio of assets to equity measures the kwage
of a bank. The relationship implies two things. First, ROE will be subject to the same disadvantages as ROA. Second, differences in leverage between banks will affect their relative ROES.
Leverage measures how much of a bank’s assets is financed by persons other than the equity owners. Because higher leverage means relatively more fiied claims on a bank’s assets by depositors, higher leverage means higher @anhal risk to the owners. In other words, leverage magnifies the effect on ROE of changes in ROA. For example, if two banks have the same positive ROA, the more leveraged will have the higher ROE. Similarly, losses will cause ROE to fall more for highly leveraged banks.
Further, large banks tend to be more highly leveraged than small banks. It does not follow, however, that large banks are necessarily more risky than small banks. While higher leverage implies higher financial risk, it says nothing about btitles~ & arising from banks’ loan, investment, and funding decisions. In fact, a large bank’s financial risk from leverage could be more than offset by lower business risk from a more diversified loan and investment portfolio. Unfortunately, neither ROA nor ROE can on its own disentangle the risk components.
There are fewer problems with using ROA and ROE to compare bank performance over time. A group of banks is subject to common influences over time, for example, changes in interest rates and in the fortunes of regional economies. Changes in ROA and ROE would express how a bank or group of banks re- sponded to the common influences. In addition, since banks following risky loan policies might also have higher loan losses over time, differences in risk be- tween banks are more likely to cancel out. That is, a bank following a high risk strategy may report higher net income (and ROA) now, but may have to set aside higher provision for loan and lease losses (and report lower net income and ROA) in later periods.
Still, there are difhculties in making comparisons over time. For example, ROA and ROE could be driven up or down by gains or losses from the sale of securities. In this case, ROA and ROE changes are more the result of interest movements and timing of securities sales than of credit or operational factors under the con- trol of management. For this reason, some analysts ex- clude securities gains and losses when calculating ROA and ROE (see Text, Table II).
Book y,lue Accounting A significant problem with ROA, ROE, and other performance measures is that they are calculated from book values of assets, liabilities, and equity. Book values fail to account for changes in the value of assets, liabilities, and equity occurring between their placement on the books of the
bank and their removal by sale, repayment, maturity, or charge-off. The failure of book values to reflect such changes in worth is a serious problem when interest rates fluctuate and when the ability of borrowers to repay debts comes into question.
The data used in the preparation of this article and in most investigations of bank performance come from the Consolidated Reports of Condition and Income (known as call reports) collected from banks by their principal regulators. The reports include a balance sheet, an income statement, and some supporting documents, all of which must be furnished quarterly by every insured bank. Call reports require banks to report book values of assets and liabilities, although market values of securities are also reported.
The book value of a loan, for example, is the amount of money originally advanced or paid for the loan minus principal repayment and minus losses that have been charged off. In the case of securities and loans pur- chased by the bank at other than par value, book value is the price paid for the security or loan plus an amount to account for the amortization of premium or the ac- cretion of discount. Book value, then, is the historic value of an asset or liability.
If banks used market value accounting, they would value their assets and liabilities at the price, or best estimate of the price, they would trade for in the market. Estimates of market value can be very accurate if there is a developed market for an asset. If there is no active or developed market for a particular asset, however, estimates of market value can be difficult. Still, even rough estimates of market value would probably provide more useful information than book values. * l
The biases inherent in book value accounting may show up in different ways. For example, suppose a bank buys a security with a yield of 10.5 percent. If market interest rates fall to, say, 9.5 percent, the market price of the security rises. Under market value accounting, reported net income in the current period would rise by the amount of the price increase, but the return on the security in the current and subsequent periods would decrease to the market level of 9.5 percent. In contrast, under book value accounting the value of the security is not adjusted, so the income from the security continues at the now above-market rate of 10.5 per- cent. Unless the bank sells the security and recognizes the capital gains, reported income in subsequent periods will be biased upwards from true economic in- come. Similarly, if interest rates rise the bank avoids * * For a discussion of the feasibility of market value account- ing as a substitute for book value accounting, see Lcreah (1986). For arguments in favor of market value accounting, see Benston et al. (1986, chap. 8).
having to book the loss, but subsequent reported returns from the security will be biased downward until the security is sold.
A more serious example of disadvantages of book value accounting arises with problem loans. Under cur- rent practices a problem loan may be carried at book value so long as it is expected to eventually be paid back in full. In practice, a banker might not set aside reserves on a problem loan unless pressured to do so by regulators. This leads to curious effects on reported ROA and ROE. By failing to adjust the reported value of a loan for anticipated losses, the bank manager avoids having to reduce current reported net income by the amount of the provision for loan and lease losses. Since the loan is a problem loan, however, current income from the loan is probably below its contracted amount. The result is an ROA biased downward from market levels. So, in this case the price of avoiding reduced current income from setting aside loss reserves is lower ROA in subsequent periods. Once a loan is written down to its estimated market value, return on the loan goes back to market levels.
A final problem with using book values in measur- ing performance arises because the value of equity out- standing is reported at book value rather than market value. Thus, ROE does not express profitability as yield realized in the market by investors. Rather, book ROES may be biased upward or downward from actual market yields depending on whether the shares of the bank would sell below or above their book values. In addi- tion, leverage measures based on book values may give a distorted picture of a bank’s true capital structure.
There are two problems with using market values of equity to compute ROE and leverage, however. First, because the shares of most banks are not ac- tively traded, there are few market transactions from which values could be inferred. Second, most actively traded shares are those of bank holding companies rather than banks, so the market value of the equity might reflect the value of several subsidiary banks as well as nonbank subsidiaries. Thus, even if one wished to use market value of equity to compute ROE and leverage, the required information might not be readily available for all banks.
References
Benston, George J., Robert A. Eisenbeis, Paul M. Horvitz, Edward J. Kane, and George G. Kaufman. Peqpectiwes on safe and Sound Banking: Past, Pment, and Future. Cambridge, Massachusetts: MIT Press, 1986.
Higgins, Robert C. Ana&isjx FinancaL Managenmt. Homewood,
Illinois: Irwin, 1984.
Lereah, David. “Current-Value Accounting: Feasibility for Finan- cial Institutions.” In Pmceedings of a Conference on Bank Stmcttm and Gnnpetihn, pp. 3 1 l-22. Federal Reserve Bank of Chicago,
1986.
Percent
Chart 3
RETURN ON EQUITY*
Fifth District Banks
Small Banks 1979 1981 1983
* Net income divided by average equity.
1985
Interest Margin
Net interest margin, the difference between in- terest income and interest expense as a percent of average assets, fell 6 percent at Fifth District banks during 1986 (Table I). The decline brought net in- terest margin to a historically low level. At all U.S. banks, net interest margin fell by 4 percent. Even with the greater decline, Fifth District banks enjoyed a 13 percent higher net interest margin than their U.S. counterparts. Net interest margin declined for all size classes of Fifth District banks, but the decline was greatest at medium-sized banks.
Falling interest rates during 1986 pushed down earnings on assets. Table III shows that earnings from loans and leases declined more than earnings from securities. The ratio of short-term maturity loans and leases to all Fifth District loans and leases was greater than the ratio of short-term securities to all securities, so the loan and lease portfolio of Fifth District banks
was more rate-sensitive than the securities portfolio. The decline in market rates therefore led to a greate:r decline in return on loans and leases than in return on securities.
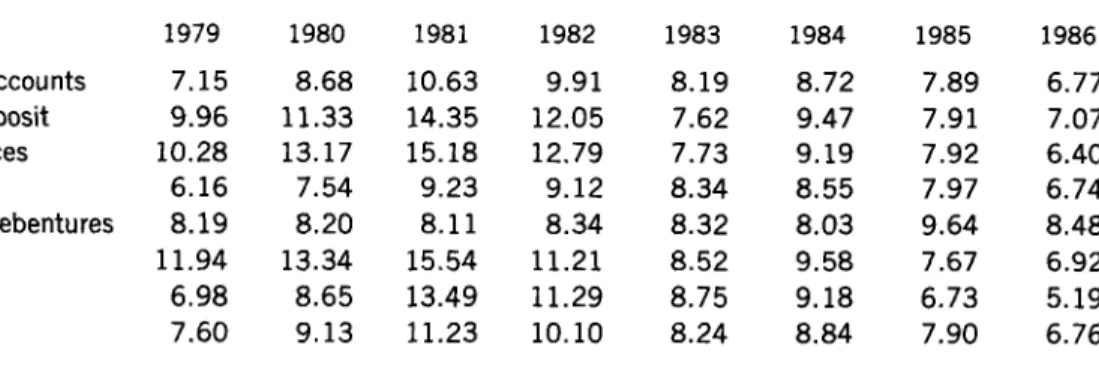
Fifth District banks’ gross interest expense ratio (interest expense as a percentage of average assets) declined by 73 basis points from 1985 to 1986. This decline, like that in interest income, was largely caused by falling interest rates. Table IV shows lower costs of all major categories of liabilities.
Noninterest Revenue and Expense
On average, Fifth District banks experienced no change in noninterest income as a percent of average assets from 1985 to 1986. Service charge and leasing income fell, while other noninterest income grew by an offsetting amount.4 At the same time, District banks were able to decrease noninterest expenses relative to average assets by 11 basis points during the year. The major part of this decrease came from a decline in salaries expense. While employ- ment by Fifth District banks actually increased by 3 percent in 1986, the number of employees per million dollars of assets fell by 11 percent.
The average results for Fifth District banks con- ceal differences between size classes. Small banks’ decline in service charges and other noninterest income was more than offset by lower salaries and other noninterest expense. Medium banks’ fall in ser- vice charge income was swamped by a decrease in salaries and bank premises expense. Large banks had stable noninterest income categories but a decline in salaries expense.
4 Other noninterest income includes such items as income from credit card fees, fiduciary activities, mortgage loan servicing fees, and safe deposit box rentals. Other noninterest expense includes such items as insurance premiums, legal fees, advertising, and charges resulting from litigation or other claims.
Table III
AVERAGE RATES OF RETURN ON SELECTED INTEREST-EARNING ASSETS FIFTH DISTRICT COMMERCIAL BANKS, 1979-86
Item 1979 1980 1981 1982 1983 1984’ 1985* 19862
Total interest-earning assets 10.09 11.28 13.18 12.68 11.11 11.77 11.06 9.78
Total loans and leases 11.25 12.50 14.48 14.14 12.38 12.59 11.92 10.63
Net loans and leases’ 11.37 12.63 14.64 14.30 12.53 12.74 12.08 10.77 Total securities 6.43 7.15 8.57 9.27 9.20 9.68 9.01 8.30
L Net loans and leases are: total loans net of allowance for loan losses for 1979-83; total loans and leases net of the sum of allowance for loan and lease losses and allocated transfer risk reserve for 1984-86.
Table IV
AVERAGE COST OF FUNDS FOR SELECTED LIABILITIES FIFTH DISTRICT COMMERCIAL BANKS, 1979-86
Item 1979 1980
Interest-bearing deposit accounts 7.15 8.68 Large certificates of deposit 9.96 11.33 Deposits in foreign offices 10.28 13.17 Other deposits 6.16 7.54 Subordinated notes and debentures 8.19 8.20
Fed funds 11.94 13.34
Other 6.98 8.65
Total 7.60 9.13
Loan and Lease Loss Provision5
Fifth District banks set aside income equivalent to .40 percent of average assets as provision for loan and lease losses, a decrease from the .46 percent set aside in 1985. As in previous years, 1986 Fifth District provision was well below that of banks na- tionwide. On average, all U.S. banks set aside in- come equivalent to .76 percent of average assets for provision in 1986 compared with .66 percent in
1985.
Chart 4 shows that in the Fifth District changes in loan and lease loss provision varied considerably with size of bank. Large banks were able to lower their provision during 1986 to .42 percent of average assets. Medium banks’ provision was unchanged be- tween 1985 and 1986 at .30 percent of average assets, while small banks increased their provision to .39 percent of average assets.
The ratio of nonperforming loans and leases6 to total loans and leases, and the ratio of loans and leases charged off (net of recoveries) to the total of loans and leases, are measures of the quality of past credit decisions. Historically Fifth District banks have had much lower levels of these ratios than the average for all U.S. banks,
. 5 Loan and lease loss provision is the income statement flow that adds to the balance sheet stock known as allowance for loan and lease losses. Provision for allocated transfer risk is included in provision for loan and lease losses, and allocated transfer risk reserve is included in allowance for loan and lease losses (except when computing capital ratios).
6 A nonperforming loan or lease is defined in this article as one that has not been charged off but is 90 days or more past due or is not accruing interest. Net charge-offs are loan and lease losses, net of loans and leases recovered, actually charged against the allowance for loan and lease losses. In other words, they are flows subtracted from the allowance.
1981 1982 10.63 9.91 14.35 12.05 15.18 12.79 9.23 9.12 8.11 8.34 15.54 11.21 13.49 11.29 11.23 10.10 1983 1984 1985 1986 8.19 8.72 7.89 6.77 7.62 9.47 7.91 7.07 7.73 9.19 7.92 6.40 8.34 8.55 7.97 6.74 8.32 8.03 9.64 8.48 8.52 9.58 7.67 6.92 8.75 9.18 6.73 5.19 8.24 8.84 7.90 6.76
In the Fifth District, nonperforming loans and leases were 1.1 percent of total loans and leases at the end of 1986, unchanged from the previous year. Net charge-offs increased over the period from .41 percent of total loans and leases to .47 percent. District banks apparently set aside sufficient provi- sion to keep allowance at about the same level relative to total loans and leases in 1986 as it had been in
1985.
For all banks in the nation, 2.8 percent of loans and leases were nonperforming, up from 2.7 percent in 1985. Charge-offs rose from .81 percent of loans and leases in 1985 to .93 percent in 1986. In addi- tion, banks at the national level increased allowance as a percentage of total loans and leases.
Chart 4
LOAN AND LEASE LOSS PROVISIONS ASAPERCENTOFAVERAGEASSETS
Percent Fifth District Banks so I
.45 t
1979 1981 1983 1985
Capital
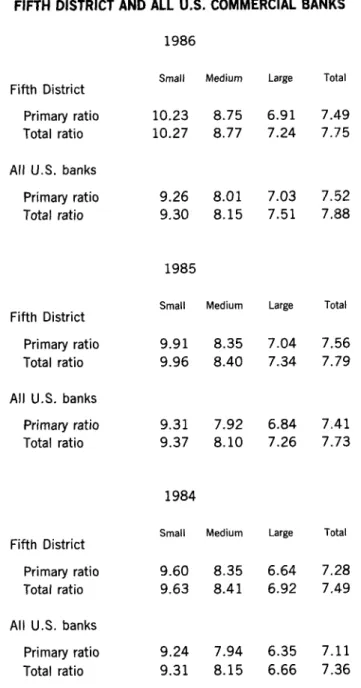
In 1986 the average Fifth District bank’s capital ratio fell slightly from its 198.5 level (Table V). Looking at each size class shows, however, that only large banks’ capital ratio fell while small- and medium-sized banks increased capital rapidly. Specifically, large banks’ primary capital to assets ratio declined from 7.04 percent at year-end 1985 to 6.91 percent at the end of 1986. Even with the decline the capital ratio of large Fifth District banks is well above what it was at the end of 1984.
At the national level banks increased their capital ratios on average. Increases took place in large- and medium-sized banks’ ratios, while for small banks capital ratios declined slightly. Because U.S. banks have been increasing capital ratios on average for the last three years, by 1986 the national average sur- passed that for Fifth District banks. Still, small- and medium-sized Fifth District banks maintained sig- nificantly higher capital ratios on average than their peers at the national level.
The components of large Fifth District banks’ primary capital that fell (relative to assets) were common stock, capital surplus, and allowance for loan and lease losses. These declines were offset to some extent by increases in undivided profits and mandatory convertible debt. Small and medium Fifth District banks improved their capital ratios by adding to common stock, surplus, undivided profits, and allowances for loan and lease losses. For all U.S. banks, common stock declined relative to assets while surplus, undivided profits, allowance for loan and lease losses, and perpetual preferred stock
increased.
Table V
CAPITAL RATIOS
FIFTH DISTRICT AND ALL U.S. COMMERCIAL BANKS
Fifth District Primary ratio Total ratio All U.S. banks
Primary ratio Total ratio
Fifth District Primary ratio Total ratio All U.S. banks
Primary ratio Total ratio
Fifth District Primary ratio Total ratio All U.S. banks
Primary ratio Total ratio 1986 Small Medium 10.23 8.75 10.27 8.77 Large 6.91 7.24 Total 7.49 * 7.75 L 9.26 8.01 9.30 8.15 1985 7.03 7.52 7.51 7.88 Small Medium 9.91 8.35 9.96 8.40 Large Total 7.04 7.56 7.34 7.79 9.31 7.92 9.37 8.10 1984 6.84 7.41 7.26 7.73 Small Medium 9.60 8.35 9.63 8.41 Large Total 6.64 7.28 6.92 7.49 9.24 7.94 6.35 7.11 9.31 8.15 6.66 7.36
Note: Primary capital here is common stock, perpetual preferred stock, surplus, undivided profits, capital reserves, mandatory convertible instruments,allowance for loan and lease losses, and minority interest In consolidated subsidaries, less in- tangible assets. Total capital includes primary capital plus limited life preferred stock and those subordinated notes and debentures not eligible for primary capital. Primary capital and total capital are divided by quarterly average assets plus allowance for loan and lease losses less intangible assets to produce primary ratio and total ratio. The measures used here correspond closely but not exactly to the different measures used by the federal bank regulatory agencies.
APPENDIX
INCOME AND EXPENSE AS A PERCENT OF AVERAGE ASSETS ALL U.S. COMMERCIAL BANKS, 1979-86’
Item 1979
Gross interest revenue Gross interest expense Net interest margin Noninterest income
Loan and lease loss provision Securities gain9
Noninterest expense Income before tax
Taxes OtherJ
Return on assets*
Cash dividends declared Net retained earnings Return on equity5
Average assets ($ billions)
8.62 9.87 11.81 11.19 5.50 6.78 8.75 8.02 3.12 3.09 3.07 3.17 0.78 0.89 0.99 1.05 0.24 0.25 0.26 0.39 2.54 2.63 2.76 2.91 1.12 1.10 1.04 0.91 0.28 0.28 0.24 0.17 -0.04 -0.03 -0.04 - 0.03 0.80 0.79 0.76 0.71 0.28 0.29 0.30 0.31 0.52 0.50 0.46 0.40 13.90 13.70 13.20 12.20 1,593 1,768 1,940 2,100 1980 1981 1982 1983 1984 9.50 10.11 6.36 6.95 3.15 3.16 1.12 1.27 0.47 0.55 -0.01 2.95 3.05 0.84 0.82 0.18 0.19 0.00 0.01 0.67 0.64 0.33 0.31 0.34 0.33 11.24 10.63 2,253 2,398 1985 1986 9.23 8.15 5.98 5.02 3.25 3.13 1.39 1.46 0.66 0.76 0.06 0.13 3.15 3.17 0.89 0.81 0.21 0.19 0.01 0.01 0.70 0.63 0.33 0.33 0.37 0.31 11.33 10.22 2,604 2,799
Note: Discrepancies due to rounding error.
1 Average assets are based on fully consolidated volumes outstanding at the beginning and at the end of the year.
2 Banks were required to report securities gains or losses above the tax line on their income statements for the first time in 1984. J Includes securities and extraordinary gains or losses after taxes, for 1979-83 data, and extraordinary items and other adjustments after taxes for 1984-86 data.
4 Return on assets is net income divided by average assets.
5 Return on equity is net income divided by average equity. Average equity is based on fully consolidated volumes outstanding at the beginning and at the end of the year.
Sources: Federal Reserve Bulletin, 1981, 1984 (1979-83 data); Consolidated Reports of Condition and Income (1984-86 data).