Aid, Conflict and Human Development
Mark McGillivrayWorld Institute for Development Economics Research United Nations University
Helsinki, Finland
and
Farhad Noorbakhsh*
Department of Economics University of Glasgow Glasgow, United Kingdom
Abstract
A large and growing literature addresses the impact of foreign aid on the growth of per capita incomes in recipient countries. While this link is important, given its implications for poverty reduction, an arguably more important link is that between aid and human development, broadly defined. This paper looks at the impact of aid on the Human Development Index (HDI), the best known and most widely used composite measure of national human development achievement. The paper is particularly interested in the impact of conflict on human development and in links between conflict, aid and human development. These relationships are examined in an econometric analysis of 2001 HDI levels in a sample of 94 developing countries. Twenty-six of these countries are conflict-affected. A number of interesting results emerge, many of which are in stark contrast with those reported in the aid-growth literature. The main findings of this analysis are that conflict and aid are negatively associated with HDI levels, and therefore, that aid does not offset the negative impact of conflict on human development. The second of these findings is puzzling, to the extent that it is inconsistent with most findings in the aid effectiveness literature. The paper also finds that aid is neither more nor less effective, in terms of its impact on human development, in conflict scenarios.
Key Words: Aid, Conflict, Human Development, Human Development Index.
JEL Codes: I31, F35, C21, C43.
An earlier version of this paper was presented at the conference, Making Peace Work, World Institute for Development Economics Research, United Nations University, Helsinki, June 4-5, 2004. Correspondence to Mark McGillivray, World Institute for Development Economics Research, United Nations University, Katajanokanlaituri 6 B, 00160 Helsinki, Finland. E-mail: [email protected].
I. Introduction
The aid-growth nexus has been extensively researched. For many decades there was little empirical clarity over this nexus based on the results of econometric studies typically conducted using cross-country, panel data sets. Some studies found that aid was positively associated with growth; others found that there was either a negative association or none at all (Cassen, 1994). A rather different picture has emerged in the literature over recent years. There is now abundant empirical evidence to suggest that aid works in the sense that it promotes growth and, by implication, reduces poverty. The well-known macro-micro paradox of aid effectiveness would appear to be dead and buried. There is evidence, albeit disputed, that impact of aid on growth is contingent on the policies of recipient countries, so that while aid works in all countries it works better in countries with better policy regimes (Burnside and Dollar, 1997a, 1997b, 2000, 2004, Collier and Dollar, 1999, 2001, 2002, Svensson, 1999, Collier and Dehn, 2001 and Collier and Hoeffler, 2002). But there is more evidence to suggest that it works in countries irrespective of the policy regime (Hansen and Tarp, 2000a, 2000b, Lensink and Morrissey, 2000, Lensink and White, 2000, 2001, Dalgaard and Hansen, 2001, Gomanee et al., 2002, Guillamont and Chauvet, 2001, Hudson and Mosley, 2001, Lu and Ram 2001, Chauvet and Guillamont, 2002, Dalgaard et al., 2002, Gounder, 2001, 2002, Mavrotas 2002 and Ram, 2003, 2004).1
The focus on growth is appropriate. A requirement for the promotion of human well-being, including poverty reduction, is rapid and sustained growth. But it must be recalled that growth is a means to an end, but not an end in its own right. As Amartya Sen notes, “Without ignoring the importance of economic growth, we must look beyond it” (Sen, 1999). It is entirely appropriate, therefore, to consider possible relationships between aid and measures of aggregate well-being. There are a number of reasons why one might observe a relationship between aid and aggregate well-being. Aid-induced increases in economic growth might lead to higher well-being through a number of mechanisms. Increased wages owing to higher labour demand and increased private and public expenditure on health and education (the former
1 Benyon (2001, 2002) and McGillivray (2003, 2004) provide surveys of the aid-growth literature and Easterly et al. (2003) and Roodman (2003) provide dissenting views on aid effectiveness.
owing to increases in taxation revenue) are among a number of possible mechanisms. Aid might also directly finance increases in expenditure on health and education, given that most aid flows in the first instance flows into the coffers of the public sector in developing countries, a fact addressed in a growing literature on the public sector fiscal response to aid (see, for example, Heller, 1975, Mosley et al., 1987, Pack and Pack, 1990, 1993, Gang and Khan, 1991, 1999, Khilji and Zampelli, 1991, 1994, Khan and Hoshino, 1992, Binh and McGillivray (1993), McGillivray (1994), Feyzioglu et al., 1998, Franco-Rodriguez et al., 1998, McGillivray and Ahmed, 1999, Franco-Rodriquez, 2000, McGillivray, 2000, McGillivray and Morrissey, 2001a, Swaroop et al., 2000, and McGillivray and Ouattara 2004).2
Three recent cross-country econometric studies have looked at possible links between aid and the Human Development Index (HDI), a well-known and widely used measure of well-being at the national level. Gomanee et al. (2003a, 2003b) looked at links between aid, pro-poor government expenditure and the HDI. Both studies found that aid was associated with higher levels of the HDI via a positive association with pro-poor government expenditure. Gomanee et al. (2003b) found that this link was stronger in countries with low HDI values, lower than the median for the sample of countries under consideration.3 Kosack (2003) looked at links
between aid, democracy and the HDI, reporting especially interesting findings. It was found that while aid was effective in promoting well-being, this was contingent on the level of democratization in the recipient country. More precisely, Kosack found that a positive link between aid and the HDI could only be observed via its interaction with various measures of democratization. Aid alone was typically judged to be negatively associated with HDI values.
This paper also looks at the impact of aid on the HDI. It too is interested in links between aid, democratization the well-being. But it is primarily interested in the impact of conflict on human development and in links between conflict, aid and human development. To this extent the paper complements Collier and Hoeffler (2002), cited above, which looks at aid, growth and policies in conflict-affected
2 McGillivray and Morrissey (2001b) provide a review of this literature.
3 Gomanee et al. (2003a, 2003b) drew the same conclusion regarding the link between aid, pro-poor expenditure and infant mortality.
countries. These relationships are examined in an econometric analysis of 2001 HDI levels in a sample of 94 developing countries. Twenty-six of these countries are conflict-affected. A number of interesting results emerge, many of which are in stark contrast with those reported in the aid-growth literature. The main findings of this analysis are that both conflict and aid are negatively associated with HDI levels. It follows aid does not offset the negative impact of conflict on human development. The paper also finds that aid is neither more nor less effective, in terms of its impact on human development, in conflict scenarios.
The paper consists of three further sections. Section II outlines the econometric model used in this paper, linking it to those typically used in the aid-growth and aid-HDI literature. Particular attention is paid to the approaches of Collier and Hoeffler (2002) and Kosack (2002). Section III discusses the data and reports the results of estimating this model. Section IV concludes.
II. Econometric Models of Aid Impact
Previous Studies: Models and Some Results
Most of the econometric models estimated in the empirical literature on aid effectiveness have the following general form:
t i m t i m t i m t i t i x a y, =α+β1' ,− +β2'Φ,− +β3' ,− +µ, (1)
where yi,t is either real per capita GDP growth or the HDI in recipient country i in
period t, ai,t-m is a q × 1 vector of measures aid to i in period t-m, Φi,t-m is a p × 1 vector
of terms capturing interactions between aid and other variables which might affect
yi,t,, xi,t-m is a k × 1 vector of exogenous variables that might affect yi,t and under
certain circumstances ai,t-m, µit is a residual term with a mean and variance respectively
equal to zero and one, α is a constant term, β1, β2 and β3 are vectors of slope
coefficients, i = 1, …, n and m ≥ 0. The interaction terms are typically of the simple form a × z, where the latter is a measure of the variable aid is thought to interact with. Variables capturing initial conditions and those with which aid interacts are often included in the vector xi,t-m. The initial conditions variable in the aid-growth
literature is typically initial per capita incomes and in Kosack (2002) it is initial HDI values.
The aid variable vector ati,t-m contains either or both aid as a percentage of
recipient country GDP and aid as a percentage of recipient country GDP raised to the power of two. Collier and Hoeffler (2002) used the second of these variables only, on the assumption that aid alone is ineffective in affecting yi,t, up to a particular
saturation point, after which aid negatively affects yi,t. In that study yi,t is real per
capita GDP growth. Alternatively, fitted values of these variables, obtained by standard econometric procedures, are used if aid is thought to be endogenously determined. Kosack (2002) reports two sets of results, in which actual and fitted values of aid as a percentage of GDP are respectively employed. The same basic conclusions were drawn from each set of results. m was set at zero in both studies, as is typically the case.
The vector Φi,t-n usually contains a single element only, which in most growth
studies is an interaction term between aid and some measure of the quality of recipient country economic policies. Many aid-growth studies measure policy quality using a weighted average of indicators of inflation, foreign trade openness and public sector budget surplus. Studies emanating from the World Bank typically use that organisation’s Country Policy and Institutional Assessment (CPIA) measure (for example, Collier and Dollar, 1999, 2001, 2002, Collier and Dehn, 2001, Collier and Hoeffler, 2002). Svensson (1999) interacted aid, separately, with the Freedom House measure of democracy and a measure of economic policy which takes into account exchange rate distortions, financial depth and the government budget surplus.
Collier and Hoeffler (2002) used six aid interaction terms. Three were double interactions, between aid or aid-squared and various binary, conflict-related measures. These measures related to various post-conflict episodes, each corresponding to the number of years since the end of civil war. A country was considered to have been in a civil war, and thus in conflict, if it ‘experienced an internal conflict between a government and an identifiable rebel organisation that results in at least 1000 combat-related deaths, of which at least 5% must be incurred on each side” (Collier and Hoeffler, 2002, p. 3). The remaining three interaction terms were triple in nature, in which aid, policy and binary indicators of various post-conflict episodes each interacted. Of the six corresponding slope coefficients estimated, the only significant coefficient was that attached to the triple interaction
between aid, policies and a dummy variable taking the value if a country was in the third to sixth year of a post-conflict decade or zero otherwise. As this coefficient was positive, Collier and Hoeffler concluded that aid was especially effective in promoting growth in these countries up to a certain saturation level of aid.4 More
precisely, the results indicated that aid is more than twice as productive in such a post-conflict episode.
Kosack (2002) interacted aid, measured as a ratio of GDP, with one of three alternative democratization variables. These variables were the Polity IV measure provided by Marshall and Jaggers (2000), the freedom scales provided by Freedom House (Gastil, various years) and the binary measure of Przeworski et al. (2000). Kosack’s econometric estimates, obtained from a regression equation without interaction terms, indicated that aid has no impact on HDI values. But when an interaction term was included, the coefficient on the aid variable was found to be negative and significant, while that attached to the interaction term was found to be positive and significant. The same results were obtained for a sub-sample consisting of low-income countries only, when aid was disaggregated into that from bilateral and multilateral agencies, respectively and when aid was treated as endogenous. These results were reasonably robust with respect to the choice of democratization variable used in the interaction term and in the vector of other exogenous variables. The Freedom House and Polity IV measures actually yielded identical results overall, in terms of conclusions drawn. Results obtained from the Przeworski et al. measure where close to identical, except that the coefficient on the aid variable was insignificant when the interaction term was included in the regression equation.
The elements of the other exogenous variables vector, xi,t-m, vary
tremendously among studies, depending inter alia on whether aid is treated as exogenous or endogenous and on the specific interest of the study under consideration. Collier and Hoeffler (2002) used a governance indicator, the number of war months and various regional dummies in addition to the above mentioned post-conflict episode dummies. Kosack (2002) used arms imports, a measure of institutional quality, the public sector budget surplus, the terms of trade, a measure of
4 The saturation level was estimated to be 5.59 times each post-conflict country’s CPIA score.
openness, the above mentioned democratization measures and various regional and geo-political indicators.
Aid, Conflict and the HDI
Building largely on Collier and Hoeffler (2002) and Kosack (2002), we posit the following empirical model of aid, conflict and human development:
t i m t i m t i m t i m t i t i c a x HDI , , ' 4 , ' 3 , 2 , 1 , =α+β − +β − +β − +β Φ − +µ (2)
where HDIi,t is the human development index for aid-receiving county i period t, ci,t-m
is some measure of conflict, ai,t-m is aid to i as a ratio of its GDP, β1 andβ2 are slope
coefficients and the remaining terms are as per equation (1) above. The elements of
xi,t-m include democracy and governance variables and the ratio of investment to
GDP. Further details of this vector are given in the next section. Three alternative conflict variables are employed. The first is a dummy variable, taking value of one is i
experienced a civil war of any level of intensity during 1999 to 2001 or zero if otherwise. The second is also a dummy variable, which takes a value of one if i was engaged in a high intensity conflict, defined as one involving more than 1000 deaths. This corresponds to the definition of conflict used by Collier and Hoeffler (2002). The third is the first of these dummies, but weighted according to the level of intensity. Three aid interaction terms are employed, in which aid interacts with the chosen measure of democratization, the conflict and democratization and conflict. It follows that the last of these terms is a triple interaction.
Some comments relating to the interpretation of the HDI, for our current purposes, are warranted. The HDI can be written as follows:
where Ij,i is the jth index component for country i, and i =1, ..., r. There are three
component indices: longevity (I1,i), educational attainment (I2,i) and income or
(material) standard of living (I3,i). Each of the variables comprising these indices are
scaled within the range of zero to one using the equation: I g = HDI j,i g = j i
∑
1 1 (3)where Hj,v,i is the vth component of Ij,i for country i, hj,v,i is the value of that
component prior to scaling, and the remaining variables are Amaximum@ and
“minimum” values of hj,i , although these values are fixed by the UNDP. The
longevity index (I1,i) is a linear function one variable only (H1,i): the number of years a
newborn infant would be expected to live based on current mortality patterns. The minimum and maximum values used to scale this variable are 25 and 85 years, respectively. The educational attainment index (I2,i) is defined as follows:
where α1 and α2 are weights set at two-thirds and one-third respectively, h2,1,i is
country i=s adult literacy rate and h2,2,i is that county=s combined primary, secondary
and tertiary enrolment ratio. The maximum and minimum values of these variables used in scaling are 0% and 100% for each, respectively. The material standard of living index (I2,i) is also based on a single variable (h3,1,i) obtained by taking the
logarithm of purchasing power parity (PPP) GDP per capita. The minimum and maximum values of h3,1 used to obtain H3,1,i are the logarithms of $100 and $40000,
respectively (UNDP, 2003).
While the HDI is arguably the best known and most widely used composite indicator of aggregate well-being or human development, it has been heavily criticised (see, for example, Acharya and Wall, 1994, Cahil, 2002, 2004, Gormely, 1995, Hicks, 1997, Ivanova et al., 1998, Lüchters and Menkhoff, 1996, 2000, Morse, 2003, McGillivray, 1991, 2003, McGillivray and White, 1993, 1994, Murray, 1991, Neumayer, 2001, Noorbakhsh, 1998a, 1998b, and Sagar and Najam, 1998). Among the criticisms of the index are the assigning of equal weights to each component, the universalism associated with applying a common set of variables to a diverse set of countries, the scaling of variables and the treatment of the income component. The UNDP has, though, responded to many of these criticisms and improved the index in many ways and the index is widely used, increasingly so, by researchers (see, for example, Noorbakhsh, 1999, 2000, 2003 and McGillivray, 2005). One should not
min , max , min , , v j v j v j i v, j, i v j, h -h h -h = H (4) I1i,=α1H2,1,i+α2H2,2,i (5)
however be blind to remaining criticisms of the index in interpreting the results presented later in this paper.
Importantly, the interpretation given to the HDI in this paper is that it is a measure of latent, unobservable well-being which is uni-dimensional. The various components of the HDI collectively attempt to capture this latent variable, but are not in themselves measures of distinct well-being dimensions. Should these dimensions be treated otherwise, then one would need to apply a variant of equation (2) to each of the HDI components individually, and failure to do so would give rise to the issue of aggregation bias in the coefficients of (2). Thus the interpretation of the HDI as a measure of a single, latent well-being variable would appear to be crucial.
III. Data and Results
Equation (3) was estimated using HDI data for 2001. These data were obtained from UNDP (2003). A sample of up to 93 low- and middle-HDI countries was employed, which includes 26 conflict-affected countries. All conflict data were taken from PRIO (2003). The conflict intensity variable available from this source takes three values only - one, two or three. A value of three is assigned if the conflict is high intensity, as defined above. The aid data relate to the sum of aid to country i
during 1975 to 1999. Thus the coefficient β1 captures lagged cumulative impacts of
aid on i’s level of human development. The aid data were obtained from World Bank (2002). The investment data also relate to the period 1975 to 1999. They are the average for this period and are taken from World Bank (2002a). The democratization variable employed is the Polity IV measure covering 1990 to 2000, which was obtained from CIDCM (2002). The governance variable is the government effectiveness score for 1996 to 2000, reported in World Bank (2002b). All remaining data were obtained from World Bank (2002a).
Variants of equation (2) were estimated using the ordinary least squares (OLS) and two-stage least squares methods (2SLS). The 2SLS estimation is based on the assumption that the aid variable is endogenous. This is a fairly common assumption in the literature. It is based on the view that donors might give preference to countries with low rates of growth in real GDP per capita or to
countries with low HDIs. This would appear to be a questionable assumption, however, on the grounds that donor aid allocation decisions are subject to informational, decision and execution time lags. Donor decisions regarding aid allocations will have been made well prior to the determination of growth rates or HDI levels. A donor might contemporaneously adjust an aid allocation to some country based on current HDI or growth information, giving rise to the issue of endogeneity, but such events tend to be rare. A better case for treating aid as endogenous, in the current context, is that a recipient countries ability to disburse aid allocated to it is determined by the level of its HDI. Better education levels, better health and higher incomes all contribute to a country’s ability to disburse aid made available to it by donor countries. Of course the reverse argument might apply, with countries with low HDIs having a greater incentive to disburse aid allocations, and that donors allocate more effort to assisting these countries disburse aid amounts. Irrespective of what might be true, it is still useful to compare results obtained from the 2SLS method to those obtained from OLS as a robustness check.
The explanatory variables used in the first stage regression were: the sum of FDI as a percentage of GDP during the period 1975 to 1999, the sum of trade as a percentage of GDP during the period 1975 to 1999, average public expenditure on health and education during 1990 to 1999, daily newspaper circulation per head of 1000 population during 1990 to 1999, the average inflation rate during 1990 to 1999, the sum of political stability and governance scores for 1996 to 2000, control of corruption and rule of law scores for 1996 to 2000, a dummy variable for Egypt and Latin American and African regional dummies.
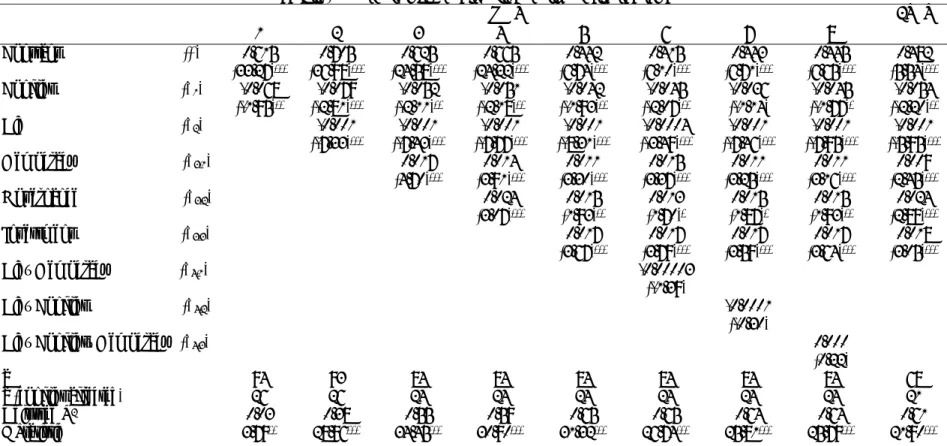
Results are shown below in Tables 1 to 3 of the Appendix.5 Table 1 contains
results corresponding to the first conflict variable, defined above as a binary dummy, taking value of one is i experienced a civil war of any level of intensity during 1999 to 2001 or zero if otherwise. The estimation approach taken was to first restrict all slope coefficients other than that attached to the conflict variable to zero, and then successfully relax these restrictions until a close to fully specified equation was
5 The variables used in the first stage equation also appear in the second equation, as per standard econometric practice. Results regarding the estimation of their coefficients are available from the authors.
estimated. Not surprisingly, in the first round of estimation the coefficient attached to the conflict variable (β1) is negatively and significantly associated with the HDI:
countries that have experienced conflict in the preceding three years conflict have lower HDI levels than those that have not. There are of course many other determinants of HDI levels across countries, so not at all surprisingly the adjusted functional fit (R2) is extremely low. Indeed, the presence of conflict as defined
explains only three percent of the variation of HDI levels in the sample of countries under consideration. The restriction attached to the aid variable coefficient (β2) was
removed in the second round of estimation. As is shown in Table 1, β2 is significant
and negative: aid is negatively associated with HDI levels. Both of these results, for the aid and conflict variables, seem to be quite robust. As the restrictions are progressively relaxed, both the signs and significance levels of β1 and β2 are
maintained in the OLS estimations. The only exception is round 7, in which β1 does
not maintain its statistical significant, possibly due to collinearity with the aid-conflict interaction term. Moreover, both β1 and β2 are also significant and negative in the
2SLS estimation of equation (2). These results therefore seem robust to the possible endogeneity of the aid variable, therefore.
That β2 is significant and negative conforms to the results obtained in Kosack
(2002). Kosack also found that democracy and aid-democracy interaction were significantly associated with HDI levels, but with the signs attached to these variables being negative and positive, respectively. The parameters shown in Table 1 conform to neither of these results. That attached to the democracy variable (β3,1) is
significant and positive in each round of estimation, while that attached to the aid-democracy interaction (β4,1) is statistically insignificant. Also insignificant are the
coefficients attached to the aid-conflict and aid-conflict-democracy interactions (β4,2
and β4,3) The coefficient attached to investment (β3,3) is positive and significant
throughout. Interestingly, the coefficient attached to the governance variable (β3,2) is
positive and significant in each round in which it was estimated. This contrasts to a finding of Collier and Hoeffler (2002). The coefficient attached to their measure of governance (the International Country Risk Guide measure used in Collier and Dollar, 2002) was found to be statistically insignificant.
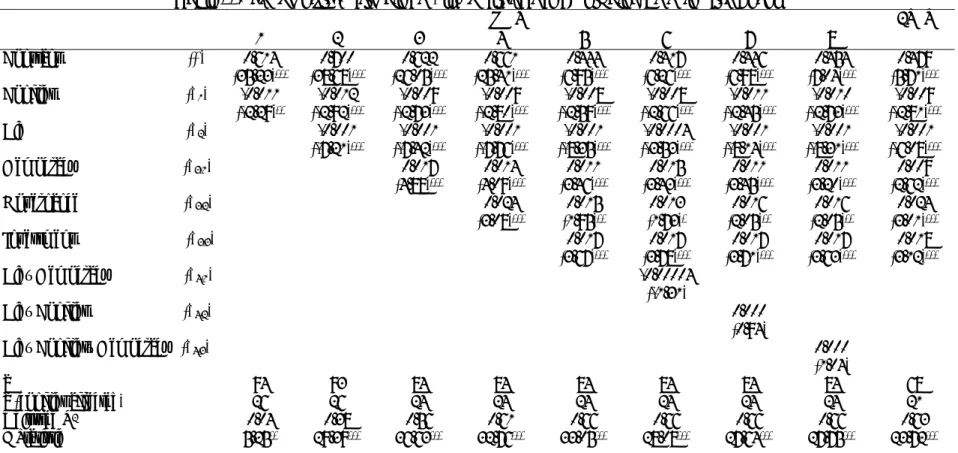
variables, defined above, are shown in Tables 2 and 3, respectively. Strikingly similar results, to those reported in Table 1, are reported and the same conclusions can be drawn from them. In particular, the statistically significant, negative associations between aid and HDI values and aid and conflict seem to be robust with respect to the choice of conflict variables. At very least, these associations are robust with respect to the conflict variables utilized in this paper. 6
That the HDI is negatively associated with conflict and positively associated with governance, democracy and investment is hardly surprising. That aid is negatively associated with HDI values is rather perplexing. How might this outcome have arisen? This is not an easy question to answer, in part because of the types of econometric models used in the literature, including that used in the current paper. These models are either reduced-forms, or very simple (partially specified) structural equations which suppress the complex channels through which aid might affect the dependent variable under consideration.
We are left to speculate as to how certain results might have emerged, therefore. One is tempted to conclude that it is because countries with low HDI values receive larger amounts of aid. But this outcome is controlled for in the 2SLS estimation, which still yields a negative and significant aid variable coefficient. The Kosack (2002) interpretation of this result turns on his finding that the aid-democracy interaction is positive. This is taken to indicate that the presence of an autocracy is bad for human development. Due to the lack of competitive elections, political participation, a free press and the absence of opposition parties, autocracies have the ability over time to spend less on social programs, and hence HDI values would be expected to be lower in these societies. By extension, they might over time consistently allocate fewer aid funds to, or greater funds away from, these programs, hence leading to a possible negative relationship between aid and HDI levels in them. Looking closely at the t-ratios for the aid-democracy interaction (β4,1) in Tables 1 to 3,
one observes that they are significantly different from zero at the 85 percent confidence level. This level of significance is rarely relied upon to deem a coefficient statistically significant, providing rather weak case for rejecting the corresponding
6 Although not reported here, a models with 1995 HDI values were used to capture initial conditions. This did not alter the results reported in Tables 1 to 3.
null hypothesis. Yet if we were to rely on it, we would deem the β4,1 significant and
negative, which would suggest that aid contributes to lower HDI values than would otherwise be the case in democracies. Surely this cannot be the case. Another, more plausible, explanation is that in the countries comprising our sample, that aid funds are allocated away from social programs, at least in the short term, to other programs. This might be good for growth but not for human development.
IV. Conclusion
This paper looked at the impacts of conflict and aid on human development achievement at the national level, measured the HDI. It was particularly interested in the impact of conflict on human development and in links between conflict, aid and human development. These relationships were examined in an econometric analysis of 2001 HDI levels in a sample of 94 developing countries. Twenty-six of these countries are conflict-affected. A number of interesting results emerge, many of which are in stark contrast with those reported in the aid-growth literature. The main findings of this analysis were that conflict and aid are negatively associated with HDI levels. The first of these conclusions is not surprising. The second is striking, and one that is worthy of far more empirical investigation. If further research also draws this conclusion one would be justified in concluding that aid does not seem to offset the negative impact of conflict on human development. The paper also found that aid is neither more nor less effective, in terms of its impact on human development, in conflict scenarios.
References
Acharya, A. and H..J. Wall, (1994), “An Evaluation of the United Nations= Human
Development Index”, Journal of Economic and Social Development, Vol. 20, issue 1, pp. 51-65.
Beynon, J. (2001), “Policy Implications for Aid Allocations of Recent Research on Aid Effectiveness and Selectivity”, Paper presented at the Joint Development Centre/DAC Experts Seminar on Aid Effectiveness, Selectivity and Poor Performers, January, OECD, Paris.
Beynon, J. (2002), “Policy Implications for Aid Allocations of Recent Research on Aid Effectiveness and Selectivity”, in B. Mak Arvin (editor), New Perspectives
on Foreign Aid and Economic Development, Praeger, Westport.
Binh, T.N. and M. McGillivray (1993), “Foreign Aid, Taxes, and Public Investment: A Comment”, Journal of Development Economics 41(1): 173-176.
Burnside, C. and D. Dollar (2000), "Aid, Policies and Growth”, American Economic
Review, Vol.90, No.4, pp.847-868.
Burnside, C. and D. Dollar (1997a), Aid, Policies and Growth, Policy Research Working Paper No. 1777, World Bank, Washington.
Burnside, C. and D. Dollar (1997b), “Aid Spurs Growth – In a Sound Policy Environment”, Finance and Development, Vol. 34, pp. 4-7.
Cahill, M. (2002), ADiminishing Returns to GDP and the Human Development
Index@, Applied Economics Letters, Vol. 9, No. 13, pp. 885-887.
Cahill, M (2004), >Is the Human Development Index Redundant?=, Eastern Economic Journal, forthcoming.
Cassen, R. and Associates (1994), Does Aid Work? Second Edition, Clarendon Press, Oxford.
CIDCM (Centre for International Development and Conflict Management – University of Maryland) (2002), Polity IV Project, www.cidcm.umd.edu/inscr/polity.
Chauvet, L. and P. Guillaumont (2002), “Aid and Growth Revisited: Policy, Economic Vulnerability and Political Instability”, Paper present at the Annual Bank Conference or Development Economics on Towards Pro-poor Policies, June, Oslo.
Collier, P. and J. Dehn (2001), Aid, Shocks, and Growth, World Bank Policy Research Working Paper No. 2688, World Bank, Washington.
Collier, P. and D. Dollar (1999), Aid Allocation and Poverty Reduction, Policy Research Working Paper No. 2041, World Bank, Washington.
Collier, P. and D. Dollar (2001), “Can the World Cut Poverty in Half? How Policy Reform and Effective Aid Can Meet International Development Goals”,
World Development, Vol. 29, No. 11, pp. 1787-1802.
Economic Review, Vol. 26, pp. 1475-1500.
Collier, P. and A. Hoeffler (2002), Aid, Policy, and Growth in Post-Conflict Societies, Policy Research Working Paper No. 2902, World Bank, Washington
Dalgaard, C. and H. Hansen (2001), "On Aid, Growth and Good Policies”, Journal of
Development Studies, Vol.37, No.6, pp.17-35.
Dalgaard, C., H. Hansen and F. Tarp (2002), On the Empirics of Foreign Aid and Growth, CREDIT Research Paper, Centre for Research in Economic Development and International Trade, University of Nottingham, Nottingham.
Feyzioglu, T., V. Swaroop and M. Zhu (1998), "A Panel Data Analysis of the Fungibility of Foreign Aid", World Bank Economic Review, Vol.12, No.1, pp.29-58.
Franco-Rodriguez, S (2000), “Recent Advances in Fiscal Response Models with an Application to Costa Rica”, Journal of International Development, Vol. 12, No. 3, pp. 429-442.
Franco-Rodriguez, S., M. McGillivray and O. Morrissey (1998), “Aid and the Public Sector in Pakistan: Evidence with Endogenous Aid”, World Development, Vol.26, pp.1241-1250.
Gang, I. and H. A. Khan. (1991), “Foreign Aid, Taxes and Public Investment”,
Journal of Development Economics,Vol. 34, No. 1, pp. 355-69.
Gang, I.N. and H.A. Khan (1999), “Foreign Aid and Fiscal Behaviour in a Bounded Rationality Model: Different Policy Regimes”, Empirical Economics, 24, 121-134.
Gastil, R.D. (various years), Freedom in the World, Freedom House, New York.
Gomanee, K., S. Girma and O. Morrissey (2002), Aid and Growth in Sub-Saharan
Africa: Accounting for Transmission Mechanisms, CREDIT Research Paper 02/05,
Centre for Research in Economic Development and International Trade, University of Nottingham, Nottingham.
Gomanee, K., O. Morrissey, P. Mosley and A. Verschoor (2003a), Aid, Pro-poor
Government Spending and Welfare, CREDIT Research Paper 03/01, Centre for
Research in Economic Development and International Trade, University of Nottingham, Nottingham.
Gomanee, K., S. Girma and O. Morrissey (2003b), Aid, Public Spending and Human
Welfare: Evidence from Quantile Regressions, CREDIT Research Paper 03/13,
Centre for Research in Economic Development and International Trade, University of Nottingham, Nottingham.
Gormely, P.J. (1995), AThe Human Development Index in 1994: Impact of Income
on Country Rank@, Journal of Economic and Social Measurement, Vol. 21, pp.
253-267.
Guillaumont, P. and L. Chauvet (2001), "Aid and Performance: A Reassessment”,
Journal of Development Studies, Vol.37, No.6, pp.66-87.
Development, Vol.12, pp.375-398.
Hansen, H. and F. Tarp (2000b), "Aid and Growth Regressions”, Journal of
Development Economics, Vol.64, pp.547-570.
Henderson, P.D. (1971), "The Distribution of Official Development Assistance Commitments by Recipient Countries and by Sources", Oxford Bulletin of
Economics and Statistics, Vol. 33, No. 1, February, pp. 1-11.
Hicks, D. A., (1997), AThe Inequality Adjusted Human Development Index: A
Constructive Proposal@, World Development, Vol. 25, No. 8, pp. 1283-1298.
Hudson, J. and P. Mosley (2001), "Aid, Policies and Growth: In Search of the Holy Grail”, Journal of International Development, Vol.13, pp.1023-1038.
Ivanova, I., F.J. Arcelus and G. Srinivasan, (1998), AAn Assessment of the
Measurement Properties of the Human Development Index@, Social Indicators
Research, Vol. 46, pp. 157-179.
Khan, H.A. and E. Hoshino (1992), “Impact of Foreign Aid on the Fiscal Behaviour of LDC Governments”, World Development, Vol. 20, pp.1481-1488.
Khilji, N. and E. Zampeli. (1994), “The Fungibility of US Military and Non-Military Assistance and the Impacts on Expenditures of Major Aid Recipients”,
Journal of Development Economics, Vol.43, pp. 345-362.
Kosack, S. (2003), AEffective Aid: How Democracy Allows Development Aid to
Improve the Quality of Life@, World Development, Vol. 31, No. 1, pp. 1-22.
Lensink, R. and O. Morrissey (2000), "Aid Instability as a Measure of Uncertainty and the Positive Impact of Aid on Growth”, Journal of Development Studies, Vol.36, No.3, pp.31-49.
Lensink, R. and H. White (2000), "Assessing Aid: A Manifesto for the 21st Century?”, Oxford Development Studies, Vol.28, No.1, pp.5-18.
Lensink, R. and H. White (2001), "Are There Negative Returns to Aid?”, Journal of
Development Studies, Vol.37, No.6, pp.42-64.
Lu, S. and R. Ram (2001), "Foreign Aid, Government Policies and Economic Growth: Further Evidence from Cross-country Panel Data for 1970 to 1993”, International Economics, Vol.54, pp.15-29.
Lüchters G. and L. Menkhoff, (1996), AHuman Development as a Statistical
Artifact@, World Development, Vol. 24, No. 8, pp. 1385-1392.
Lüchters G. and L. Menkhoff, (2000), AChaotic Signs from HDI Measurement@,
Applied Economics Letters, Vol. 7, No. 4, pp. 267-270.
Marshall, M.G. and Jaggers, K. (2000), Polity IV Projewct: Dataset Users’ Manual, University of Maryland, College Park.
Mavrotas, G (2002), “Aid and Growth in India: Some Evidence from Disaggregated Aid Data”, South Asia Economic Journal, Vol. 3, No. 1, pp. 19-49.
McGillivray, M., (1991), AThe Human Development Index: Yet Another Redundant
1451-1460.
McGillivray, M. (1994), “The Impact of Foreign Aid on the Fiscal Behaviour of Asian LDC Governments: A Comment on Khan and Hoshino (1992)”,
World Development, Vol. 22, No. 12, pp. 2015-2017.
McGillivray, M, (2000), “Aid and Public Sector Fiscal Behaviour in Developing Countries”, Review of Development Economics, Vol.4, No. 2, pp.156-163.
McGillivray, M (2003), “Aid Effectiveness and Selectivity: Integrating Multiple Objectives in Aid Allocations”, Paper presented at the Joint OECD DAC/Development Centre Aid Experts’ Seminar, OECD Heasquarters, Paris, March 10, 2003.
McGillivray, M. (2004), “Aid Effectiveness and Selectivity: Towards a Broader Framework” (in French), Revue d'Economie du Développement, forthcoming. McGillivray, M. (2005), “Measuring non-Economic Well-being Achievement”, Review
of Income and Wealth, forthcoming.
McGillivray, M. and A. Ahmed (1999), “Aid, Adjustment and Public Sector Fiscal Behaviour in the Philippines”, Journal of the Asia-Pacific Economy, 4, 381-391. McGillivray, M. and O. Morrissey (2001a), “Aid Illusion and Public Sector Fiscal
Behaviour”, Journal of Development Studies, Vol. 37, No. 6, pp. 118-136.
McGillivray, M. and O. Morrissey (2001b), Fiscal Effects of Aid, WIDER Discussion Paper No. 2001/61, World Institute for Development Economics Research, Helsinki.
McGillivray, M. and H. White, (1993), AMeasuring Development? The UNDP=s
Human Development Index@, Journal of International Development, Vol. 5. No.
2, pp. 183-192.
Morse, S. (2003), AFor Better or for Worse, till the Human Development Index do
us Part?@, Ecological Economics, Vol. 45, Issue 2, pp. 281-296.
Mosley, P., J. Hudson, S. Horrel (1987), “Aid, the Public Sector and the Market in Less Developed Economies”, The Economic Journal, 97, 616-641.
Murray, C.J.L., (1991), Development Data Constraints and the Human Development Index, United Nations Research Institute for Social Development, Discussion Paper 25, Geneva.
Neumayer, E., (2001), AThe Human Development Index and Sustainability - A
Constructive Proposal@, Ecological Economics, Vol. 39, pp. 101-114.
Noorbakhsh, F., (1998a), AA Modified Human Development Index@, World
Development, Vol. 26, No. 3, pp. 517-528.
Noorbakhsh, F., (1998b), AA Human Development Index: Some Technical Issues
and Alternative Indices@, Journal of International Development, Vol. 10, pp.
589-605.
Noorbakhsh, F. (1999) “Standards of Living, Human Development Indices and Structural Adjustments in Developing Countries: An Empirical Investigation”, Journal of International Development, 11(1).
Noorbakhsh, F., (2002), AHuman Development and Regional Disparities in Iran: A
Policy Model@, Journal of International Development, Vol. 14, pp. 927-949.
Noorbakhsh, F. (2003), “Human Development, Poverty and Disparities in the States of India”. Paper presented in the United Nations University, World Institute for Development Economic Research - “Inequality, Poverty and Human Well-being” Conference, 30-31 May 2003, Helsinki, Finland.
Ogwang, T., (1994), AThe Choice of Principal Variables for Computing the Human
Development Index@, World Development, Vol. 22, No. 12, pp. 2011-2114.
Pack, H. and J.R. Pack (1990), “Is Foreign Aid Fungible? The Case of Indonesia”,
Economic Journal, Vol. 100, pp.188-194.
Pack, H. and J.R. Pack (1993), “Foreign Aid and the Question of Fungibility”, Review of Economics and Statistics, Vol. 75, pp. 258-265.
Przeworski, A., M.E. Alvarez, J.E. Cheibub, F. Limongi (2000), Democracy and Development: Political Institutions and Material Well-being in the World, 1950-1990,
Cambridge University Press, New York.
Ram, R. (2003), “Roles of Bilateral and Multilateral Aid in Economic Growth of Developing Countries”, Kyklos, Vol. 56, pp. 95-110.
Ram, R. (2004), “Recipient Country’s ‘Policies’ and the Effect of Foreign Aid on Economic Growth in Developing Countries: Additional Evidence”, Journal of
International Development, Vol. 16, pp. 201-211.
Sagar, A. and A. Najam, (1998), AThe Human Development Index: A Critical
Review@, Ecological Economics, Vol. 25, pp. 249-264.
Sen, A. (1999), Development as Freedom, Alfred A. Knopf, New York.
Swaroop, V., S. Jha and A. Rajkumar (2000), "Fiscal Effects of Foreign Aid in a Federal System of Governance: The Case of India”, Journal of Public Economics, Vol.77, pp.307-330.
UNDP (United Nations Development Programme) (2003), Human Development Report
2003, Oxford University Press, New York.
World Bank (2002a), World Development Indicators, Oxford University Press, New York.
World Bank (2002b), World Bank Public Sector Governance Group Governance Data, http://www.worldbank.org/wbi/governance/govdata2002/
Appendix: Results of Econometric Analysis
Table 1: Econometric Estimates – All Conflict Types
OLS 2SLS 1 2 3 4 5 6 7 8 Constant (α) 0.615 (33.27)*** 0.705 (36.98)*** 0.625 (24.58)*** 0.665 (24.22)*** 0.442 (6.74)*** 0.415 (6.10)*** 0.443 (6.71)*** 0.445 (6.65)*** 0.482 (5.54)*** Conflict (β1) -0.068 (-1.95)** -0.079 (-2.81)*** -0.052 (-2.11)** -0.051 (-2.18)** -0.042 (-1.93)** -0.045 (-2.07)** -0.036 (-1.14) (-1.77)-0.045 * -0.054 (-2.20)** Aid (β2) -0.001 (-7.33)*** -0.001 (-7.43)*** -0.001 (-7.77)*** -0.001 (-8.31)*** -0.0004 (-3.49)*** -0.001 (-7.46)*** -0.001 (-7.95)*** -0.001 (-5.95)*** Democracy (β3,1) 0.017 (4.70)*** 0.014 (3.91)*** 0.011 (3.30)*** 0.015 (3.37)*** 0.011 (3.25)*** 0.011 (3.16)*** 0.009 (2.45)*** Governance (β3,2) 0.024 (3.07)*** 0.015 (1.93)** 0.013 (1.70)* 0.015 (1.87)* 0.015 (1.93)** 0.024 (2.89)*** Investment (β3,3) 0.017 (3.67)*** 0.017 (3.79)*** 0.017 (3.59)*** 0.017 (3.64)*** 0.018 (3.05)*** Aid×Democracy (β4,1) -0.00003 (-1.39) Aid×Conflict (β4,2) -0.0001 (-0.30) Aid×Conflict×Democracy (β4,3) 0.000 (0.22) n 94 93 84 84 84 84 84 84 68 n(conflict affected) 26 26 24 24 24 24 24 24 21 Adjusted R2 0.03 0.38 0.55 0.59 0.65 0.65 0.64 0.64 0.61 F Statistic 3.79** 28.96*** 34.45*** 30.90*** 31.32*** 26.74*** 25.81*** 25.79*** 21.90***
Table 2: Econometric Estimates – High Intensity Conflict OLS 2SLS 1 2 3 4 5 6 7 8 Constant (α) 0.613 (34.44)*** 0.702 (37.77)*** 0.624 (25.31)*** 0.661 (24.78)*** 0.442 (6.75)*** 0.415 (6.11)*** 0.442 (6.71)*** 0.447 (6.67)*** 0.476 (5.51)*** Conflict (β1) -0.077 (-2.04)** -0.084 (-2.75)*** -0.063 (-2.43)*** -0.057 (-2.31)** -0.046 (-1.96)** -0.050 (-2.12)** -0.050 (-1.37) (-1.89)-0.051 * -0.056 (-2.10)** Aid (β2) -0.001 (-7.28)*** -0.001 (-7.47)*** -0.001 (-7.75)*** -0.001 (-8.28)*** -0.0004 (-3.44)*** -0.001 (-7.70)*** -0.001 (-8.04)*** -0.001 (-5.93)*** Democracy (β3,1) 0.017 (4.73)*** 0.014 (3.98)*** 0.011 (3.37)*** 0.015 (3.43)*** 0.011 (3.34)*** 0.011 (3.18)*** 0.009 (2.59)*** Governance (β3,2) 0.023 (2.93)*** 0.014 (1.83)* 0.012 (1.60) (1.81)0.014 * 0.015 (1.86)* 0.023 (2.77)*** Investment (β3,3) 0.017 (3.60)*** 0.017 (3.72)*** 0.017 (3.58)*** 0.016 (3.54)*** 0.018 (3.03)*** Aid×Democracy (β4,1) -0.00003 (-1.40) Aid×Conflict (β4,2) 0.000 (0.03) Aid×Conflict×Democracy (β4,3) 0.000 (0.40) n 94 93 84 84 84 84 84 84 68 n(conflict affected) 26 26 24 24 24 24 24 24 21 Adjusted R2 0.03 0.38 0.56 0.59 0.65 0.65 0.64 0.64 0.61 F Statistic 4.16** 28.68*** 34.48*** 31.27*** 31.41*** 26.83*** 25.84*** 25.92*** 21.98***
Table 3: Econometric Estimates – All Conflict Types Weighted by Intensity Level OLS 2SLS 1 2 3 4 5 6 7 8 Constant (α) 0.614 (35.23)*** 0.700 (38.68)*** 0.622 (26.05)*** 0.661 (25.41)*** 0.444 (6.95)*** 0.417 (6.26)*** 0.446 (6.98)*** 0.454 (7.04)*** 0.479 (5.71)*** Conflict (β1) -0.011 (-2.29)** -0.012 (-2.92)*** -0.009 (-2.73)*** -0.009 (-2.80)*** -0.008 (-2.59)*** -0.008 (-2.66)*** -0.011 (-2.45)*** -0.010 (-2.73)*** -0.009 (-2.81)*** Aid (β2) -0.001 (-7.21)*** -0.001 (-7.42)*** -0.001 (-7.76)*** -0.001 (-8.35)*** -0.0004 (-3.53)*** -0.001 (-8.14)*** -0.001 (-8.31)*** -0.001 (-6.08)*** Democracy (β3,1) 0.017 (4.88)*** 0.014 (4.09)*** 0.011 (3.46)*** 0.015 (3.43)*** 0.011 (3.45)*** 0.011 (3.20)*** 0.009 (2.62)*** Governance (β3,2) 0.024 (3.08)*** 0.015 (1.95)** 0.013 (1.73)* 0.016 (2.05)** 0.016 (2.05)** 0.024 (3.01)*** Investment (β3,3) 0.017 (3.67)*** 0.017 (3.78)*** 0.017 (3.71)*** 0.017 (3.63)*** 0.018 (3.12)*** Aid×Democracy (β4,1) -0.00004 (-1.31) Aid×Conflict (β4,2) 0.000 (0.94) Aid×Conflict×Democracy (β4,3) 0.000 (1.04) n 94 93 84 84 84 84 84 84 68 n(conflict affected) 26 26 24 24 24 24 24 24 21 Adjusted R2 0.04 0.38 0.56 0.61 0.66 0.66 0.66 0.66 0.63 F Statistic 5.25** 29.39*** 36.63*** 32.76*** 33.05*** 28.08*** 27.64*** 27.75*** 23.72***