Theses and Dissertations
6-1-2017
Capital structure determinants for family business in MENA
Capital structure determinants for family business in MENA
region
region
Wedad Ismail
Follow this and additional works at: https://fount.aucegypt.edu/etds
Recommended Citation Recommended Citation
APA Citation
Ismail, W. (2017).Capital structure determinants for family business in MENA region [Master’s thesis, the American University in Cairo]. AUC Knowledge Fountain.
https://fount.aucegypt.edu/etds/613
MLA Citation
Ismail, Wedad. Capital structure determinants for family business in MENA region. 2017. American University in Cairo, Master's thesis. AUC Knowledge Fountain.
https://fount.aucegypt.edu/etds/613
This Thesis is brought to you for free and open access by AUC Knowledge Fountain. It has been accepted for inclusion in Theses and Dissertations by an authorized administrator of AUC Knowledge Fountain. For more information, please contact mark.muehlhaeusler@aucegypt.edu.
School of Business
CAPITAL STRUCTURE DETERMINANTS FOR FAMILY BUSINESS IN MENA REGION
A Thesis Submitted to
The Department of Management
in partial fulfillment of the requirements for
the degree of Master of Science in Finance
by Wedad Mohamed Ismail
under the supervision of Dr. Aliaa Bassiouny
Abstract
The aim of this thesis is to explore the determinants of capital structure of listed firms in the Middle East and North Africa. There is a large strand of literature that explains capital structure decisions in firms with the main theories explaining financing choices being: Pecking Order theory, Trade-off theory, Agency theory. The main contribution of the thesis is to explore whether family ownership concentration influences the capital structure. Family Owned businesses constitute around 22% of all business in the MENA region and the effect of such ownership structure on financing decisions has not been explored. The thesis relies on hand collected cross sectional data for 2015 a sample of firms from the region where family ownership ranges from 10% to 90%. The main methodology involves estimating a model, similar to
previous papers’, where leverage is the dependent variable and family ownership, profitability, growth, size, tangibility, non-debt tax shield, and other institutional and macroeconomic factors are independent variables. The main result of the thesis are that family ownership concentration has no effect on the capital structure decisions showing that financing decisions do not vary between family and non-family owned business. The Pecking Order Theory seems to explain the managers’ behaviour of these firms from 11 MENA countries with five GCC economies, with negative influence of profitability and liquidity on leverage.
Table of Contents
Abstract ... 2
Chapter 1: Introduction ... 6
Chapter 2: Literature Review ... 8
2.1 Importance of Capital Structure Decisions and the Effect on Firm Value... 8
2.1.1 Role of Debt in Capital Structure ... 8
2.2 Capital Structure History and Theories ... 9
2.2.1 Modigliani and Miller’s Irrelevance Theory ... 9
2.2.2 Trade-off Theories ... 10
2.2.3 Pecking Order Theory ... 11
2.2.4 Agency Theory ... 12
2.2.5 Market Timing Theory ... 13
2.3 Empirical Research ... 13
2.3.1 Endogenous Variables for Capital Structure ... 13
2.3.2 Exogenous Variables for Capital Structure ... 18
2.4 Contribution ... 20
2.4.1 The Literature Gap ... 20
2.4.2 MENA Economic Characteristics and Political Hurdles ... 21
Chapter 3: Methodology ... 23
3.1 Model ... 23
3.2 Variables ... 23
3.2.1 The Dependent Variable ... 23
3.2.2 Independent Variables... 24
Chapter 4: Data Statistics ... 27
4.1 Research Questions ... 27
4.2 Sample Selection ... 27
4.3 Descriptive Statistics Analysis ... 28
Chapter 5: Results ... 30
5.1 Correlation Matrix ... 30
5.2 Firm-specific Determinants of Leverage ... 31
5.3 Family Ownership Correlation with Leverage ... 33
5.4 Country-Specific Determinants of Leverage ... 34
References ... 37
Appendix ... 45
1. Risk Exclusion due to Heteroscedasticity ... 45
2. Sub-samples Descriptive Statistics, Correlation Matrices, and Results ... 46
2.1 GCC Countries Sample with 117 Observations ... 46
2.2 Non-GCC Countries Sample with 99 Observations ... 48
2.3 Consumer-Products Sample with 95 Observations ... 50
2.4 Non-Consumer-Products Sample with 121 Observations ... 52
3. Country-specific Factors in all samples ... 54
3.1 Total Sample Results for Country-specific Factors ... 54
3.2 GCC Sample Results for Country-specific Factors ... 56
3.3 Non-GCC Sample Results for Country-specific Factors ... 57
3.4 Consumer-Products Sample Results for Country-specific Factors ... 58
3.5 Non-Consumer-Products Sample Results for Country-specific Factors ... 59
4. Controlling for Country as Robustness for Family Ownership Insignificance ... 61
Tables Table 1: Description of Dependent and Independent Variables ... 26
Table 2: Descriptive Statistics ... 28
Table 3: Correlation Matrix ... 31
Table 4: Original Sample Results ... 32
Table 5: Robustness for Profitability ... 32
Table 6: Robustness for Liquidity... 33
Table 7: Family Ownership Insignificance ... 34
Table 8: INMA Insignificance ... 35
Table 9: Original Model with Risk ... 45
Table 10: Descriptive Statistics of GCC Sample ... 46
Table 11: Correlation Matrix for GCC Sample ... 46
Table 12: Results for GCC Sample ... 47
Table 13: GCC Model Robustness ... 47
Table 14: Robustness for Liquidity... 47
Table 16: Correlation Matrix for Non-GCC Countries ... 48
Table 17: Results for Non-GCC Sample ... 49
Table 18: Robustness for Profitability ... 49
Table 19: Robustness for Liquidity... 49
Table 20: Consumer-products Sector... 50
Table 21: Correlation Matrix for Consumer-products Sample ... 50
Table 22: Results for Consumer-Goods Sector ... 51
Table 23: Robustness for Profitability ... 51
Table 24: Robustness for Liquidity... 51
Table 25: Non-Consumer-products Sector ... 52
Table 26: Correlation Matrix for Non-consumer-products sample ... 52
Table 27: Results for Non-consumer-goods sectors ... 53
Table 28: Robustness for Profitability ... 53
Table 29: Robustness for Liquidity... 53
Table 30: INMA Regressions for original sample ... 54
Table 31: INMA Regressions for GCC Sample ... 56
Table 32: INMA Regressions for Non-GCC Sample ... 57
Table 33: INMA Regressions for Consumer-Products Sample ... 58
Table 34: INMA Regressions for Non-Consumer-Products Sample ... 59
Chapter 1: Introduction
One of the main focus areas of corporate finance is examining financing decisions of firms that affect their capital structure. In corporations, managers maximize the firm’s value for shareholders in order to ensure the maximum return for equity holders after paying the claims of government, in form of taxes, and debt-holders, in form of principal and interest payments. Had markets been perfect in terms of costs and information quality, the value of the firm would have been indifferent from the managers’ choice of debt-equity mix, as argued by Modigliani and Miller in 1958 who initiated the long standing theories regarding capital structure. Nevertheless, in an imperfect world, costs of financial distress that arise from increasing leverage are real, since the firm takes a financial commitment to pay borrowed funds with interest regardless of the prevailing market conditions, which may not necessarily be in favour of the firm. On the other hand, issuing equity gives misleading signals to investors that may result in unfavourable consequences in terms of the share price and return because investors believe that managers would not issue more equity and risk the current share price unless it is overvalued and the firm is in dire need of financing.
Consequently, theorists have built upon Modigliani and Miller’s “irrelevance” concept by knocking out their assumptions one at a time and formulating succeeding theories such as the Trade-off Theory by Kraus and Litzenberger in 1973, the Pecking Order Theory by Myers and Majluf in 1984, the Agency Theory by Jensen and Meckling in 1976, and the Market Timing Theory by Baker and Wurgler in 2002. Other researchers engaged in the practical side through empirical research and surveys in order to scrutinize the theoretical body by examining the managers’ behaviour in the field work. With this vast train of thought, there has not been a consensus of what makes managers prefer debt or equity. Even when studying the effect of corporate governance factors, such as ownership concentration, capital structure decisions seemed to have other unobservable effects than what researchers have attempted to examine.
The aim of this thesis is to 1) analyze the capital structure determinants for listed firms in emerging markets like that of the MENA region and 2) explore the effect of degree of family ownership on the capital structure decisions, as an additional factor that contributes to this vast literature. Family owned business constitute 22% of the collected region’s businesses and therefore understanding the effect of this ownership structure, if any, on financing decisions is
important. The sample of this thesis is made up of 216 firms from 30 consumer and non-consumer sectors, excluding financial institutions, from 11 MENA countries. The results conquer of previous studies’ findings; this study finds to the answer of the first question that Pecking Order Theory best explains the capital structure behaviour of the sample in study, with profitability and liquidity being negatively correlated with leverage. However, the result of the second question discovered that capital structure decisions of listed MENA firms are not influenced by the degree of family ownership, mainly as a result of the homogeneity of the sample in study. Further research is recommended with a focus on one country’s unlisted firms that are considered family business with a survey for their managers in order to touch upon the difficulties they may face, possibly backed with a survey from banks, the main debt-holders in bank-oriented economies like that of the MENA region, about their credit risk measurements and lending facilities for unlisted businesses.
The remainder of this thesis is organized as follows: Chapter II touches upon the
importance of the capital structure on the value of the firm, reviews the theoretical and empirical literature of the subject in study, and states the contribution of this research to the literature body; Chapter III details the methodology followed and explains the variables used; Chapter IV
recounts the process of data collection and sample selection, and analyses its statistics; Chapter V gives a step-wise analysis for the model’s results; and Chapter VI concludes with a
Chapter 2: Literature Review
There is a vast amount of literature that explores theories and empirical results regarding capital structure. This literature review will be organized as follows: Section 1 discusses the importance of capital structure decisions. Section 2 thoroughly discusses the history of capital structure theories, and Section 3 explores the empirical studies that used firm-specific
determinants and exogenous factors that may affect the management preference in setting the capital structure of the firm. The literature review will conclude in Section 4 with a summary of the main gaps in the literature and explains the contribution of this thesis to the literature. 2.1 Importance of Capital Structure Decisions and the Effect on Firm Value
Institutional managers take financial decisions that generally aim at maximizing the shareholders’ wealth and/or the firm’s value. Measurement of the latter, however, has usually been more straightforward. The value of a firm is traditionally measured by discounting its cash flows at the weighted average cost of capital; a discount rate that constitutes the weighted costs of both debt and equity, the firm’s primary sources of funding, weighted by their relative contributions to the firm’s capital structure. The optimal capital structure for the firm, reflected in the relative weights of debt and equity, is the one that minimizes the weighted average cost of capital and would thus maximize the value for the shareholders (Pinegar and Wilbricht, 1989). Changing debt levels, and corresponding equity weights, have several implications on the firm that managers take into consideration when stipulating their firm’s capital structure.
2.1.1 Role of Debt in Capital Structure
The impact of raising debt on the value of firms is bi-dimensional. On one hand, increasing debt increases the cost of equity as the claim for the equity shareholders becomes more risky due to the accompanying increased probability of financial distress, hence making shareholders demand a higher return. In addition, excessive debt may hinder further firm investments as management will not be able to enter into new investment projects unless sufficient earnings are ensured to pay off debt payments and have incremental amount over the investment cost to turn in positive earnings for equity shareholders (MacKie-Mason, 1990). On the other hand, debt provides a tax shield for firms as interest expenses are deducted from the taxable income, leaving more earnings to debt-holders and equity shareholders (Ross, 2005). Moreover, debt interest payments act as a disciplinary tool for management, reducing any
possible conflict of interest when management has free cash at its disposal (MacKie-Mason, 1990 and Harris and Raviv, 1990). In addition, how a firm manages its debt provides investors with information in case regular payment of debt contracts and during the negotiations before the onset of a default that would either result in the firm’s liquidation or financial restructure (Harris and Raviv, 1990). However, in case of a tax-exempted firm, Geoffrey Smith examined the financing decisions of tax-exempted firms in US (2010)and UK (2012) and found that the benefit comes mainly from the firm’s leveraging of capital investments in order to increase their return on equity and that the cost of the higher probability of financial distress must be offset by the benefit.
2.2 Capital Structure History and Theories
The process of finding out how managers finance their firms and what the optimal capital structure should look like started in 1958. Since then, theorists have not reached a consensus about whether firm managers prefer debt or equity as a source of financing.
2.2.1 Modigliani and Miller’s Irrelevance Theory
Theorists started investigation in this broad field by questioning whether financing decisions affect firm’s value. The pioneers for answering this question were Modigliani and Miller (MM). Their Modern Capital Structure Theory in 1958 nullified the effect of the capital structure on the firm’s value given that the assumptions of a perfect market hold: 1) absence of brokerage costs, taxes, information asymmetry between investors and management, and bankruptcy costs, 2) consistent borrowing rate for investors and corporations, and 3) the independence of net profit before interest and taxes from debt (Graham, 2003). MM assumed that an increase in leverage will render equity more risky and hence result in a higher cost of equity to a level that makes the weighted average cost of capital constant; in other words, cost of equity will increase as the weight of debt increases, making the final product of weighted debt cost balanced with the weighted equity cost and the total cost of capital unchanged from the case of unlevered firm. Relaxing the no-corporate-tax assumption, MM claimed that the tax
deductibility of interest payments, as opposed to the taxed dividend income, would increase the value of leveraged firms compared to that of unlevered firms, benefitting from the tax shield of interest payments (Modigliani and Miller, 1963). Afterwards, Miller in the 1970s further developed the theory to include personal taxes on firms and studied the effect of the stock
income’s corporate and personal tax and the income tax on debt. He argued that taxes on debt and equity would most probably outbalance, neutralising the effect of leverage on the firm’s value (Bradley et al, 1984).
2.2.2 Trade-off Theories
Relaxing the no-bankruptcy costs assumption, Kraus and Litzenberger in 1973 argued that there is a trade-off between debt tax benefits and the increased probability of financial distress associated with higher debt (Pinegar and Wilbricht, 1989). As financing depends more on debt, interest payments will reduce taxes and hence work as a tax shield that would allocate more earnings to investors (in the form of debt service) and less to the government (in the form of payable taxes). Holding the firm’s total assets and investment plans constant, Stewart Myers
(1984)explained that the trade-off between the costs and benefits of the use of debt might result in an optimal capital structure, under the condition that there are no issuance costs. Changes in market rates, however, do occur, subsequently changing the value of debt/equity and causing a diversion from the planned capital structure level. Consequently, managers adjust the firm’s capital structure back to the target level by issuing or recalling debt since it is found to be a faster rebalancing tool and has lower issuance (or adjustment) costs than equity, as the principles of dynamic trade-off theory imply. Accordingly, highly profitable firms are expected to have higher leverage as their sound financial conditions give them the privilege to issue debt, with no
adjustment costs incurred. Therefore, any market changes should not hinder managers from immediately readjusting their capital structure to their target levels.
This theory, however, has been questioned and challenged through the empirical findings of a number of studies. Flannery and Rangan (2006), Eldomiaty (2008), Abu Mouamer (2011),
Elsas et al (2014), Getzmann et al (2014), Serrasqueiro and Caetano (2015), Koksal and Orman
(2015)(in case of large, non-manufacturing and private firms), and (Belkhir et al 2016) found evidence that profitable firms preferred equity to debt, while having the capacity to issue debt and swiftly rebalance any deviations in the capital structure level from the target. These findings reveal that firms choose to slow their adjustment or deviate from their desired target capital structure for a long time in case they find transaction costs outweigh the benefits of rebalancing their capital structure (Denis, 2012 and Lambrinoudakis, 2016). Particularly, Danis et al (2014) found that right before rebalancing takes place, the dynamic trade-off theory is affirmed by the
positive correlation between profitability and leverage; while at any time other than that point, leverage and profitability appear to be negatively correlated. Lemmon et al (2008)found that capital structure changes are absolutely time-invariant, since highly-levered firms tend to remain within the same leverage levels for as long periods of time as 20 years. Another research by
Dang and Garret (2015)studied firms by their level of leverage and financial status and justified the asymmetry of capital structure adjustments among firms, assuming that adjustments are done using debt and total assets. Their sample revealed that firms with over-leverage and financing deficit are faster in adjusting their level to the target than those with under-leverage and
financing surplus due to the pressure the former firms face in order to eliminate their financing imbalance.
2.2.3 Pecking Order Theory
A later study by Lambrinoudakis (2016)affirmed the inconsistency in the dynamic trade-off theory as the sample under study showed positive correlation between adjustment speed and cost: as the costs decrease, the speed with which capital structure is adjusted to the target level decreases and not the contrary as would be expected. In addition, his study provides evidence that firms adjust their capital structure more rapidly when varying equity and not debt, hence contradicting the principles of the dynamic trade-off theory and defying the existence of an optimal capital structure. In an effort to survey managers about how they raise new funds,
Kamath (1997)and Pinegar and Wilbricht (1989)found that 34.5% and 31.2% of their samples, respectively, had target capital structure towards which they adjust their debt levels. The
majority of their samples preferred to have a financial hierarchy, with 84% ranking internal funding as their first option, which Donaldson first discovered in his study in 1961 (Myers, 1984). Donaldson (1961) provides evidence that internal funding is preferred by firms over external financing and observed the reluctance in selling common stocks to finance their operations, arguing that the pecking order theory was more consistent with management
behaviour than trade-off theories (Myers, 1984). Smith (1986) found negative firm stock returns as a result of announcing equity offerings. This finding was justified by Myers and Majluf (1984) with the prevalence of information asymmetry between investors and managers, hence relaxing the fourth assumption of MM’s theory to propose the pecking order theory (Denis, 2012 and
first option, external funding using debt as the second, and common equity as the last resort in case former options were inadequate. This prioritization resulted from the fact that
announcements of external funding to investors give a signal of overpriced equity and hence cause the firm to have negative stock returns with investors rushing to sell the overpriced stocks. Findings of Wahba (2014), Koksal and Orman (2015)in case of small, manufacturing and public firms, Smith (2012), Mac an Bhaird and Lucey (2010), and DeJong et al (2008) are consistent with the financial hierarchy or pecking order theory. Their samples consisted of firms that strive to avoid the problem of adverse selection and choose financing tools that are not information sensitive (Denis, 2012).
2.2.4 Agency Theory
Another school of thought built upon the disciplinary role of debt, has been initiated by Jensen and Meckling in 1976. According to this theory, firms’ management may achieve value maximization when agency costs, caused by the diverging objectives of managers and
shareholders, are minimized (Pinegar and Wilbricht, 1989), One main reason may be the cash available at prosperous times that may direct managers to unnecessary expenditures and investments that are not to the welfare of the shareholders (Booth et al, 2001). Therefore, debt becomes beneficial as it deters management’s discretion by the restrictive covenants of its contracts and its regular structure of payments. However, too much debt may cause a
counterintuitive agency problem of underinvestment, whereby managers become so much risk-averse that they rarely enter into new profitable projects for their perceived high risk and their fear of default on their debt payments (Harris and Raviv, 1990). Therefore, the agency theory demands a balance between the disciplinary role of debt and the problem of underinvestment that may result from excessive debt, providing a theory that is less extreme than the main capital structure theories addressed previously (Wahba, 2014). Mac an Bhaird and Lucey’s (2010) findings on Irish Small and Medium Enterprises (SMEs) support the agency and pecking order theories, providing evidence that the agency theory may not necessarily be mutually exclusive; with positive correlations between the use of internal equity and firms’ development, the availability of collateralization and debt financing, and the owner’s role in securing equity and providing personal assets as collateral.
2.2.5 Market Timing Theory
Relaxing MM’s symmetric-information assumption brings in another school of thought that also rejects the notion of optimal capital structure, similar to the pecking order theory
described above. Baker and Wurlger (2002) proposed that managers time the market when taking the decision of issuing equity or debt; “they exploit temporary fluctuations in the market … in order to benefit on-going shareholders at the expense of entering and exiting ones,” as they elaborate. According to this theory, new equity is issued when 1) the firm’s equity market value is higher than book value or past market value, 2) the cost of equity is low, and 3) investors have an optimistic view for future earnings; while existing equity is repurchased when the market value and the cost of equity are relatively low. Being the first, back then, to examine the effect of market timing on capital structure decisions, Baker and Wurgler found that firms had low
leverage when the market valuation was high, while highly levered firms raised funds when the market value of their equity was low. They built their model with leverage being the dependent variable and the external finance weighted-average market- to-book ratio as the independent variable that captures the historical market valuations; which showed a significant negative correlation that emphasized the importance of market timing and its long-run impact on capital structure decisions (Baker and Wurgler, 2002). In other words, managers issue overvalued equity to transfer wealth from new to old shareholders (Denis, 2012). However, it is worth mentioning that several studies found the negative correlation is not necessarily a product of market timing (Oztekin, 2015). Chazi and Tripathy (2007) found that real mispricing, instead of a perceived one, causes managers to time the market; while Kaya (2014) provides evidence that market timing has a higher impact on a firm’s capital structure in the long run (five years) more than the short run (two-three years).
2.3 Empirical Research
2.3.1 Endogenous Variables for Capital Structure
In order to test the validity of different theories, researchers explored management behaviour in choosing their firms’ optimal capital structure using variables from different firms, industries, and countries. There is general consensus that the main firm-specific capital structure determinants are profitability, liquidity, tangibility, debt and non-debt tax shields, bankruptcy
risk, size, and growth. This section provides a detailed explanation for each variable including its method of calculation and predictions from both trade-off and pecking order theories.
2.3.1.1 Leverage
As elaborated above, most of the studies use leverage as the explained variable whose correlation with the explanatory variables reflects the managerial behaviour and its consistency with the theoretical framework. Leverage shows the dependence of a firm on debt for financing its assets, whether this debt is long-term debt, with maturity longer than 1 year, or short-term. Most papers used long, short, and total debt to total assets ratios interchangeably; some depended on market values of debt such as Flannery and Rangan (2006); Hall et at (2015)used long term debt only; while DeJong et al (2008)avoided using short-term debt, and hence total debt, as a proxy for leverage due to mainly the complexity in defining short-term maturities.
2.3.1.2 Profitability
Profitability has several measurements; most papers used the operating income to total assets ratio, or earnings before interest and taxes to total assets ratio like Flannery and Rangan
(2006), while Tian and Zeitun (2007)and Wahba (2014)used the return on assets ratio and Tobin Q ratios. The trade-off theory predicts a positive correlation between leverage and profitability; the more profitable a firm becomes, the higher the tax benefit from its debt, which works as a tax shield for profits. Conversely, the pecking order theory requires profitable firms not to use debt, since their increased profits will provide increased retained earnings, hence having adequate internal financing.
2.3.1.3 Tax
Several measures are used to consider the effect of taxes on leverage. Graham (2003) shows that the value of a firm with debt financing is higher than that without debt financing by the after-tax amount of debt (debt times the tax rate), as opposed to MM’s irrelevance model which stipulates that capital structure decisions do not affect the value of a firm. As a result, the effective tax rate shows the debt tax shield that firms benefit when using debt for financing. As tax rates increase, the firm will tend to use more debt in order to benefit from the increased tax savings. While Cassar and Holmes (2003), Mac en Bhaird and Lucey (2010), Abu Moamer
Irish SMEs, and Saudi firms’, respectively, Tian and Zeitun (2007) used the effective tax rate to capture the tax shield of using debt.
Non-debt tax shield is the tax savings that result from depreciation and amortization expenses that are deducted from income before tax. It is calculated as the total depreciation and amortization to total assets and has the same theory predictions as that of the tax shield.
Wellalage and Locke (2013) and Getzmann et al (2014)used it solely to reflect the tax shield;
Michaelas et al (1999), Sogorb-Mira (2005), Serrasqueiro and Caetano (2015), and Belkhir et al
(2016)used both measures as alternatives to one another for robustness, while Eldomiaty (2008) uses it as a trade-off theory factor. Koksal and Orman (2015)incorporated it with the tax rate to build the potential debt tax shield in order to capture the sum of the paid interest and taxable income after non-debt tax deductions (depreciation and amortization).
2.3.1.4 Growth
Growth is measured in diverse ways in different research papers. DeJong et al (2008) used the market value of total assets to the book value of total assets as a proxy for firm growth,
El-domiaty (2008)used capital expenses to total assets, natural logarithm of total assets and total sales, Koksal and Orman (2015)used the percentage change of sales, while Serrasqueiro and Caetano (2015) used the natural logarithm of total sales. Bartholdy and Mateus (2011)defined growth opportunities as a measure of asymmetric information since they do not give clear information to external creditors. Therefore, the trade-off theory expects a negative correlation with leverage. The pecking order theory, on the other hand, predicts a positive relation between leverage and growth, for the insufficient internal financing as growth opportunities increase, as
Kroksal and Orman (2015)explained.
2.3.1.5 Liquidity
Liquidity shows the ability of the firm to pay its short term obligations or the availability of liquid assets that does not lose value when converted to cash. Tian and Zeitun (2007),
Getzmann et al (2014),Chang et al (2014), Serrasqueiro and Caetano (2015), and Mac en Bhaird and Lucey (2015) did not use liquidity as a capital structure determinant in their model; while
Salameh et al (2012), Mateev et al (2013), and Wellalage and Locke (2013) used current assets to current liabilities ratio; Smith (2010) used the ratio of working capital to total assets; and
Smith (2012) and Belkhir et al (2016) used current assets to total assets. The more liquid the firm is, the more resilient its financial soundness is and the less likely it is to get adversely affected by financial distress. Sibilkov (2009)found a significant positive correlation between leverage and asset liquidity and emphasized its importance as it shields firms from increased bankruptcy costs: more liquid assets give managers the ability to use more debt since they will be able to pay it off using their liquid assets in case of bankruptcy, and hence the probability of default associated with more debt is reduced. Therefore, the trade-off theory predicts a positive relation between liquidity and leverage since more liquid firms have the ability to issue more debt. In addition, agency theory predicts a positive correlation between liquidity and leverage as more liquid firms will be able to issue more debt in order to control managers and reduce agency costs (Belkhir et al, 2016). The pecking order theory, however, anticipates a negative relation between liquidity and leverage as more liquid firms will issue more internal equity in anticipation to lower problems arising from information asymmetry.
2.3.1.6 Size
Larger firm size means more diversification, maturity, and higher credit rating that facilitate access to external funding (Wellalage and Locke, 2013). Smaller firms, however, usually face severe problems of information asymmetry that may hinder access to external financing or at best increase its cost (Cassar and Holmes, 2003). While most papers used the natural logarithm of total assets as a proxy for firm size, Kroksal and Orman (2015)–and
Serrasqueiro and Caetano (2015)– used natural logarithm of total sales, in anticipation of the existence of a multicollinearity problem with several measures including total assets in their calculation. Michaelas et al (1999)used total assets as a measure of firm’s size. Tian and Zeitun
(2007)used both log of total assets and total sales alternatively for robustness, while Smith
(2012) uniquely used log of total income as a proxy for size. According to the trade-off theory, as firms grow larger, they become more capable of issuing debt due to their financial stability (Belkhir et al, 2016) and their lower agency costs of debt (Wellalage and Locke, 2013).
According to the pecking order theory, larger firms tend to have less information asymmetry and adverse selection problems which make them more capable of issuing external financing than smaller firms, however, Bandyopadhyay and Barua (2016)expected larger firms to prefer more equity.
2.3.1.7 Tangibility
Tangibility measures how much tangible assets make up from the firm’s total assets, traditionally calculated as the ratio of net fixed assets to total assets, as by de Jong et al (2008),
Eldomiaty (2008), Wahba (2014), Koksal and Orman (2015), and Belkhir et al (2016). Tangible assets are used for debt collateralization since financial distress does not adversely affect their value, unlike the intangible assets. Therefore, the trade-off theory predicts a positive relation between tangibility and leverage, while the pecking order theory associates the tangibility of the firm with low information asymmetry of the firm. Hence, the more tangible the assets of a firm are, the less adverse selection problem it faces, and the more capable the firm becomes to issue external financing (Bartholdy and Mateus, 2011).
2.3.1.8 Bankruptcy Risk
As the probability of financial distress increases, firms’ sales decrease consequentially decreasing cash flows, credit requirements become stricter leaving firms unable to finance their projects, and managers stop accepting new projects for their risk. Both the trade-off theory and the pecking order theory thus predict a negative relation between business risk and leverage (Harris and Raviv, 1990). Smith (2010, 2012), Bartholdy and Mateus (2011), Kayo and Kimura
(2011)and Belkhir et al (2016) followed Graham (2000) in using the Altman’s z-score, modified by Mackie-Mason (1990) to measure the ex-ante probability of distress: the higher the score, the lower the probability of financial distress is. Salameh et al (2012)used the standard deviation of return on assets as a measure of bankruptcy risk. Michaelas et al (1999), Cassar and Holmes
(2003), DeJong et al (2008), and Koksal and Orman (2015) used the standard deviation of operating income to total assets for three years. Serrasqueiro and Caetano (2015)used the percentage change of earnings before interest, taxes, and depreciation. Tian and Zeitun (2007) used the standard deviation of cash flows of three consecutive years. Hall et al (2000), Sogorb-Mira (2005), Abor (2007), Lemmon et al (2008), and Getzmann et al (2014) did not use risk for their capital structure model. Both theories predict a negative relation between business risk and leverage.
2.3.1.9 Age
The age of a firm, according to Wahba (2014), measures the organizational complexity and captures its life cycle requirements. Abu Moamer (2011)also viewed it as a reputational
measure, while Bartholdy and Mateus (2011), as well as Hall et al (2000) considered it as a measure of the availability of information about the firm, as younger firms tend to have less information and hence facing more difficulty in obtaining financing in the form of debt from financial institutions. According to Smith (2010), startups face difficulty raising funds due to their lack of sufficient information. The age of the firm is usually calculated as the natural logarithm of the incorporation year till the year of analysis. It is expected that firms with more years of incorporation would be in a higher maturity stage and hence would be more capable of raising debt backed by their financial soundness, predicting a positive correlation according to the trade-off theory. On the other hand, the pecking order theory expects a negative relation with leverage since more experienced and older firms will have the capacity to choose internal equity funding rather than debt or external funding in general (Bandyopadhyay and Barua, 2016 and
Palacín-Sánchez et al, 2012).
2.3.2 Exogenous Variables for Capital Structure
Other exogenous factors have been studied to examine their effect on the capital structure of the firm, such as country-specific factors, corporate governance factors, and other factors.
2.3.2.1 Country-specific Factors
Some researchers investigated whether factors other than the firm-specific determinants may affect the firms’ decisions of capital structure. Booth et al (2001) found that capital structure determinants are the same for both developed and developing countries, with the latter providing support to the principles of the pecking order theory due to the existence of information
asymmetries and agency costs. Deesomsak, Paudyal, and Pescetto (2004) examined the
environmental influence on capital structure decisions of market-based Asia Pacific economies that were affected by the 1997 Asian financial crisis. Using factors like rule of law, legal protection, and ownership to capture the institutional features of the studied sample, the surrounding environment appeared to have a significant effect on capital structure decisions whose influence differs with the country’s institutional, legal, and governance disparities, and that the crisis has altered considerably the firms’ decisions as well as its specific determinants. For example, firm size had a significant impact on firms’ capital structure after the crisis and not before, as creditors started to become more stringent in lending small firms after the crisis.
Structure Choice” for a sample of European firms with minimal firm-specific differences across countries. 75% of this sample had a target debt ratio. Executives cared about financial flexibility, credit rating, tax deductibility of interest, earnings volatility, public concerns about the firms’ financial stability, and the potential bankruptcy cost, in resemblance with the assumptions of the trade-off theory. Forty percent of managers issue debt when interest rates are low or when equity is undervalued, consistent with the notion of market timing. On the country level, the quality of the legal system is the most influential factor, followed by the cost of capital.
DeJong et al (2008) were the first to find that firm-specific factors are different across countries due to the indirect impact of country-specific factors on capital structure. Country-specific factors such as creditor right protection, bond market development, GDP growth, and legal enforcement have a direct effect on leverage and an indirect effect through their influence on the firm-specific determinants. Similarly, Gungoraydinoglu (2011) found that the correlation between profitability and leverage is altered across countries with higher bankruptcy procedures costs and less stringent creditors’ rights protection. Ozetkin and Flannery (2012) found that country variations cause different target adjustment speeds due to the different adjustment costs caused by the institutional environment in which the firm operates. Joeveer (2013)emphasized the strong influence of country-specific factors for explaining the capital structure decisions of unlisted firms in transition economies while industry factors explained that for listed firms. Types of economies seem to affect the risk appetite of creditors and firms, based on their level of transparency, investor protection, and orientation of their legal system, as Acedo‐Ramírez and Ruiz‐Cabestre (2014) found when comparing the UK with continental European countries.
2.3.2.2 Corporate Governance: Ownership
Many researchers argued that ownership concentration affects the capital structure in the severity of agency costs of the firm and hence must be highlighted in the domain. Céspedes, González, and Molina (2010) studied a sample of firms in Latin America given their highly concentrated ownership relative to developed countries and the general preference of Latin American firms to debt over equity driven by the risk of losing control. Results affirmed the trade-off theory when ownership concentration is high, while preference to debt decreases when ownership concentration is low. Similarly, Ganguli (2013) found a strong positive correlation between ownership concentration and leverage of Indian firms. He explained that this result is
due to managers’ reservation from creditors’ control when issuing debt, hence preferring internal funding as a source of financing when ownership is diffused rather than concentrated. On a larger and more institutionally sophisticated sample, Farooq (2015)studied the ownership concentration on the Middle East and North Africa (MENA) region and found opposing results to the former study: ownership concentration showed negative correlation with capital structure due to the associated information asymmetry with concentration of ownership that hinders managers from raising debt.
Similarly, Santos et al (2014) found a negative correlation between ownership
concentration and leverage for a sample of Western European countries, especially family firms that are more resistant to using debt for their lack of portfolio diversification and need of risk minimization. Papers that focused on family ownership, with samples from Canada, Malaysia, and Eurozone, had different results, as King and Santor (2008)found that concentrated family ownership firms tend to use more leverage in Canada; Nadaraja et al (2011)found that family ownership has no influence on capital structure in Malaysia; and Pindado et al (2015)found that the long-term involvement of the family ownership decreases information asymmetry and hence facilitates issuing debt in the Eurozone.
2.3.2.3 Others
Jahanzeb et al (2015)was the first, back then, to examine the effect of Pakistani firms’ market power on their capital structure. While ordinary capital structure determinants show resemblance to the market timing theory, market power gives stronger firms an advantage in controlling the market prices and production and thus the privilege to use more debt. Other studies focused on manufacturing industries in France (Viviani, 2008), US (Morri and Beretta, 2008), and Pakistan (Sheikh and Wang, 2011), all of which support the pecking order theory. 2.4 Contribution
2.4.1 The Literature Gap
To the best of my knowledge, this thesis will be the first to explore the association between the degree of family ownership and the capital structure of listed firms in the MENA region. This thesis attempts to 1) highlight the key capital structure determinants of a cross-sectional sample of MENA firms and 2) find out whether a correlation exists between family
ownership concentration and the capital structure behavior of sample firms. Concerning the sample selection, the MENA region has been underestimated in the study of the capital structure; only two papers were found to explore this region: Farooq (2015), as explained above, focused on the effect of ownership concentration in general on the firms’ capital structure in the region, given its unique characteristics and risk appetite, with no special focus on the family ownership concentration which is the primary focus of this study.
Belkhir et al (2016)is the first to investigate whether firm leverage is determined by the same capital structure determinants of major economies and worldwide for the MENA region and whether institutional environments affect the capital structure. The sample consisted of 444 listed firms from 10 MENA countries: Bahrain, Egypt, Jordan, Kuwait, Morocco, Oman, Qatar, Saudi Arabia, Tunisia, and UAE from 2003 to 2011. Using a dynamic panel data model to capture the various adjustment speeds of different countries, Belkhir et al (2016) found that firm-level variables appear to explain the behavior of MENA firms’ management through the pecking order theory with efforts to adjust the capital structure to a set target. The negative correlation between profitability and leverage reflects the slow capital structure adjustment due mainly to the country-specific characteristics of rule of law, regulatory effectiveness, corruption, and financial development and other macroeconomic factors. Additionally more developed countries were found to help their firms use more debt, with the dependence of firms’ capital structure on the country’s legal system, creditor rights protection, and the economy’s orientation as either market or bank-based (Belkhir et al, 2016).
2.4.2 MENA Economic Characteristics and Political Hurdles
The MENA region is a rather important economic player in the global trade facilitation, with a long history starting from foreign investment barriers to economic reforms. Recently, MENA has undergone several economic reforms that increased business confidence and facilitated doing business through transforming from state to market economies to increase market efficiency, liberalizing portfolio investments to provide market transparency, and privatizing state-owned companies to increase economic efficiency (OECD, 2008). The region contains 18 stock exchange markets that have been prospering with growing market
capitalization, especially after the MSCI upgrade of two gulf countries, UAE and Qatar, to emerging markets, which increased the interest of international investors (Amico, 2014). Given
all aforementioned changes, financial conditions of firms operating in the region have improved significantly and management has the ability to take financial decisions more freely since the inception of the macroeconomic and institutional reforms. Nevertheless, since the majority of the corporations are controlled by family and/or government, the low level of free float in the region hinders diversification of corporate sectors and SMEs expansion. In addition, a major problem that this region still faces is the lack of diligent disclosures accompanied with lack of market and legal system transparency, providing domestic/foreign investors with unclear financial
information for corporations. This explains the inclination of corporates towards internal funding and debt financing rather than equity in this region as investors avoid investing in equity for the prevailing weakness of the creditors’ rights protection (for debt) and perceived information asymmetry (for equity) (Amico, 2014), provided that the region still bank-based instead (OECD, 2008 and O’Sullivan et al, 2011).
Despite the recent economic reforms and potential global financial inclusion, the MENA region has recently been facing several economic and political challenges from the decline in oil prices to instable political environments due to increased civil conflicts, providing non-promising growth prospects (World Bank, 2016). Security concerns, slow tourism activity, and unconfident foreign investors, along with weak legal systems and private sectors, adversely affect the
development of capital markets and the availability of financial resources (Mottaghi, 2016 and
Ben Naceur et al, 2007). With the decline in oil prices, remittances inflows are decreasing and are consequently eating up the benefit of reduced costs to oil importers, not to mention the severe deficit faced by OPEC countries. Subsequently, countries in this region are cutting capital
expenditures and halting investment projects, causing increased unemployment and weak business confidence (Mottaghi, 2016).
Chapter 3: Methodology
3.1 Model
As highlighted above, theorists found that debt choice is affected by not only financial indicators of firms but also many other firm factors such as corporate governance and exogenous factors such as macroeconomic, political, and governmental conditions. This research aims to emphasize the behavior of MENA firms in capital structure decisions and explore the relation between capital structure and one of the exogenous factors: the degree of family ownership.
The equation above shows the employed regression model, estimated using the Ordinary Least Squares regression method to estimate the relation between the dependent variable,
leverage, and the explanatory variables, which comprise firm-specific and cross-country factors. Section 2 explains the employed variables with the used calculations. Table 1 provides a
summary of the dependent and independent variables. Belkhir et al (2016) used the Generalized Method of Moments (GMM) for panel data in order to capture the adjustment speed for dynamic capital structure; while Farooq (2015) used pooled regression analysis to study the effect of ownership concentration on the choice of leverage.
3.2 Variables
All financial statement variables and institutional indicators are obtained from the Datastream of Citadel Capital for Financial Services. The variable for family ownership was collected manually for all firms of the original sample from Thomson Reuters Screener. As previously discussed, variables are defined based on previous literature workings and the needs of this research.
3.2.1 The Dependent Variable
The dependent variable in my equation is Leverage, which captures the capital structure preference for managers and is defined as the total debt to total assets ratio, similar to Flannery and Rangan (2006), DeJong et al (2008), and, Hall et at (2015). The choice of explanatory
variables is based on literature consensus, with primary focus on a blend from the methodologies of Belkhir et al 2016 –especially in country-specific variables –and Farooq 2015.
3.2.2 Independent Variables 3.2.2.1 Firm-specific Factors
Family ownership has sometimes been used in studying the relationship between corporate governance and capital structure, scarcely in MENA countries though. Nadaraja et al 2011 defined “family-owned firms” as those with more than 5% ownership of individual and
family members, while Santos et al 2014 required that 10% be owned by an individual investor, a family, or an unlisted company for a firm to be defined as family-owned. For this research, I start with a 5% threshold for a total of 298 firms, which is then brought down to 216 listed firms ranging from 10% to 90% family ownership, to avoid the problem of heteroscedasticity.
Profitability is measured by the return on equity ratio in order to avoid the econometric problem of multicollinearity among variables that use total assets in their definition. Other ratios such as operating income to total assets and return on assets are used for checking the robustness of the model. Growth is defined as the natural logarithm of the net sales of two consecutive years for firms. Since this model employs cross-sectional data, this calculation method will capture the growth of firms at one point of time and will facilitate growth comparison among firms, despite controlling for time. Similarly, Size is indicated by the natural logarithm for total assets of the inspected year only. Tangibility, measured by the ratio of net fixed assets to total assets, is vital for examining the capacity of firms to collateralize their debt. Non-debt tax shield, calculated as total depreciation and amortization to total assets, is used as an alternative to effective tax rates in order to capture the tax savings of debt, since other variables, such as effective tax rate (used by Tian and Zeitun (2007)) and debt usage (used by Bartholdy and Mateus (2011)), were not adequately available for my sample and hence I followed Wellalage and Locke (2013) and
Getzmann et al (2014) to use the non-debt tax shield in order to study the effect of debt tax savings on leverage. Liquidity can be measured by two ratios for robustness, current assets to total assets and current assets to current liabilities; however the latter is preferred in order to avoid the problem of multicollinearity. Risk, obtained from Datastream as the standard deviation of annual net income for 5 years, is excluded from the model, following those of Nadaraja et al
2011, Gungoraydinoglu et al 2011, Wahba 2014, and, Farooq 2015 due to the strong heteroscedasticity problem that was found to be persistent with all sub-samples employed.
3.2.2.2 Country-specific Factors
Institutional indicators are included in the model to assess the quality of public governance. Belkhir et al (2016) used three World Bank indices ranging between ±2.5, with negative being weak, while this research uses World Bank rankings of 1% to 100%. Rule of law
shows to what extent the country abides by the rule of law, and not rule of man, and have strong contract enforcement and property rights. As the country abides by the rule of law, firms will be more likely to raise debt since credit terms are facilitated and creditors’ rights are protected.
Regulatory Quality measures the extent of policy implementation and entrepreneurship
encouragement. Control of corruption evaluates the effectiveness of the government to control corruption and facilitate business conduct (Belkhir et al, 2016).
Macroeconomic factors give insight about the economic environment in which the studied firms operate. Koksal and Orman (2015) used GDP growth as a proxy for the growth opportunities that the economy provides to the firm. Therefore, the trade-off theory predicts a negative relation between leverage and GDP growth, while the pecking order theory predicts a positive relation. In addition, an increase in the Inflation rate, calculated as annual growth of Consumer Price Index, increases the tax advantage as interest rates (price of inflation) increase. Therefore, there is a positive correlation between leverage and inflation in the trade-off theory, while the pecking order theory does not provide a clear direction of the relationship between these two variables.
The following table (Table 1) summarizes the variables’ method of calculation employed in this paper and the literature reference of each.
Table 1: Description of Dependent and Independent Variables
Variable Calculation Literature Reference
Leverage LEV Total debt / Total assets
de Jong et al (2008), Belkhir et al (2016), Koksal and Orman (2015), Wahba (2014) [as independent variable]
Explanatory: Firm-specific Factors Family
Ownership FAM
Ownership of individual investors that are considered family members range between 10%-90%
New to Literature
Profitability
OI Operating income / Total assets
Belkhir et al (2016), de Jong et al (2008), Kayo and Kimura 2011, Koksal and Orman (2015), and Eldomiaty (2008)
ROA Net income / Total assets Bartholdy and Mateus (2011) and Wahba (2014)
ROE Net income / Total equity New to Literature
Growth GROWT
Natural logarithm of total sales of current year over previous year
Bartholdy and Mateus (2011) and Serrasqueiro and Caetano (2015)
Size SIZE Natural logarithm of Total assets
Bartholdy and Mateus (2011), Wahba (2014), Belkhir et al (2016), Bandyopadhyay and Barua (2016), and Eldomiaty (2008)
Tangibility TANG Net fixed assets/ Total assets
Wahba (2014), de Jong et al (2008), Kayo and Kimura 2011, Eldomiaty (2008), and Koksal and Orman (2015), Belkhir et al (2016),
Non-debt Tax
Shield NDTS
Total depreciation and amortization / total assets
Belkhir et al (2016), Eldomiaty (2008), and Koksal and Orman (2015)
Liquidity CACL Current assets / current liabilities
Wahba (2014), de Jong et al (2008), Bandyopadhyay and Barua (2016), and Eldomiaty (2008)
CATA Current assets / total assets Belkhir et al (2016)
Explanatory: Institutional and Macro-economic Factors (INMA) Rule of law RL WB Worldwide Governance
Indicator % Rank Belkhir et al (2016) and de Jong et al (2008)
Regulatory
Effectiveness RQ
WB Worldwide Governance
Indicator % Rank Belkhir et al (2016) and de Jong et al (2008)
Control of
Corruption CC
WB Worldwide Governance
Indicator % Rank Belkhir et al (2016) and de Jong et al (2008)
GDP GDP Annual growth of Gross
Domestic Product Belkhir et al (2016) and de Jong et al (2008)
Inflation INF Annual growth of Consumer
Chapter 4: Data Statistics
4.1 Research Questions
In order to highlight the key capital structure determinants of a sample of MENA firms and find out whether a correlation exists between family ownership concentration and the capital structure behavior of the sample firms, this thesis will employ a large cross-sectional sample at one point of time, 2015, and not panel data, as Farooq (2015)and Belkhir et al (2016)used for their models, since the degree of family ownership is not likely to be of a time-variant nature but is rather largely variant across different firms and countries. Second, the collection process of the family ownership variable is new to the literature since manual filtration has been conducted on over 900 firms from 12 countries, using Thomson Reuters Screener provided by Citadel Center for Financial Services. If not for the time constraint, this research could have been more
insightful if backed with a survey for firms’ management about their preferences and views for the family control; since empirical research does not always provide the exact interpretations as surveys do, as previously discussed.
4.2 Sample Selection
The sample under study is a cross-sectional data set of 216 firms listed on the stock exchanges of 11 MENA countries: UAE, KSA, Bahrain, Kuwait, Oman, Jordan, Lebanon, Morocco, Tunisia, Egypt, and Palestinian Territories, estimated for the year 2015. The originally collected sample was composed of 978 firms listed on the stock exchanges of 12 MENA
countries, including Qatar in addition to the aforementioned. For the sake of sample size consistency, however, and in order to have a balanced number of observations for all variables, the sample has been gradually modified to 216 firms.
The original sample has been modified several times in order to reach a balanced number of observations for all variables, with primary focus on the family ownership variable. On the onset of this research, I compiled 978 listed firms from 12 MENA countries and more than 30 sectors from Thomson Reuters’ Datastream using the provided codes for countries with active stock exchanges. Afterwards, I manually extracted the percentage of shares ownership from Thomson Reuters Screener. The Screener provides historical shareholding reports for individual firms that must be searched manually with details about the firm’s non-free float shares or the
strategic entities’ shares in the firm. The reports display the strategic entities’ type, name, and historical trend of their ownership as a percentage of total outstanding shares for the firm. Among all strategic entities, I distinguished the degree of family ownership by taking the
percentage of shareholding for family members and individual investors as of the year-end 2015. Among these 978 firms, some were excluded because 1) the ownership data were not available, 2) the firm has been delisted, or 3) the firm is considered a financial institution, which may distort analysis. In parallel with this exercise, the rest of the firm-specific variables were obtained from Datastream by the country coding for the years 2014 and 2015 for the sake of
measurements that involve natural logarithms. Finally, the institutional and macroeconomic data were collected from Datastream by country. In the filtered sample, the family ownership
contained a range of lower than 1% and more than 95%. It was then reduced to 298 observations with a threshold of 5%. The final sample, however, consists of 216 firms with family ownership range of 10%-90% in year 2015 from 11 MENA countries (excluding Qatar) and involves 30 sectors from consumer and non-consumer products.
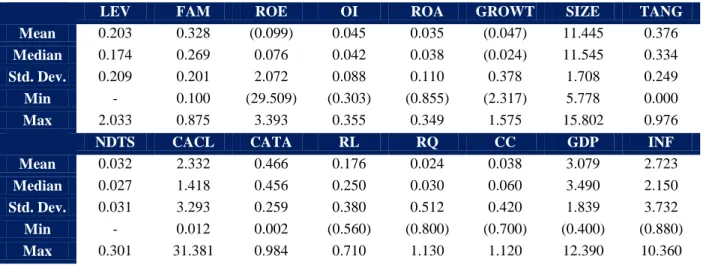
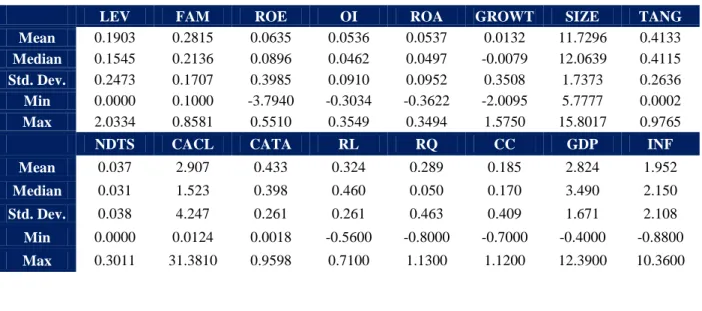
4.3 Descriptive Statistics Analysis
The following table (Table 2) displays the descriptive statistics of the variables, for Full Sample with 216 Observations, backed with a comparison between the samples of Farooq (2015)
and Belkhir et al (2016). Table 2: Descriptive Statistics
LEV FAM ROE OI ROA GROWT SIZE TANG
Mean 0.203 0.328 (0.099) 0.045 0.035 (0.047) 11.445 0.376
Median 0.174 0.269 0.076 0.042 0.038 (0.024) 11.545 0.334
Std. Dev. 0.209 0.201 2.072 0.088 0.110 0.378 1.708 0.249
Min - 0.100 (29.509) (0.303) (0.855) (2.317) 5.778 0.000
Max 2.033 0.875 3.393 0.355 0.349 1.575 15.802 0.976
NDTS CACL CATA RL RQ CC GDP INF
Mean 0.032 2.332 0.466 0.176 0.024 0.038 3.079 2.723
Median 0.027 1.418 0.456 0.250 0.030 0.060 3.490 2.150
Std. Dev. 0.031 3.293 0.259 0.380 0.512 0.420 1.839 3.732
Min - 0.012 0.002 (0.560) (0.800) (0.700) (0.400) (0.880)
My sample is less levered than that of Belkhir et al (2016), with an average leverage ratio of 20.3%, compared to Belkhir et al’s (2016) 33%. Also profitability in my sample is lower than that of Belkhir et al (2016) at an average of 3.5% compared to 7.3%. Growth is incomparable between this research and the paper by Belkhir et al (2016) as the data set used in this research is cross-sectional while they used a time-series. Firms of my sample (average normalized total assets of 11.4) are larger than that of Belkhir et al (2016) (4.9) and Farooq (2015) (6.2), with similar Tangibility to that of Belkhir et al (2016) (0.370) while Farooq’s (2015) tangibility’s
measure is different since he apparently used gross fixed assets to total assets ratio. Average non-debt tax shield is lower than that of Belkhir et al (2016) at 0.032 compared to 0.059, while
Chapter 5: Results
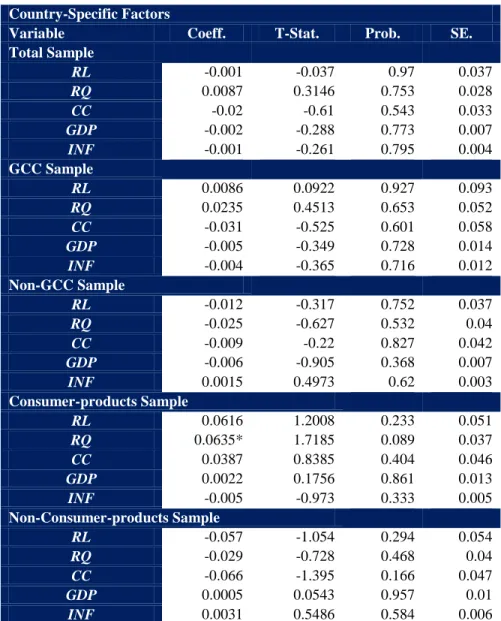
This chapter extensively explains the process, backed with tables in the appendix, by which the model was estimated after ensuring that the data is free of multicollinearity and heteroscedasticity and robustness of the model was tested. The next sections are ordered as follows: Section 1 shows the Correlation Matrix (Table 3) of the independent variables to ensure that the model does not have multicollinear predictors except with the country-specific factors and, therefore, the model will be estimated in two steps; Section 2 depicts the first step of the model estimation with the firm-specific factors and its results (Table 4), along with testing the robustness for profitability and liquidity (Table 5); Section 3 shows samples for testing the significance of the family ownership variable (Table 7) with explanation for the several model estimations with different samples (please refer to Section 2 of the appendix); Section 4 finally shows the second step of estimating the effect of the country-specific variables on leverage. 5.1 Correlation Matrix
The Pearson Correlation Matrix in Table 3 shows no sign of multicollinearity among independent variables, for the original sample of 216 observations, except for the institutional and macroeconomic set of variables. A set of equations will then be estimated with each equation includes one of these variables in addition to the original set of firm-specific variables as
explanatory variables.
In other words, the regression process will start with estimating the relation between the firm-specific variables and leverage. Afterwards, institutional and macroeconomic variables will be tested one at a time, by adding one variable each regression to the original set of firm-specific variables (please refer to Section 3 of the Appendix for INMA regressions with robustness of firm-specific variables and different samples).
Table 3: Correlation Matrix
Several models were estimated for robustness of results and ensuring the absence of heteroscedasticity. The significance level used in the entire research is 5%; Breusch-Pagan-Godfrey is the test employed for indicating the heteroscedasticity; ordinary correlation showed no sign of multicollinearity; nevertheless, variables that incorporate similar measures in their calculation are expected to reflect distorted results when regressed collectively against leverage that is calculated as total debt to total assets ratio.
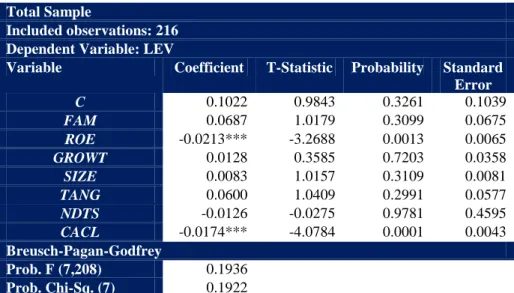
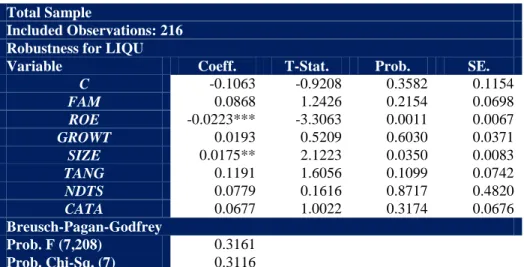
5.2 Firm-specific Determinants of Leverage
The inclusion of firm-specific variables in the equation is important in supporting or challenging the pecking order theory, resembling the findings of Farooq (2015) and Belkhir et al (2016). As we see in Table 4, among all variables, profitability (return on equity ratio and operating income to total assets) and liquidity (current assets to current liabilities) are negatively correlated with leverage. These findings are in line with Belkhir et al’s (2016) strong negative correlations with leverage. However, return on assets ratio results in heteroscedasticity, as seen in Table 5, and makes growth significant when used as an alternative to the ratios of return on equity and operating income to total assets. When replacing liquidity ratios, liquidity becomes insignificant, as shown in Table 6, when measured by current assets to total assets, while size does (with a positive correlation with leverage). This robustness check shows that
simultaneously using variables with total assets in their method of calculation may result in imprecise estimations.
LEV FAM ROE OI ROA GROWT SIZE TANG NDTS CACL CATA RISK RL RQ CC GDP INF
LEV 1.00 FAM 0.05 1.00 ROE -0.21 0.07 1.00 OI -0.17 0.06 0.11 1.00 ROA -0.23 -0.01 0.16 0.81 1.00 GROWT 0.04 -0.03 0.06 0.39 0.50 1.00 SIZE 0.14 -0.01 0.02 0.18 0.12 0.11 1.00 TANG 0.08 -0.11 0.04 0.00 -0.02 0.06 0.02 1.00 NDTS 0.05 -0.10 0.02 0.08 0.08 0.05 0.02 0.34 1.00 CACL -0.31 -0.04 0.03 -0.02 0.03 -0.07 -0.25 -0.10 -0.12 1.00 CATA 0.00 0.07 -0.06 0.14 0.08 -0.07 -0.12 -0.58 -0.06 0.15 1.00 RISK -0.40 0.02 0.11 0.73 0.65 0.22 0.14 -0.24 0.09 0.05 0.43 1.00 RL -0.02 -0.07 0.02 -0.07 0.01 0.24 -0.13 0.13 0.06 0.05 -0.22 -0.15 1.00 RQ 0.00 -0.10 0.05 -0.03 0.06 0.28 -0.01 0.12 0.09 0.05 -0.16 -0.09 0.86 1.00 CC -0.04 -0.04 0.01 -0.05 0.02 0.27 -0.02 0.08 0.01 0.03 -0.20 -0.10 0.92 0.87 1.00 GDP -0.01 0.04 0.09 0.03 -0.02 -0.03 0.07 0.08 -0.03 -0.07 0.01 0.05 -0.32 -0.01 -0.24 1.00 INF 0.01 0.01 -0.02 0.08 0.00 -0.14 0.29 -0.09 -0.06 -0.06 0.15 0.17 -0.79 -0.62 -0.55 0.15 1.00
Table 4: Original Sample Results1 Total Sample
Included observations: 216 Dependent Variable: LEV
Variable Coefficient T-Statistic Probability Standard Error C 0.1022 0.9843 0.3261 0.1039 FAM 0.0687 1.0179 0.3099 0.0675 ROE -0.0213*** -3.2688 0.0013 0.0065 GROWT 0.0128 0.3585 0.7203 0.0358 SIZE 0.0083 1.0157 0.3109 0.0081 TANG 0.0600 1.0409 0.2991 0.0577 NDTS -0.0126 -0.0275 0.9781 0.4595 CACL -0.0174*** -4.0784 0.0001 0.0043 Breusch-Pagan-Godfrey Prob. F (7,208) 0.1936 Prob. Chi-Sq. (7) 0.1922
Main significance level used is 5% in all regressions that have been run. However in regression results’ tables * is for significance at 10%, ** 5%, and *** 1%.
Table 5: Robustness for Profitability Total Sample
Included Observations: 216 Robustness for PROF
Variable Coeff. T-Stat. Prob. SE. Variable Coeff. T-Stat. Prob. SE.
C 0.1052 1.0319 0.3033 0.1019 C 0.0890 0.8552 0.3934 0.1041 FAM 0.0544 0.8225 0.4117 0.0661 FAM 0.0720 1.0670 0.2872 0.0675 ROA -0.6051*** -4.3256 0.0000 0.1399 OI -0.5621*** -3.3349 0.0010 0.1685 GROWT 0.0922** 2.2834 0.0234 0.0404 GROWT 0.0547 1.4173 0.1579 0.0386 SIZE 0.0110 1.3705 0.1720 0.0080 SIZE 0.0121 1.4679 0.1436 0.0082 TANG 0.0334 0.5882 0.5570 0.0568 TANG 0.0441 0.7653 0.4450 0.0576 NDTS 0.1509 0.3328 0.7396 0.4533 NDTS 0.1011 0.2193 0.8267 0.4609 CACL -0.0164*** -3.9063 0.0001 0.0042 CACL -0.0172*** -4.0548 0.0001 0.0043 Breusch-Pagan-Godfrey Breusch-Pagan-Godfrey Prob. F (7,208) 0.0216 Prob. F (7,208) 0.1234 Prob. Chi-Sq. (7) 0.0233 Prob. Chi-Sq. (7) 0.1238
Main significance level used is 5% in all regressions that have been run. However in regression results’ tables * is for significance at 10%, ** 5%, and *** 1%.
1
Tables displayed onward that do not show Breusch-Pagan-Godfrey test mean that Heteroscedasticity is not prevalent (probability is higher than the significance level of 5%).


![catena Poly[[{2 [(2 hydroxyethyl)iminomethyl] 6 methoxyphenolato}copper(II)] μ thiocyanato]](data:image/gif;base64,R0lGODlhAQABAIAAAP///wAAACH5BAEAAAAALAAAAAABAAEAAAICRAEAOw==)