CREDIT ALLOCATION ALONG
THE BUSINESS CYCLE: EVIDENCE
FROM THE LATEST BOOM BUST
CREDIT CYCLE IN SPAIN
Roberto Blanco and Noelia Jiménez
Documentos de Trabajo
N.º 1826
CREDIT ALLOCATION ALONG THE BUSINESS CYCLE: EVIDENCE FROM THE LATEST BOOM BUST CREDIT CYCLE IN SPAIN
CREDIT ALLOCATION ALONG THE BUSINESS CYCLE: EVIDENCE
FROM THE LATEST BOOM BUST CREDIT CYCLE IN SPAIN
(*)Roberto Blanco and Noelia Jiménez
BANCO DE ESPAÑA
(*) Acknowledgments: We thank Enrique Moral, seminar participants at the Banco de España and 26th Finance Forum and an anonymous referee for helpful comments.
Documentos de Trabajo. N.º 1826 2018
The Working Paper Series seeks to disseminate original research in economics and fi nance. All papers have been anonymously refereed. By publishing these papers, the Banco de España aims to contribute to economic analysis and, in particular, to knowledge of the Spanish economy and its international environment.
The opinions and analyses in the Working Paper Series are the responsibility of the authors and, therefore, do not necessarily coincide with those of the Banco de España or the Eurosystem.
The Banco de España disseminates its main reports and most of its publications via the Internet at the following website: http://www.bde.es.
Reproduction for educational and non-commercial purposes is permitted provided that the source is acknowledged.
© BANCO DE ESPAÑA, Madrid, 2018 ISSN: 1579-8666 (on line)
Abstract
Using a dataset that merges information of loan applications from the Spanish CCR with firms’ financial accounts, we find that during the great recession access to credit of firms with weak balance sheets deteriorated relative to other firms. However, contrary to the financial accelerator theory, we find that during the recovery phase after the latest recession access to credit of weaker firms did not improve relative to other firms and it even further deteriorated somewhat. We also provide empirical evidence that lending policies of banks with firms they are exposed to before the lending decision is taken are comparatively less sensitive to public information than those applied to new firms. This result, together with the positive correlation we find between firms’ access to bank loans and the number of firms’ bank credit relationships, might be linked to the existence of private information developed by banks through their interaction with borrowers. We also find that this relationship lending contributed to smooth credit contraction during the crisis.
Keywords: access to credit, borrower-lender relationships, loan applications. JEL Classification: E32, E51, G21.
Resumen
En este trabajo se explota una base de datos que fusiona la información sobre peticiones de crédito de la Central de Información de Riesgos con los estados contables de las empresas, mostrándose evidencia de que, durante la gran recesión que se inició en 2008, el acceso al crédito de las empresas españolas que presentaban una situación financiera más débil se deterioró en comparación con el del resto de empresas. Sin embargo, en contra de lo que indica la teoría del acelerador financiero, se encuentra que, durante la etapa de recuperación económica tras la última recesión, el acceso al crédito de las empresas con una situación financiera más débil no mejoró en relación con el del resto de compañías e incluso se deterioró algo. También se aporta evidencia empírica de que las políticas crediticias de los bancos con las empresas con las que mantenían relaciones crediticias previas son comparativamente menos sensibles a la información pública que aquellas aplicadas a las empresas con las que no mantenían relaciones previas. Este resultado, junto con la correlación positiva entre el acceso al crédito bancario de las empresas y el número de relaciones bancarias de estas, podría estar vinculado a la existencia de información privada adquirida por los bancos a lo largo de sus interacciones con sus deudores. Por último, también se encuentra que la existencia de estas relaciones entre deudores y acreedores habría contribuido a moderar la contracción del crédito durante la crisis.
Palabras clave: acceso al crédito, relaciones deudor-acreedor, peticiones de crédito. Códigos JEL: E32, E51, G21.
1 Introduction
Credit rationing is a well-established feature of credit markets. Its existence has been rationalised in the literature with the presence of various frictions and, in particular, with asymmetric information problems between lenders and borrowers. Theory suggests that access of firms to credit depends on the strength of their balance sheets and on their riskiness. In particular, firms with stronger balance sheets have a better access to credit than other firms. In the empirical literature, the most common variables used to proxy for the strength of the balance sheets are leverage and profitability. The riskiness of the firm is generally proxied by the existence of delinquent loans. There is also ample evidence that access of firms to credit is positively correlated with the size and age of the firm.
Another strand of literature emphasizes the role of borrower-lender relationships in mitigating the asymmetric information problems (Petersen and Rajan (1994), Berger and Udell (1992)). This literature argues that financial institutions, through their interactions with firms, develop private information about the firm’s financial prospects that can be useful in the decision to extend credit (Diamond, 1984). There is some empirical evidence that lenders are more likely to extend credit to firms with which they have pre-existing relationships (Cole, 1998). Some recent papers also document how the so called relationship lending can be an effective tool to smooth fluctuations in credit (Sette and Gobbi (2015), Bolton et al (2016)).
The banks’ credit supply fluctuates over time and these changes can have important implications for economic growth in terms of both investment and employment [Alfaro, García-Santa and Moral-Benito(2017), Amiti, Weinstein (2018), Bentolila, Jansen and Jiménez (2018), Chodorow-Reich (2014), Cingano, Manaresi and Sette (2016), Greenstone, Mas and Nguyen (2015), Huber (2018), Jiménez, Mian, Peydró and Saurina (2014), Khwaja, Mian (2008)].
There is evidence in the literature that banks’ credit supply fluctuate with the business cycle and with the changes in the monetary policy stance [Jiménez et al (2014), Jiménez et al (2012b), Dell’Ariccia, Laeven, Suárez (2017), Dell’Ariccia and Márquez (2006)]. In particular, this literature finds that bank lending standards tend to soften during times of strong economic growth and expansionary monetary policies and tend to tighten during crisis and contractionary monetary policies. There are different theories that provide a rationale for the changes in credit supply along the business cycle including herd behaviour (Rajan, 1994), agency problems (Williamson,1963) and institutional memory hypothesis (Berger and Udell, 2004).
The changes in lending standards can affect firms heterogeneously on the basis of their characteristics implying changes in credit allocation across firms. In particular, some papers show that during recessions borrowers with weak balance sheets experience a reduced access to credit relative to other borrowers (Bernanke, Gertler and Gilchrist, 1996; Jiménez, Ongena, Peydró and Saurina, 2012a; Rodano, Serrano and Tarantino, 2017; Jiménez, Moral-Benito and Vegas, 2018). The financial accelerator theory provides a rationale for this pattern, arguing that the changes in the access to credit along the business cycle amplify the fluctuations of the initial shocks (Bernanke, Gertler and Gilchrist, 1996).
This paper analyses how bank’s borrower selection changes along the business cycle using Spanish data covering the latest boom bust credit cycle. Spain is an interesting case study because the latest credit cycle has been particularly marked. Between 2000 and 2007
bank lending to firms grew at an annual average rate of 19%. During the great recession that started in 2008 and ended in mid-2013, bank lending to firms contracted at an average y-o-y rate of 4%, reaching the maximum y-o-y decline in June 2013 (10%). Since then the outstanding stock of bank lending has continued falling but the speed of contraction has moderated progressively against a background of an economic recovery.
The analysis of this paper is based on a dataset of loan applications matched with firm balance-sheet data. More specifically, through the information requests on firms´ credit situation from banks to the Spanish Central Credit Registry (CCR), we can identify a subset of firms seeking for bank financing, and we can also infer whether those firms finally obtained it by looking at the evolution of their credit balances in a certain period of time. We match this information with balance-sheet data to characterize the firm´s economic and financial situation.
With this dataset we estimate various models for the probability of firms’ success in their search for bank funding as a function of their characteristics. In contrast with other previous papers (Jiménez, Ongena, Peydró and Saurina, 2012a; Jiménez, Ongena, Peydró and Saurina, 2012b; Jiménez, Ongena, Peydró and Saurina, 2014; Jiménez, Moral-Benito and Vegas, 2018 for the Spanish CCR and Albertazzi, Bottero and Sene, 2014, for the Italian one), in which the success in the search for bank funding is defined at the firm-bank level, and in line with Galardo, Lozi and Mistrulli (2017), we define this success at the firm level. In other words, we want to know whether a firm searching for bank funding managed to obtain funds from any bank irrespectively of how many banks have actually approved the loan application of that firm. This approach is justified for two reasons. First, the main aim of the paper is to analyse how credit allocation to firms changes along the business cycle and, in particular, we want to know what type of firms obtain the new credit extended by the banking system in different phases of the business cycle. Second, by doing that we are able to take into account credit provided by banks that have current exposures to firms, something that is not possible with the information from CCRs when the success in the search for bank funding is defined at the firm-bank level. We show that this credit accounts for a significant proportion of overall credit extended by banks. This approach also allows us to compare banks’ lending standards depending on whether the bank has or has not exposures to a firm before the lending decision is taken. This is an important contribution of the paper.
In line with the prediction of the financial accelerator theory and with previous empirical papers, we find evidence that during the great recession access to credit of firms with weak balance sheets deteriorated relative to other firms. In other words, during the crisis banks discriminated more among firms according to the strength of their balance sheets. However, contrary to this theory and to the relationship between bank’s borrower selection and GDP growth found in other empirical papers (Jiménez, Moral-Benito and Vegas, 2018), we find that during the recovery phase after the latest recession access to credit of weaker firms did not improve relative to other firms and that it even further deteriorated somewhat. To the best of our knowledge, this is the first paper that finds this result.
Additionally, and in contrast with other papers that estimate the probability of firm’s success in the search for bank funding using CCRs, we assess the extent to which loan policies of banks with firms they have exposures before the lending decision is taken (old firms) differ from those with firms they are not exposed (new firms). In particular, we provide empirical evidence that lending policies with old firms are comparatively less sensitive to public information and that this relationship lending contributed to smooth credit contraction during the crisis. We also find that the number of bank credit relationships improves the access of
firms to bank loans. We argue that these results might be linked to the existence of private information developed by banks through their interaction with borrowers (Diamond, 1984; Cole, 1998). This is another contribution of the paper.
The rest of the paper is organised as follows. Section 2 describes the data, Section 3 presents the empirical strategy, Section 4 shows the results and, finally, Section 5 concludes.
2 Data
The database is made up combining two sources of information. First, we have access to information requests on firms by banks to the Spanish CCR. It is important to note that banks only submit information requests to the CCR for firms they have no current exposures with since for other firms they receive the CCR information by default. These information requests allows us to identify a subset of firms seeking for a bank loan. In particular, we identify those firms1 seeking for a loan when their application is submitted to a bank they have not credit
outstanding balances with (we will call these banks, new banks). On the other hand, as the CCR also contains information on the outstanding credit balances,2 by looking at the evolution
of them, we can infer whether or not the firm actually obtained the funds from the new bank or from any other bank (including those that the firm had already credit exposures with, which we will call old banks). In particular, in line with other papers using CCRs, we look at the change of outstanding loans and credit facilities between the month prior to the request of information and the following three months. If we observe an increase in the outstanding balances of credit for that particular firm we assume that the loan application was accepted.
We observe that most firms apply for a loan to more than one new bank around the same time (in particular to 1.3 new banks on average).3 Thus, firms seem to be shopping
around for the same loan trying to maximize the probability of obtaining a loan and, eventually, getting the best conditions. We define loan approval at the firm level. More precisely, in line with Galardo, Lozi and Mistrulli (2017) we consider a loan application submitted by the same firm to different banks with no more than three months between each request as a single loan application.
Second, to characterize firms’ economic and financial situation, data from the Central Balance Sheet Data Office (CBBO)4 are used. This dataset contains information on the financial
accounts of non-financial corporations (balance sheets and profit and loss accounts) of around 600,000 firms on an annual basis. Thus, by matching the fiscal identification number of firms seeking for bank loans obtained from the CCR with that of the ones included in the CBBO, we can merge the two datasets. As the frequency of these two datasets are different, it is assumed that the annual firm characteristics are constant throughout the natural year, therefore assigning the same value in all months of the same year. The combined dataset contains 1,241,365 monthly observations (i. e. firm loan applications) for the period from January 2004 to June 2016, corresponding to 579,518 firms.5
1 More precisely, limited and non-limited liability companies and cooperatives are considered in this paper.
2 The CCR contains detailed individualised data (such as credit balances or the volume of non-performing loans) on all the loans granted by credit institutions in Spain for amounts in excess of €6,000 with a monthly frequency.
3 We can only observe the applications to new banks. So this figure would be a lower bound for the total number of banks (new and old) that would receive the loan application.
4 For a detailed description of the Central Balance Sheet Data Office, see http://www.bde.es/bde/es/secciones/ informes/Publicaciones_an/Central_de_Balan/.
5 This is the number of observations once atypical values are excluded from the database. In particular, the 0.25% and 99.75% percentiles of observations of each variable are deleted.
3 Empirical strategy
Several linear probability models are estimated to assess the probability of firms’ success in their search for bank funding depending on a series of firm characteristics and a set of fixed effects. Coefficients are allowed to differ by sub-periods in order to test for the existence of changes in the elasticities along the business cycle.6 In particular, based on GDP growth of the
Spanish economy, three sub-periods were established: the expansionary phase prior to the crisis (which covers the period from 2005:1 to 2008:3), when GDP growth was positive; the crisis period (which covers from 2008:4 to 2013:9), when GDP growth was negative or equal to zero; and the recovery stage (which covers from 2013:10 to 2016:6), in which GDP growth became positive again.
The basic specification to be estimated is the following:
(1)
where Loani
t is a dummy variable that equals 1 if the search for a loan that started in month t
by firm i ends successfully within the following three months and 0 otherwise; Xi
z,t-1 is a vector
of Z characteristics of the firm i in month t-1;7 P2
tand P3t are dummy variables that equal 1 for
the crisis and recovery sub-periods, respectively, and 0 otherwise; fei are firm fixed effects; fet
are time fixed effects- and ui
t is the perturbation term. In particular, we include firm fixed effects
to account for particular invariant characteristics of the firm throughout the sample, such as legal status or geographical situation.8 On the other hand, month fixed effects are included,
aiming to capture the cyclical position of the economy. It is important to stress out that with this specification we intend to investigate the firm features that determine its actual access to credit, regardless of the bank characteristics that may influence on it.
We assume that a firm is seeking for a loan when we observe an information request. And we assume that the search for a loan that started in month t by firm i ends successfully within the following three months if the overall outstanding stock of bank credit plus credit lines of that particular firm increases between month t-1 and month t+3.
3.1 Dependent variables
In the paper, we consider two alternative dependent variables (see definitions in Table 1). The first variable equals 1 if the loan is granted by any bank (new or old bank) and 0 otherwise. The second variable equals 1 if the loan is granted by at least one new bank and 0 otherwise. The first variable is the main variable of interest since it takes into account all credit granted to our sample of firms seeking for a loan. The second variable, which is more restrictive, is useful to analyse the extent to which banks’ loan policies with firms differ depending on the existence of pre-existing credit exposures. There are two main reasons to expect that banks’ loan policies can be different with new firms (firms which do not have outstanding credit balances with a particular bank before the submission of the application) vis-à-vis old firms (those which have outstanding credit balances with a particular bank before the submission of the application).
6 All estimates were made clustering at firm level.
7 All independent variables are lagged one period, as that is the public information for the bank that was available when it received the loan application.
8 The introduction of firm fixed effects means that the coefficients of the variables of interest are estimated using the time variation for those firms which are observed at least twice during each sub-period. In the interpretation of results we will assume that these coefficients are the same for all firms.
First, through interactions with “old” firms banks develop private information about their riskiness that can be useful in the decision to extend credit (Diamond, 1984). Second, regardless of the possible existence of private information, the optimal lending policy with new firms can differ compared to that with old firms. For example, the rejection of an application submitted by an old firm with difficulties in its access to external finance might end up in the default of existing loans. Therefore, banks might have incentives to approve loan applications submitted by old firms even if the current financial position of those firms is weak. All in all, this discussion suggests that banks’ lending policies with old firms might be less sensitive to firms’ public information than those policies applied to new firms. We test for this hypothesis in the next Section.
Chart 1 shows the percentage of successful firms (success rate), i. e. the percentage of firms that obtained bank funding, per year according to the two definitions. As it was expected, during the great recession that started in 2008, the success rate declined strongly, suggesting a deterioration in the access of firms to credit. During 2008 and 2009 the fall in the success rate was more dramatic when old banks are not considered, suggesting that during this period old banks smoothed somehow the decline in the access of firms to credit. In the following years, the success rate using the second definition (i.e. old banks are excluded) fell more gradually, whereas the one computed using the first definition (i. e. old banks are also considered) showed a more gradual decline during the crisis. It was not until 2013, along with the economic recovery of the Spanish economy, when the success rate using the second definition increased, and one year later when all banks are considered. By mid-2016, these proportions were around 15 pp lower than in 2005.
It is worth noting that the success rate using the first definition is, on average, around 25 pp higher than that obtained with the second definition, being the differences relatively stable along the sample period (see Chart 1 and Table 2). This illustrates the importance of including old banks in the analysis of credit allocation, something which has been neglected in previous papers based on CCRs’ loan applications.
Finally, the descriptive statistics of Table 2 show that the dispersion of the dependent variables, proxied by their standard deviation, was relatively stable by sub-periods.
3.2 Independent variables
Among firms’ explanatory variables, we include those related to firms’ financial and economic situation. In particular, we consider the following: indebtedness (calculated as the costly debt that is, total debt minus trade credit liabilities, minus cash and other liquid assets, over total assets), financial burden (defined as the financial costs over the gross operating profit plus the financial revenues),9 and ROA (measured as ordinary return over net assets). We also include a
measure of total factor productivity (TFP), in logarithms, calculated following Wooldridge (2009)10 and a measure of collateral availability of the firm, calculated as the total tangible fixed
assets over total assets. As a measure of the riskiness of the firm we use the previous doubtful loan variable, which is a dummy that equals one if the firm had in the previous month any non-performing loans with any bank and zero otherwise. We also include the number of banks with which the firm had credit relationships in the previous month. The information of the latest two variables is obtained from the CCR. Finally, we include the age (logarithm of the number
9 In those cases in which the financial burden was negative –given that the denominator, as a proxy for profits, could be negative–, the maximum level of the financial burden ratio in the corresponding year has been assigned. This decision was taken because a negative value for this variable means a weak financial position.
10 The method suggested in Wooldridge (2009) basically consists on estimating a Cobb-Douglas production function equation for the sector of the firm, and applying the sector estimated coefficients to the individual firm data.
of years of existence of the company plus one) and the size (logarithm of total assets) of the firm. Table 1 shows a summary of all the independent variables included in our estimations.
An array of some descriptive statistics for the firm variables can be found in Table 2. It is worth mentioning first that the standard deviation of the variables is relatively high suggesting a high dispersion of firm characteristics. The percentage of firms with outstanding doubtful loans grew notably during the crisis and rose even more, on average, during the third sub-period covering the recovery phase. The median and average indebtedness of firms in the sample fell during the great recession period and continued falling in the recovery sub-period after the crisis in line with the significant deleveraging of the corporate sector that has taken place in the Spanish economy since the outbreak of the crisis. Median and average financial burden, on the contrary, increased during the crisis since the reduction in indebtedness was more than offset by the contraction of profits (denominator of this variable). During the economic recovery sub-period the average financial burden remained relatively stable whereas the median value fell. It is remarkable that the dispersion of this variable has steadily risen along the three sub-periods. The average and median values of ROA decreased during the great recession sub-period and declined more in the third sub-period covering the recovery phase. As regards TFP, both the average and the median values little changed during the crisis sub-period whereas they increased during the recovery one. The average number of bank relationship fell along the sample period from 2.6 in the expansionary sub-period before the crisis to 2.2 in the economic recovery sub-period. It is noticeable that in this last sub-period less than 50% of firms had more than one bank relationship. The average (and median) values for the size variable increased between the first and the second sub-periods and remained stable during the third one. By contrast, the median and average age of firms showed an upward trend along the sample period considered. Finally, on average, the proportion of firms´ tangible assets rose somewhat during the crisis and decreased in the last sub-period.
4 Results
For each of the two dependent variables considered, several specifications of the general equation previously described have been estimated. First, we estimate the most general specification, where all independent variables are included (specification 1). Given that ROA is strongly correlated to both TFP and financial burden –as its denominator is a measure of profitability–, we have included four additional specifications in which we consider different combinations of these three variables (specifications 2 to 5). And lastly, we present the specification that includes only the most relevant variables (in terms of statistical significance) for which reasonable results (in terms of theoretical grounds) have been obtained (specification 6). In the Section 4.4, we carry out a robustness analysis using a specification in which the probability of a firm i obtaining a loan from a particular new bank j is modelled as a function of firm variables, including firm fixed effects to account for time-invariant demand factors and bank-time effects to account for time-varying supply factors.
4.1 Probability of obtaining a loan with any bank
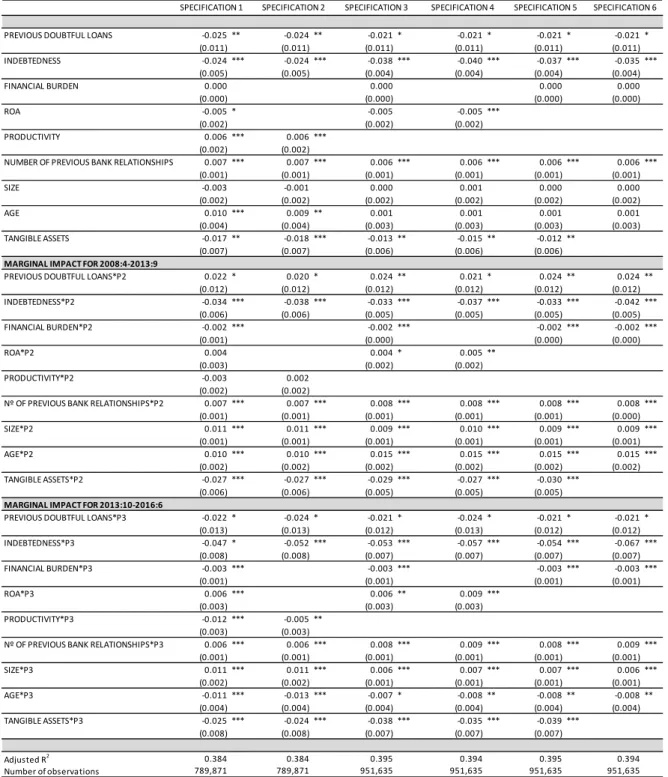
Table 3 shows the estimated coefficients of the explanatory variables for the probability of obtaining a loan with any bank, which is our main dependent variable. Given the use of dummy interacted variables, the coefficients of the regression measure the total impact of independent variables for the first period and the additional marginal impact for the two other sub-periods. Table 4 shows the total impact of each independent variable in every sub-period.11
As expected, and in line with the results of other papers, we find evidence that during the expansionary period before the crisis firms’ indebtedness was negatively associated with the probability of success in loan applications. The coefficient of this variable is negative and statistically significant in all specifications. An increase of 1 pp on the debt ratio would translate in a reduction of the probability of success in the loan application of between 0.02 pp and 0.04 pp. By contrast, the coefficients of the other variables that capture the strength of firms’ balance sheets (financial burden, ROA) or the creditworthiness of the firm (previous doubtful loans) are either not statistically significant or they are only weakly significant across the different specifications. These results therefore suggest that firms’ indebtedness was a key variable for the success of loan applications during the expansionary period before the crisis.
We also find evidence that during the pre-crisis period the probability of success in loan applications increased with the number of bank relationships, in line with the results of Cole (1998). This result is consistent with the idea that banks develop private information through their relationships with borrowers that can be useful in the decision to extend credit (Diamond,1984).
According to the estimation results, during the expansionary period before the crisis TFP was positively correlated with the probability of success in loan applications. The coefficient of this variable is positive and statistically significant in the specifications in which this variable is included. The size of the firm, proxied by total assets, did not seem to have affected the outcome of loan applications before the crisis. The coefficient of age is positive, suggesting that older firms have a better access to credit, but it is only statistically significant
11 This Table shows the level of the coefficients for the variables of interest for each sub-period and whether or not they are statistically significant. By contrast, Table 3 shows the level these coefficients for the first sub-period (expansion before the crisis) and the difference of these coefficients between periods 2 (crisis) and 1 and between sub-periods 3 (recovery after the crisis) and 1.
in specifications 1 and 2. Lastly, the coefficient of the percentage of tangible assets, which is a measure of the collateral available to the firm when seeking for financing, is significant in the years previous to the crisis but shows a striking negative effect, contrary to what would be expected.
The estimated coefficients for the variables that interact the dummy P2 with firm characteristics, which capture the marginal effects for the great recession sub-period, show that the sensitivity of the probability of success in loan applications to the strength of firms’ balance sheets increased during this phase relative to the pre-crisis period. In particular, the coefficients that capture the marginal effects during this period associated to firms’ indebtedness and firms’ financial burden are both statistically significant across all specifications and their sign is negative. The financial burden, which seems to have been irrelevant for banks in their lending policies during the years prior to the crisis, turned out to be an important determinant for the outcome of loan applications during the great recession (see Table 4). This evidence suggests that during the great recession banks’ lending decisions became more sensitive to changes in the financial position of firms.
The coefficient that measures the marginal impact of the number of bank relationships is also statistically significant in all specifications and has a positive sign, suggesting that this variable had a more important role during the great recession than in the years prior to the crisis when it comes to the access of firms to bank loans. Similarly, the share of tangible assets of the firm had an additional negative impact during the crisis, which is statistically significant.
Size and age of the firm, which according to the results were irrelevant for bank lending policies in the pre-crisis period in most of the specifications, turned out to be consistently important variables during the great recession. By contrast, the impact of TFP on the outcome of loan applications was not statistically different during the crisis.
In line with the results obtained for the marginal impacts during the great recession, the estimated coefficients for the variables that interact the dummy P3 with firm characteristics, which capture the marginal effects for the recovery sub-period, show that the sensitivity of the probability of success in loan applications to the strength of firms’ balance sheets increased during the recovery phase relative to the pre-crisis period. At the same time, the estimated coefficients that measure these marginal effects are larger than those corresponding to the crisis period suggesting that banks’ lending decisions became even more sensitive to changes in the financial position of firms during the economic upturn.
Also, in line with the marginal effects for the crisis sub-period, we find evidence that during the recovery the number of bank relationships and the size of the firm played a more important role than in the years prior to the crisis when it comes to the outcome of loan applications. By contrast, the opposite is found for age and TFP. Thus, these variables became less important determinants of the access of firms to bank loans in the recovery sub-period.
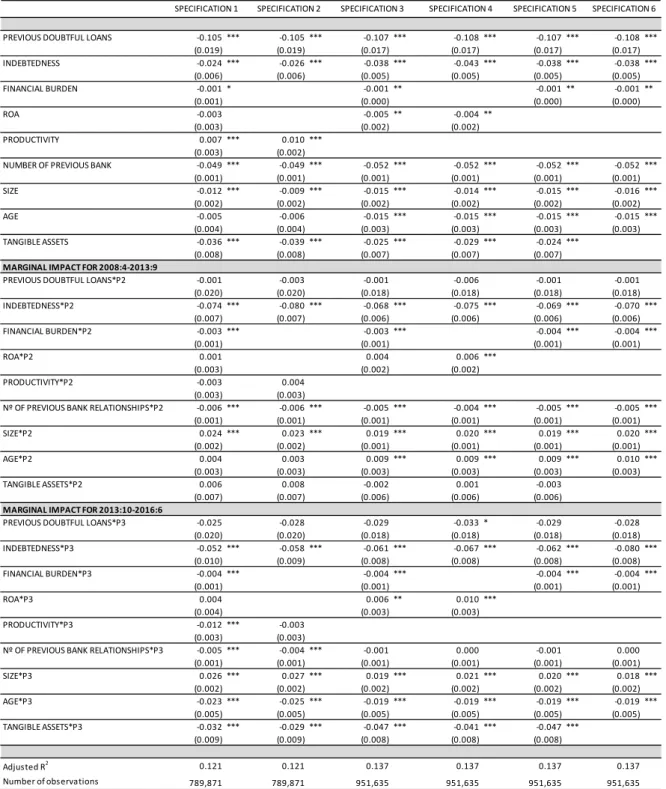
4.2 Probability of obtaining a loan with at least one new bank
When lending decisions of old banks are not considered, some of the main results remain (see Tables 5 and 6 for the marginal and the total impacts, by sub-periods, of the explanatory variables on the probability of obtaining a loan with at least one new bank). In particular, the strength of firms’ balance sheets are positively associated with the probability of success in loan applications and its impact increased during the crisis and it did so even further during
the recovery. Also, the share of tangible assets show an unexpected negative effect on the probability of obtaining a loan.
However, there are also some remarkable differences in the results that are worth noting. First, the coefficients of the variables that measure the creditworthiness of firms and the strength of their balance sheets are larger (in absolute terms) and are more significant than in the case in which old bank lending decisions were considered. In particular, the existence of doubtful loans becomes an important variable when it comes to access to bank loans. According to the estimates of specification 6, having previous doubtful loans reduced the probability of obtaining a loan with at least one new bank by 11 pp during the expansionary period before the crisis, against 2 pp when old banks are considered, and by 14 pp during the recovery phase (against 4 pp when old banks are considered). Also, the coefficient for the financial burden variable, which was not statistically significant in the years prior to the crisis in the estimates presented in Section 4.1, now becomes statistically significant in that period and rises throughout the sample period. Likewise, the coefficients of indebtedness rise notably compared to the results of Section 4.1.
Second, in contrast with the results presented in Section 4.1, the number of bank relationships reduces the chances that banks extend credit to new firms (i. e. firms with which they do not have existing exposures). This result is consistent with the evidence reported by Cole (1998).
And third, age and total assets have in some specifications and sub-periods a negative effect on the probability of success in loan applications being their coefficients statistically significant in some cases. These results could be related to a possible bias in our sample. In particular, the CCR only provides information on loan applications from firms that apply for loans to banks with which they have no previous exposure. In this regard, this finding could reflect the fact that larger and older firms applying for loans to banks with which they have no exposure tend to be riskier than other firms with similar observable characteristics. In particular, some of those firms may be seeking loans from new banks because their usual banks have refused to grant them funding in view of their perceived poor credit quality.
These results therefore provide some evidence that lending policies of banks differ depending on whether or not the bank has exposures to the firm that has submitted the loan application. In particular, our results suggest that banks discriminate more among firms according to the public information on their financial situation when they lend to “new” firms than when they lend to “old” ones (i. e. firms with which they have existing exposures).
4.3 Illustration of results
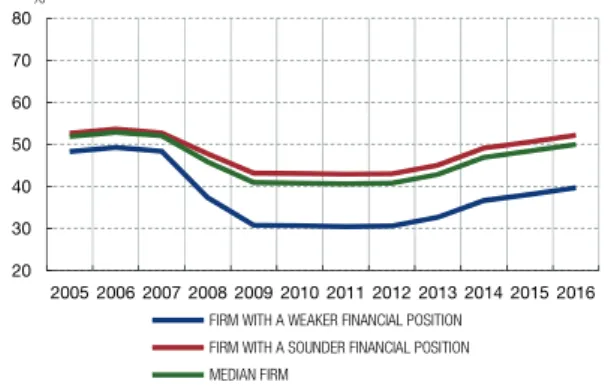
To illustrate the implications of the previous results we compute the estimated probability of success in loan applications using both definitions (i.e. including and excluding old banks, respectively) for three different representative firms with constant characteristics over time: the median firm, a firm with a stronger financial situation and a firm with a weaker financial situation. To compute these probabilities for the median firm, we take the median value over the whole sample period of every independent variable and keep its value constant over time. For firms in a weaker and a stronger financial positions, the value of the 90th and 10th percentiles,
respectively, of the financial burden and the indebtedness are taken and the median for the other variables.12
Chart 2 displays the results of this exercise. It can be seen that during the expansionary period prior to the crisis, the probability of success in loan applications was very similar among the different types of firms for both definitions, suggesting that banks discriminated very little among them depending on their financial strength. From 2007 onwards, the probability of success in loan applications declined for all firms but the decrease was more marked for those with higher debt and financial burden ratios than for those in a better financial situation. As a result, the gap in probabilities between these firms widened significantly. During the recovery phase that started in the second half of 2013, this gap widened even more. These findings suggest that since the outbreak of the crisis banks have been discriminating more depending on the firm characteristics than they used to do before the great recession.
The comparison between the estimated probabilities using the two definitions confirms the results of Chart 1. First, it can be seen that the estimated probability of obtaining a loan with any bank is significantly higher than that obtained when old banks are excluded. Second, at the beginning of the crisis, the estimated probability of obtaining a loan with at least a new bank adjusted faster than that of obtaining funds with any bank, suggesting that old banks tended to smooth the reduction in the availability of credit. And third, the recovery in the probability of success in loan applications started one year earlier when old banks are not considered (2013 vs 2014).
Finally, Chart 2 also shows that, in mid-2016, the probability of obtaining a loan with any bank was around 14 pp and 6 pp lower than in 2005 for the weaker and stronger firms, respectively. And the probability of obtaining a loan with at least one new bank has fallen by 11 pp and 1 pp, respectively, between these dates.
4.4 Robustness analysis
It could be argued that the above estimations could potentially be biased because the specification does not account for unobservable heterogeneity of banks. In particular, the higher discrimination among firms according to the strength of their balance sheets that we document after the crisis could potentially be the result of the fact that weak firms only apply for loans to bad banks and these banks were not in a position to lend any firm. To rule out this hypothesis and check the robustness of our results to the unobservable heterogeneity of banks, in this Section we use a specification at the firm-bank level that includes both firm fixed effects to account for time-invariant demand factors and bank-time fixed effects to account for time-varying supply factors. In particular, we consider the following specification:
(2)
where Loanij
t is a dummy variable that equals 1 if the loan application by firm i to bank j
ends successfully, fej*fet are bank-time fixed effects (Xi
z,t-1, fei, P2t, and P3t are defined as in
equation (1)).
Tables 7 and 8 show the results of the estimations. As can be seen, the estimated coefficients and their significance are quite similar to those obtained in Section 4.2. Like before, the less financially sound the position of the firm is, the less likely it is for the firm to obtain the
12 The average firm fixed effect for the whole period is considered for the three types of firms. For each month, the corresponding fixed time effect is included.
loan; the age, the number of previous bank relationships and the amount of tangible assets also diminishes the probability of obtaining financing; size has a positive or negative effect depending on the period; and productivity has in general a positive impact. At the same time, in line with the previous results, the coefficients related to the strength of firm’s balance sheets increase in absolute terms during the crisis and the recovery period, confirming the change in bank’s lending policies since the onset of the crisis. In other words, these results confirm that the higher discrimination of banks among firms according to the strength of their balance sheets since the onset of the crisis that we document in previous sections is robust to time-varying unobservable supply factors.
To illustrate these results, Chart 3 displays the average probability of obtaining a loan from any new bank for the three different representative firms with constant characteristics over time13 -the median firm, a firm with a stronger financial situation and a firm with a weaker
financial situation. This Chart is very similar to the right hand panel of Chart 2. Again, the probability of being granted a loan diminished after the onset of the crisis for all the firms, but more deeply for those in a worst financial situation, and during the economic recovery years, this gap between the sounder and weaker firms has not fallen, signalling a change in the bank’s lending policies.
13 For the three different kind of firms, this probably is computed using the average firm fixed effect for the whole period and the average bank-time fixed effect for each month.
5 Conclusions
Using a dataset that merges information of loan applications from the Spanish CCR with firms’ financial accounts, we have provided evidence that access of firms to bank loans depends positively on the strength of their balance sheets, their creditworthiness, their productivity, their size, their age and the number of firm’s bank relationships. These results are, in general, consistent with previous research.
In line with the prediction of the financial accelerator theory and with previous empirical papers, we find evidence that during the great recession access to credit of firms with weak balance sheets deteriorated relative to other firms. However, contrary to this theory, during the recovery phase after the crisis access to credit of weaker firms did not improve relative to other firms and it even further deteriorated somewhat. To the best of our knowledge, this is the first paper that finds this result.
This result also contrasts with the relationship between bank’s borrower selection and GDP growth found in other empirical papers. In particular, Jiménez, Moral-Benito and Vegas (2018) found that when GDP grows banks do not discriminate among borrowers according to their risk. Our results suggest that the empirical relationship between bank’s borrower selection and GDP growth documented in the previous paper seems to be dominated by the behaviour of banks during the expansionary period before the crisis but it does not hold during the expansionary phase after the crisis.
These results suggest that during the current expansionary period banks are discriminating more among firms according to the strength of their balance sheets in comparison with the situation before the crisis. In particular, banks’ lending policies are now more sensitive to firms’ indebtedness and financial burden. Various factors can potentially account for this change. First, this change might have resulted from the lessons learnt by banks during the crisis. In particular, the great recession of the Spanish economy was accompanied by a significant deterioration of bank balance sheets to the point that a restructuring and recapitalization of the banking system was needed. Second, the restructuring of the banking system has implied a change in the banking structure: weaker banks have either disappeared or been acquired by stronger banks, the governance and regulation of savings banks (which accounted for around half of the banking system in terms of lending before the crisis) have changed significantly. Third, as a result of the crisis the regulation of banks have been reformed at the international level with the aim to improve their resilience and their procyclical behaviour. In this paper none of these hypotheses have been tested. We left this important issue for future research.
Finally, we provide empirical evidence that lending policies of banks with firms they have exposures before the lending decision is taken are comparatively less sensitive to public information than those applied to new firms. This is another contribution of the paper. This result, together with the positive correlation we find between firms’ access to bank loans and the number of bank credit relationships, might be linked to the existence of private information developed by banks through their interaction with borrowers (Diamond, 1984; Cole, 1998).
REFERENCES
ALBERTAZZI, U., M. BOTTERO and G. SENE (2014). “Sharing information on lending decisions: an empricial assessment”, Banca d’ Italia Termi di Discussione 980.
ALFARO, L., M. GARCÍA-SANTANA and E. MORAL-BENITO (2017). “On the Direct and Indirect Real Effects of Credit Supply Shocks,” Working Paper.
AMITI, M., and D. E. WEINSTEIN (Forthcoming). “How Much do Idiosyncratic Bank Shocks Affect Investment? Evidence from Matched Bank-Firm Loan Data,” Journal of Political Economy.
BENTOLILA, S., M. JANSEN and G. JIMÉNEZ (Forthcoming). “When Credit Dries up: Job Losses in the Great Recession,” Journal of the European Economic Association.
BERGER, A. N., and G. F. UDELL (1992). “Some evidence on the empirical significance of credit rationing”, Journal of Political Economy, 100, 1047-1077.
BERGER, A. N., and G. F. UDELL (2004). “The institutional memory hypothesis and the procyclicality of nak lending behaviour”. Journal of Financial Intermediation, 13, 458-495.
BERNANKE, B. S., M. GERTLER and S. GILCHRIST (1996). “The financial accelerator and the flight to quality”, Review of Economics and Statistics 78, 1-15.
BLATTNER, L., L. FARIHAN and F. REBELO (2017). “When Losses Turn Into Loans: The Cost of Undercapitalized Banks,” Working Paper.
CHODOROW-REICH, G. (2014). “The Employment Effects of Credit Market Disruptions: Firm level Evidence from the 2008-9 Financial Crisis,” The Quarterly Journal of Economics, 129(1), 1–59.
CINGANO, F., F. MANARESI and E. SETTE (2016). “Does credit crunch investments down? New evidence on the real effects of the bank-lending channel,” The Review of Financial Studies, 29(10), 2737–2773.
COLE, R. A. (1998). “The importance of relationships to the availability of credit”, Journal of Banking and Finance 22, 959-977. DELL’ARICCIA, G., L. LAEVEN and G. SUÁREZ (2017). “Bank leverage and monetary policy’s risk-taking cannel: evidence
from the United States”. The Journal of Finance 72 (2), 613-654.
DELL’ARICCIA, G., and R. MÁRQUEZ (2006). “Lending booms and Lending standards”, The Journal of Finance, 61 (5), 2511-2546.
DIAMOND, D. (1984). “Financial intermediation and delegated monitoring”, Review of Economic Studies 51, 393-414. GALARDO, M., M. LOZI and P. E. MISTRULLI (2017). “Social capital, uncertainty and the credit supply: evidence from the
global crisis”, Unpublished paper.
GREENSTONE, M., A. MAS and H. L. NGUYEN (2015). “Do Credit Market Shocks Affect the Real Economy? Quasi-Experimental Evidence from the Great Recession and ’Normal’ Economic Times,” Working Paper.
HUBER, K. (Forthcoming). “Disentangling the Effects of a Banking Crisis: Evidence from German Firms and Counties,” American Economic Review.
JIMÉNEZ, G., A. MIAN, J. L. PEYDRÓ and J. SAURINA (2014). “The Real Effects of the Bank Lending Channel,” Working Paper.
JIMÉNEZ, G., E. MORAL-BENITO and R. VEGAS (2018). Bank lending standards over the cycle: the role of firms’ productivity and credit risk, Working Paper 1811, Banco de España.
JIMÉNEZ, G., S. ONGENA, J. PEYDRÓ and J. SAURINA (2012a). “Credit supply vs demand: bank and firm balance-sheet channels in good and crisis times”, CentER Discussion Paper, Vol 2012-005, Tilburg: Finance.
(2012b). “Credit supply and monetary policy: identifying the bank balance-sheet channel with loan applications”, The American Economic Review, 102 (5), 2301-2326.
(2014). “Hazardous times for monetary policy: what do twenty-three million bank loans say about the effects of monetary policy on credit risk-taking?”, Econometrica, 82 (2), 463-505.
KHWAJA, A., and A. MIAN (2008). “Tracing the Impact of Bank Liquidity Shocks: Evidence from an Emerging Market,” American Economic Review, 98(4), 1413–1442.
PETERSEN, M. and R. RAJAN (1994). “The benefits of lending relationships: evidence from small business data”, Journal of Finance, 49, 3-37.
RAJAN, R. (1994). Why credit policies fluctuate: a theory and some evidence”, The Quarterly Journal of Economics, 109 (2), 399-441.
RODANO, G., N. SERRANO VELARDE and E. TARANTINO (2017). “Lending standards over the credit cycle”. Working paper.
SETTE, E., and G. GOBBI (2015), Relationship lending in a financial crisis”, Journal of the European Economic Association, 13 (3), 453-481.
WILLIAMSON, O. (1963). “Managerial discretion and business behaviour”, American Economic Review, 1032-57. WOOLDRIDGE, J. M. (2009). “On estimating firm-level production functions using proxy variables to control for
CHARTS AND TABLES
CHART 1
SUCCESS RATE (a)
30 40 50 60 70 80 90 2005 2006 2007 2008 2009 2010 2011 2012 2013 2014 2015 2016 LOAN APPROVED BY, AT LEAST, ONE NEW BANK LOAN APPROVED BY ANY BANK
%
(a) Annual averages.
CHART 2
ESTIMATED PROBABILITY OF OBTAINING A LOAN (a)
20 30 40 50 60 70 80 2005 2006 2007 2008 2009 2010 2011 2012 2013 2014 2015 2016 FIRM WITH A WEAKER FINANCIAL POSITION
FIRM WITH A SOUNDER FINANCIAL POSITION MEDIAN FIRM
2 ESTIMATED PROBABILITY OF OBTAINING A LOAN WITH, AT LEAST, ONE NEW BANK (annual average) % 20 30 40 50 60 70 80 2005 2006 2007 2008 2009 2010 2011 2012 2013 2014 2015 2016 FIRM WITH A WEAKER FINANCIAL POSITION
FIRM WITH A SOUNDER FINANCIAL POSITION MEDIAN FIRM
1 ESTIMATED PROBABILITY OF OBTAINING A LOAN WITH ANY BANK (annual average)
%
(a) The computation of these probabilities are based on the results from specification 6 of Tables 3 and 5 (depending on the definition of the probability of obtaining a loan).For the computation of the probability for the median firm, the median value over the whole sample period of every independent variable is taken and kept constant over time. For firms in a weaker and a stronger financial positions, the value of the 90th and 10th percentiles, respectively, of the financial burden and the indebtedness are taken and the median for the other variables and also kept constant over time. For the three types of firms, the average firm fixed effect is considered for the whole period and the corresponding month fixed effect is added.
CHART 3
ESTIMATED PROBABILITY OF OBTAINING A LOAN (a)
20 30 40 50 60 70 80 2005 2006 2007 2008 2009 2010 2011 2012 2013 2014 2015 2016
FIRM WITH A WEAKER FINANCIAL POSITION FIRM WITH A SOUNDER FINANCIAL POSITION MEDIAN FIRM
ESTIMATED PROBABILITY OF OBTAINING A LOAN WITH A NEW BANK (annual average)
%
(a) The computation of these probabilities are based on the results from specification 6 of Table 7. For the computation of the probability for the median firm, the median value over the whole sample period of every independent variable is taken and kept constant over time. For firms in a weaker and a stronger financial positions, the value of the 90th and 10th percentiles, respectively, of the financial burden and the indebtedness are taken and the median for the other variables and also kept constant over time. For the three types of firms, the average firm fixed effect is considered for the whole period and the average bank-time fixed effect for each month.
TABLE 1. DEFINITION OF VARIABLES
Variable Definition
Loan approved by any bank Dummy variable that takes value 1 if the loan was granted by any bank and 0 otherwise Loan approved by at least one new bank Dummy variable that takes value 1 if the loan was granted by at least one new bank and 0 otherwise
Previous doubtful loans Dummy variable that takes value 1 if the firm had in the previous month any non-performing loan and 0 otherwise Indebtedness Ratio of total debt minus trade credit liabilities minus cash and other liquid assets over total assets
Financial burden Ratio of financial costs over gross operating profit plus financial revenues
ROA Ordinary return on assets
Productivity Logarithm of total factor productivity
No. of previous bank relationships Number of banks with which the firm had credit relationships in the previous month
Size Logarithm of total assets in thousand euro
Age Logarithm of the number of years of existence of the company plus one
TABLE 2. DESCRIPTIVE STATISTICS (a) Average Median 10 th percentile 90th percentile Standard deviation Loan approved by any bank
TOTAL SAMPLE 0.677 1.000 0.000 1.000 0.468
2005:1-2008:3 0.766 1.000 0.000 1.000 0.423
2008:4-2013:9 0.653 1.000 0.000 1.000 0.476
2013:10-2016:6 0.633 1.000 0.000 1.000 0.482
Loan approved by at least one new bank
TOTAL SAMPLE 0.432 0.000 0.000 1.000 0.495
2005:1-2008:3 0.532 1.000 0.000 1.000 0.499
2008:4-2013:9 0.392 0.000 0.000 1.000 0.488
2013:10-2016:6 0.415 0.000 0.000 1.000 0.493
Previous doubtful loans
TOTAL SAMPLE 0.018 0.000 0.000 0.000 0.132 2005:1-2008:3 0.007 0.000 0.000 0.000 0.085 2008:4-2013:9 0.018 0.000 0.000 0.000 0.132 2013:10-2016:6 0.032 0.000 0.000 0.000 0.175 Indebtedness TOTAL SAMPLE 0.270 0.196 0.000 0.683 0.288 2005:1-2008:3 0.332 0.275 0.000 0.787 0.316 2008:4-2013:9 0.260 0.190 0.000 0.653 0.279 2013:10-2016:6 0.217 0.129 0.000 0.575 0.260 Financial burden TOTAL SAMPLE 1.875 0.212 0.000 11.554 3.939 2005:1-2008:3 1.476 0.174 0.000 11.551 3.528 2008:4-2013:9 2.003 0.240 0.000 11.556 4.042 2013:10-2016:6 2.052 0.203 0.000 11.554 4.123 ROA TOTAL SAMPLE 0.088 0.050 -0.082 0.290 0.671 2005:1-2008:3 0.100 0.057 -0.030 0.279 0.612 2008:4-2013:9 0.090 0.050 -0.102 0.303 0.712 2013:10-2016:6 0.071 0.042 -0.093 0.272 0.633 Productivity(b) TOTAL SAMPLE -1.065 -1.081 -1.837 -0.226 0.755 2005:1-2008:3 -1.081 -1.104 -1.872 -0.214 0.783 2008:4-2013:9 -1.095 -1.105 -1.838 -0.303 0.740 2013:10-2016:6 -0.976 -0.983 -1.792 -0.113 0.751
No. of previous bank relationships
TOTAL SAMPLE 2.404 2.000 0.000 6.000 2.594 2005:1-2008:3 2.596 2.000 0.000 6.000 2.773 2008:4-2013:9 2.402 2.000 0.000 6.000 2.566 2013:10-2016:6 2.173 1.000 0.000 5.000 2.411 Size(c) TOTAL SAMPLE 6.389 6.431 4.313 8.382 1.651 2005:1-2008:3 6.228 6.291 4.110 8.266 1.707 2008:4-2013:9 6.440 6.487 4.377 8.404 1.632 2013:10-2016:6 6.460 6.467 4.401 8.464 1.613 Age(d) TOTAL SAMPLE 2.266 2.398 1.099 3.219 0.876 2005:1-2008:3 1.946 2.079 0.693 2.996 0.932 2008:4-2013:9 2.302 2.485 1.099 3.219 0.854 2013:10-2016:6 2.571 2.708 1.609 3.332 0.716 Tangible assets TOTAL SAMPLE 0.308 0.228 0.007 0.757 0.284 2005:1-2008:3 0.291 0.204 0.003 0.741 0.283 2008:4-2013:9 0.317 0.241 0.009 0.765 0.286 2013:10-2016:6 0.306 0.225 0.008 0.754 0.281
(a)Number of observations for the whole period: 951,635; for period 2004Q1-2008Q1: 240,649; for period 2008Q2-2013Q3: 498,094; for period 2013Q4-2016Q2: 212.892.
(c) Size variable is the logarithm of total assets in thousands euro. (d) Age variable is the logarithm of the age in years plus one.
(b) Productivity in logarithms. The total number of observations for this partiuclar variable is 789,871 for the whole period; for period 2004Q1-2008Q1: 195,872; for period 2008Q2-2013Q3: 419,599; for period 2013Q4-2016Q2: 174,400
TABLE 3. PROBABILITY OF OBTAINING CREDIT WITH ANY BANK: ESTIMATED COEFFICIENTS (a) PREVIOUS DOUBTFUL LOANS ‐0.025 ** ‐0.024 ** ‐0.021 * ‐0.021 * ‐0.021 * ‐0.021 * (0.011) (0.011) (0.011) (0.011) (0.011) (0.011) INDEBTEDNESS ‐0.024 *** ‐0.024 *** ‐0.038 *** ‐0.040 *** ‐0.037 *** ‐0.035 *** (0.005) (0.005) (0.004) (0.004) (0.004) (0.004) FINANCIAL BURDEN 0.000 0.000 0.000 0.000 (0.000) (0.000) (0.000) (0.000) ROA ‐0.005 * ‐0.005 ‐0.005 *** (0.002) (0.002) (0.002) PRODUCTIVITY 0.006 *** 0.006 *** (0.002) (0.002) NUMBER OF PREVIOUS BANK RELATIONSHIPS 0.007 *** 0.007 *** 0.006 *** 0.006 *** 0.006 *** 0.006 *** (0.001) (0.001) (0.001) (0.001) (0.001) (0.001) SIZE ‐0.003 ‐0.001 0.000 0.001 0.000 0.000 (0.002) (0.002) (0.002) (0.002) (0.002) (0.002) AGE 0.010 *** 0.009 ** 0.001 0.001 0.001 0.001 (0.004) (0.004) (0.003) (0.003) (0.003) (0.003) TANGIBLE ASSETS ‐0.017 ** ‐0.018 *** ‐0.013 ** ‐0.015 ** ‐0.012 ** (0.007) (0.007) (0.006) (0.006) (0.006) MARGINAL IMPACT FOR 2008:4‐2013:9 PREVIOUS DOUBTFUL LOANS*P2 0.022 * 0.020 * 0.024 ** 0.021 * 0.024 ** 0.024 ** (0.012) (0.012) (0.012) (0.012) (0.012) (0.012) INDEBTEDNESS*P2 ‐0.034 *** ‐0.038 *** ‐0.033 *** ‐0.037 *** ‐0.033 *** ‐0.042 *** (0.006) (0.006) (0.005) (0.005) (0.005) (0.005) FINANCIAL BURDEN*P2 ‐0.002 *** ‐0.002 *** ‐0.002 *** ‐0.002 *** (0.001) (0.000) (0.000) (0.000) ROA*P2 0.004 0.004 * 0.005 ** (0.003) (0.002) (0.002) PRODUCTIVITY*P2 ‐0.003 0.002 (0.002) (0.002) Nº OF PREVIOUS BANK RELATIONSHIPS*P2 0.007 *** 0.007 *** 0.008 *** 0.008 *** 0.008 *** 0.008 *** (0.001) (0.001) (0.001) (0.001) (0.001) (0.000) SIZE*P2 0.011 *** 0.011 *** 0.009 *** 0.010 *** 0.009 *** 0.009 *** (0.001) (0.001) (0.001) (0.001) (0.001) (0.001) AGE*P2 0.010 *** 0.010 *** 0.015 *** 0.015 *** 0.015 *** 0.015 *** (0.002) (0.002) (0.002) (0.002) (0.002) (0.002) TANGIBLE ASSETS*P2 ‐0.027 *** ‐0.027 *** ‐0.029 *** ‐0.027 *** ‐0.030 *** (0.006) (0.006) (0.005) (0.005) (0.005) MARGINAL IMPACT FOR 2013:10‐2016:6 PREVIOUS DOUBTFUL LOANS*P3 ‐0.022 * ‐0.024 * ‐0.021 * ‐0.024 * ‐0.021 * ‐0.021 * (0.013) (0.013) (0.012) (0.013) (0.012) (0.012) INDEBTEDNESS*P3 ‐0.047 * ‐0.052 *** ‐0.053 *** ‐0.057 *** ‐0.054 *** ‐0.067 *** (0.008) (0.008) (0.007) (0.007) (0.007) (0.007) FINANCIAL BURDEN*P3 ‐0.003 *** ‐0.003 *** ‐0.003 *** ‐0.003 *** (0.001) (0.001) (0.001) (0.001) ROA*P3 0.006 *** 0.006 ** 0.009 *** (0.003) (0.003) (0.003) PRODUCTIVITY*P3 ‐0.012 *** ‐0.005 ** (0.003) (0.003) Nº OF PREVIOUS BANK RELATIONSHIPS*P3 0.006 *** 0.006 *** 0.008 *** 0.009 *** 0.008 *** 0.009 *** (0.001) (0.001) (0.001) (0.001) (0.001) (0.001) SIZE*P3 0.011 *** 0.011 *** 0.006 *** 0.007 *** 0.007 *** 0.006 *** (0.002) (0.002) (0.001) (0.001) (0.001) (0.001) AGE*P3 ‐0.011 *** ‐0.013 *** ‐0.007 * ‐0.008 ** ‐0.008 ** ‐0.008 ** (0.004) (0.004) (0.004) (0.004) (0.004) (0.004) TANGIBLE ASSETS*P3 ‐0.025 *** ‐0.024 *** ‐0.038 *** ‐0.035 *** ‐0.039 *** (0.008) (0.008) (0.007) (0.007) (0.007) Adjusted R2 0.384 0.384 0.395 0.394 0.395 0.394 Number of observations 789,871 789,871 951,635 951,635 951,635 951,635 (a) All results derived from linear probability models estimated using least squares, including firm and month fixed effects and clustering at the firm level. In parenthesis, the standard deviation of the coefficients is reported. ***, ** and * indicate 1%, 5% and 10% statistical significance of the coefficients, respectively.
TABLE 4. PROBABILITY OF OBTAINING CREDIT WITH ANY BANK: TOTAL IMPACT (a) TOTAL IMPACT FOR 2005:1‐2008:3 PREVIOUS DOUBTFUL LOANS ‐0.025 ** ‐0.024 ** ‐0.021 * ‐0.021 * ‐0.021 * ‐0.021 * (0.011) (0.011) (0.011) (0.011) (0.011) (0.011) INDEBTEDNESS ‐0.024 *** ‐0.024 *** ‐0.038 *** ‐0.040 *** ‐0.037 *** ‐0.035 *** (0.005) (0.005) (0.004) (0.004) (0.004) (0.004) FINANCIAL BURDEN 0.000 0.000 0.000 0.000 (0.000) (0.000) (0.000) (0.000) ROA ‐0.005 * ‐0.005 ‐0.005 *** (0.002) (0.002) (0.002) PRODUCTIVITY 0.006 *** 0.006 *** (0.002) (0.002) NUMBER OF PREVIOUS BANK RELATIONSHIPS 0.007 *** 0.007 *** 0.006 *** 0.006 *** 0.006 *** 0.006 *** (0.001) (0.001) (0.001) (0.001) (0.001) (0.001) SIZE ‐0.003 ‐0.001 0.000 0.001 0.000 0.000 (0.002) (0.002) (0.002) (0.002) (0.002) (0.002) AGE 0.010 *** 0.009 ** 0.001 0.001 0.001 0.001 (0.004) (0.004) (0.003) (0.003) (0.003) (0.003) TANGIBLE ASSETS ‐0.017 ** ‐0.018 *** ‐0.013 ** ‐0.015 ** ‐0.012 ** (0.007) (0.007) (0.006) (0.006) (0.006) TOTAL IMPACT FOR 2008:4‐2013:9 PREVIOUS DOUBTFUL LOANS ‐0.003 ‐0.004 0.003 0.001 0.003 0.003 (0,005) (0,005) (0,005) (0,005) (0,005) (0,005) INDEBTEDNESS ‐0.058 *** ‐0.062 *** ‐0.071 *** ‐0.077 *** ‐0.071 *** ‐0.078 *** (0,005) (0,005) (0,004) (0,004) (0,004) (0,004) FINANCIAL BURDEN ‐0.002 *** ‐0.002 *** ‐0.002 *** ‐0.002 *** (0,000) (0,000) (0,000) (0,000) ROA ‐0.001 ‐0.001 0.000 (0,001) (0,001) (0,001) PRODUCTIVITY 0.003 0.007 *** (0,002) (0,002) NUMBER OF PREVIOUS BANK RELATIONSHIPS 0.013 *** 0.014 *** 0.014 *** 0.014 *** 0.014 *** 0.014 *** (0,000) (0,000) (0,000) (0,000) (0,000) (0,000) SIZE 0.008 *** 0.010 *** 0.009 *** 0.011 *** 0.009 *** 0.009 *** (0,002) (0,002) (0,001) (0,001) (0,001) (0,001) AGE 0.020 *** 0.019 *** 0.016 *** 0.016 *** 0.016 *** 0.016 *** (0,005) (0,005) (0,004) (0,004) (0,004) (0,004) TANGIBLE ASSETS ‐0.044 *** ‐0.045 *** ‐0.042 *** ‐0.043 *** ‐0.042 *** (0,006) (0,006) (0,005) (0,005) (0,005) TOTAL IMPACT FOR 2013:10‐2016:6 PREVIOUS DOUBTFUL LOANS ‐0.046 *** ‐0.048 *** ‐0.042 *** ‐0.045 *** ‐0.042 *** ‐0.042 *** (0,006) (0,006) (0,006) (0,006) (0,006) (0,006) INDEBTEDNESS ‐0.071 *** ‐0.076 *** ‐0.091 *** ‐0.097 *** ‐0.091 *** ‐0.102 *** (0,007) (0,007) (0,006) (0,006) (0,006) (0,006) FINANCIAL BURDEN ‐0.003 *** ‐0.003 *** ‐0.003 *** ‐0.003 *** (0,000) (0,000) (0,000) (0,000) ROA 0.002 0.002 0.004 (0,002) (0,002) (0,002) PRODUCTIVITY ‐0.006 *** 0.000 (0,002) (0,002) NUMBER OF PREVIOUS BANK RELATIONSHIPS 0.013 *** 0.013 *** 0.014 *** 0.015 *** 0.014 *** 0.015 *** (0,001) (0,001) (0,001) (0,001) (0,001) (0,001) SIZE 0.008 *** 0.010 *** 0.006 *** 0.008 *** 0.006 *** 0.005 *** (0,002) (0,002) (0,002) (0,002) (0,002) (0,002) AGE ‐0.002 ‐0.004 ‐0.006 ‐0.007 ‐0.006 ‐0.007 (0,006) (0,006) (0,006) (0,006) (0,006) (0,006) TANGIBLE ASSETS ‐0.043 *** ‐0.042 *** ‐0.051 *** ‐0.050 *** ‐0.051 *** (0,007) (0,007) (0,006) (0,006) (0,006) Adjusted R2 0.384 0.384 0.395 0.394 0.395 0.394 Number of observations 789,871 789,871 951,635 951,635 951,635 951,635 (a) All results derived from linear probability models estimated using least squares, including firm and month fixed effects and clustering at the firm level. In parenthesis, the standard deviation of the coefficients is reported. ***, ** and * indicate 1%, 5% and 10% statistical significance of the coefficients, respectively.
TABLE 5. PROBABILITY OF OBTAINING CREDIT WITH AT LEAST ONE NEW BANK: ESTIMATED COEFFICIENTS (a) PREVIOUS DOUBTFUL LOANS ‐0.105 *** ‐0.105 *** ‐0.107 *** ‐0.108 *** ‐0.107 *** ‐0.108 *** (0.019) (0.019) (0.017) (0.017) (0.017) (0.017) INDEBTEDNESS ‐0.024 *** ‐0.026 *** ‐0.038 *** ‐0.043 *** ‐0.038 *** ‐0.038 *** (0.006) (0.006) (0.005) (0.005) (0.005) (0.005) FINANCIAL BURDEN ‐0.001 * ‐0.001 ** ‐0.001 ** ‐0.001 ** (0.001) (0.000) (0.000) (0.000) ROA ‐0.003 ‐0.005 ** ‐0.004 ** (0.003) (0.002) (0.002) PRODUCTIVITY 0.007 *** 0.010 *** (0.003) (0.002) NUMBER OF PREVIOUS BANK ‐0.049 *** ‐0.049 *** ‐0.052 *** ‐0.052 *** ‐0.052 *** ‐0.052 *** (0.001) (0.001) (0.001) (0.001) (0.001) (0.001) SIZE ‐0.012 *** ‐0.009 *** ‐0.015 *** ‐0.014 *** ‐0.015 *** ‐0.016 *** (0.002) (0.002) (0.002) (0.002) (0.002) (0.002) AGE ‐0.005 ‐0.006 ‐0.015 *** ‐0.015 *** ‐0.015 *** ‐0.015 *** (0.004) (0.004) (0.003) (0.003) (0.003) (0.003) TANGIBLE ASSETS ‐0.036 *** ‐0.039 *** ‐0.025 *** ‐0.029 *** ‐0.024 *** (0.008) (0.008) (0.007) (0.007) (0.007) MARGINAL IMPACT FOR 2008:4‐2013:9 PREVIOUS DOUBTFUL LOANS*P2 ‐0.001 ‐0.003 ‐0.001 ‐0.006 ‐0.001 ‐0.001 (0.020) (0.020) (0.018) (0.018) (0.018) (0.018) INDEBTEDNESS*P2 ‐0.074 *** ‐0.080 *** ‐0.068 *** ‐0.075 *** ‐0.069 *** ‐0.070 *** (0.007) (0.007) (0.006) (0.006) (0.006) (0.006) FINANCIAL BURDEN*P2 ‐0.003 *** ‐0.003 *** ‐0.004 *** ‐0.004 *** (0.001) (0.001) (0.001) (0.001) ROA*P2 0.001 0.004 0.006 *** (0.003) (0.002) (0.002) PRODUCTIVITY*P2 ‐0.003 0.004 (0.003) (0.003) Nº OF PREVIOUS BANK RELATIONSHIPS*P2 ‐0.006 *** ‐0.006 *** ‐0.005 *** ‐0.004 *** ‐0.005 *** ‐0.005 *** (0.001) (0.001) (0.001) (0.001) (0.001) (0.001) SIZE*P2 0.024 *** 0.023 *** 0.019 *** 0.020 *** 0.019 *** 0.020 *** (0.002) (0.002) (0.001) (0.001) (0.001) (0.001) AGE*P2 0.004 0.003 0.009 *** 0.009 *** 0.009 *** 0.010 *** (0.003) (0.003) (0.003) (0.003) (0.003) (0.003) TANGIBLE ASSETS*P2 0.006 0.008 ‐0.002 0.001 ‐0.003 (0.007) (0.007) (0.006) (0.006) (0.006) MARGINAL IMPACT FOR 2013:10‐2016:6 PREVIOUS DOUBTFUL LOANS*P3 ‐0.025 ‐0.028 ‐0.029 ‐0.033 * ‐0.029 ‐0.028 (0.020) (0.020) (0.018) (0.018) (0.018) (0.018) INDEBTEDNESS*P3 ‐0.052 *** ‐0.058 *** ‐0.061 *** ‐0.067 *** ‐0.062 *** ‐0.080 *** (0.010) (0.009) (0.008) (0.008) (0.008) (0.008) FINANCIAL BURDEN*P3 ‐0.004 *** ‐0.004 *** ‐0.004 *** ‐0.004 *** (0.001) (0.001) (0.001) (0.001) ROA*P3 0.004 0.006 ** 0.010 *** (0.004) (0.003) (0.003) PRODUCTIVITY*P3 ‐0.012 *** ‐0.003 (0.003) (0.003) Nº OF PREVIOUS BANK RELATIONSHIPS*P3 ‐0.005 *** ‐0.004 *** ‐0.001 0.000 ‐0.001 0.000 (0.001) (0.001) (0.001) (0.001) (0.001) (0.001) SIZE*P3 0.026 *** 0.027 *** 0.019 *** 0.021 *** 0.020 *** 0.018 *** (0.002) (0.002) (0.002) (0.002) (0.002) (0.002) AGE*P3 ‐0.023 *** ‐0.025 *** ‐0.019 *** ‐0.019 *** ‐0.019 *** ‐0.019 *** (0.005) (0.005) (0.005) (0.005) (0.005) (0.005) TANGIBLE ASSETS*P3 ‐0.032 *** ‐0.029 *** ‐0.047 *** ‐0.041 *** ‐0.047 *** (0.009) (0.009) (0.008) (0.008) (0.008) Adjusted R2 0.121 0.121 0.137 0.137 0.137 0.137 Number of observations 789,871 789,871 951,635 951,635 951,635 951,635 (a) All results derived from linear probability models estimated using least squares, including firm and month fixed effects and clustering at the firm level. In parenthesis, the standard deviation of the coefficients is reported. ***, ** and * indicate 1%, 5% and 10% statistical significance of the coefficients, respectively.
TABLE 6. PROBABILITY OF OBTAINING CREDIT WITH AT LEAST ONE NEW BANK: TOTAL IMPACT (a) TOTAL IMPACT FOR 2005:1‐2008:3 PREVIOUS DOUBTFUL LOANS ‐0.105 *** ‐0.105 *** ‐0.107 *** ‐0.108 *** ‐0.107 *** ‐0.108 *** (0.019) (0.019) (0.017) (0.017) (0.017) (0.017) INDEBTEDNESS ‐0.024 *** ‐0.026 *** ‐0.038 *** ‐0.043 *** ‐0.038 *** ‐0.038 *** (0.006) (0.006) (0.005) (0.005) (0.005) (0.005) FINANCIAL BURDEN ‐0.001 * ‐0.001 ** ‐0.001 ** ‐0.001 ** (0.001) (0.000) (0.000) (0.000) ROA ‐0.003 ‐0.005 ** ‐0.004 ** (0.003) (0.002) (0.002) PRODUCTIVITY 0.007 *** 0.010 *** (0.003) (0.002) NUMBER OF PREVIOUS BANK RELATIONSHIPS ‐0.049 *** ‐0.049 *** ‐0.052 *** ‐0.052 *** ‐0.052 *** ‐0.052 *** (0.001) (0.001) (0.001) (0.001) (0.001) (0.001) SIZE ‐0.012 *** ‐0.009 *** ‐0.015 *** ‐0.014 *** ‐0.015 *** ‐0.016 *** (0.002) (0.002) (0.002) (0.002) (0.002) (0.002) AGE ‐0.005 ‐0.006 ‐0.015 *** ‐0.015 *** ‐0.015 *** ‐0.015 *** (0.004) (0.004) (0.003) (0.003) (0.003) (0.003) TANGIBLE ASSETS ‐0.036 *** ‐0.039 *** ‐0.025 *** ‐0.029 *** ‐0.024 *** (0.008) (0.008) (0.007) (0.007) (0.007) TOTAL IMPACT FOR 2008:4‐2013:9 PREVIOUS DOUBTFUL LOANS ‐0.106 *** ‐0.109 *** ‐0.109 *** ‐0.114 *** ‐0.109 *** ‐0.109 *** (0,007) (0,007) (0,007) (0,007) (0,007) (0,007) INDEBTEDNESS ‐0.098 *** ‐0.106 *** ‐0.107 *** ‐0.118 *** ‐0.106 *** ‐0.107 *** (0,006) (0,006) (0,005) (0,005) (0,005) (0,005) FINANCIAL BURDEN ‐0.004 *** ‐0.005 *** ‐0.005 *** ‐0.005 *** (0,000) (0,000) (0,000) (0,000) ROA ‐0.001 ‐0.001 0.002 (0,002) (0,001) (0,001) PRODUCTIVITY 0.003 * 0.014 *** (0,002) (0,002) NUMBER OF PREVIOUS BANK RELATIONSHIPS ‐0.056 *** ‐0.055 *** ‐0.056 *** ‐0.056 *** ‐0.056 *** ‐0.057 *** (0,001) (0,001) (0,001) (0,001) (0,001) (0,001) SIZE 0.012 *** 0.014 *** 0.004 *** 0.007 *** 0.004 ** 0.004 ** (0,002) (0,002) (0,002) (0,002) (0,002) (0,002) AGE ‐0.001 ‐0.003 ‐0.005 ‐0.006 ‐0.005 ‐0.005 (0,006) (0,006) (0,005) (0,005) (0,005) (0,004) TANGIBLE ASSETS ‐0.030 *** ‐0.031 *** ‐0.027 *** ‐0.028 *** ‐0.027 *** (0,007) (0,007) (0,006) (0,006) (0,006) TOTAL IMPACT FOR 2013:10‐2016:6 PREVIOUS DOUBTFUL LOANS ‐0.130 *** ‐0.133 *** ‐0.136 *** ‐0.140 *** ‐0.136 *** ‐0.136 *** (0,009) (0,009) (0,008) (0,008) (0,008) (0,008) INDEBTEDNESS ‐0.076 *** ‐0.084 *** ‐0.100 *** ‐0.110 *** ‐0.100 *** ‐0.118 *** (0,008) (0,008) (0,007) (0,007) (0,007) (0,006) FINANCIAL BURDEN ‐0.005 *** ‐0.005 *** ‐0.005 *** ‐0.005 *** (0,000) (0,000) (0,000) (0,000) ROA 0.001 0.002 0.006 *** (0,003) (0,002) (0,002) PRODUCTIVITY ‐0.005 ** 0.007 *** (0,003) (0,002) NUMBER OF PREVIOUS BANK RELATIONSHIPS ‐0.054 *** ‐0.054 *** ‐0.053 *** ‐0.052 *** ‐0.053 *** ‐0.052 *** (0,001) (0,001) (0,001) (0,001) (0,001) (0,001) SIZE 0.014 *** 0.017 *** 0.004 ** 0.007 *** 0.004 ** 0.003 (0,003) (0,003) (0,002) (0,002) (0,002) (0,002) AGE ‐0.028 *** ‐0.031 *** ‐0.033 *** ‐0.034 *** ‐0.034 *** ‐0.034 *** (0,008) (0,008) (0,007) (0,007) (0,007) (0,007) TANGIBLE ASSETS ‐0.068 *** ‐0.068 *** ‐0.072 *** ‐0.071 *** ‐0.072 *** (0,009) (0,009) (0,007) (0,007) (0,007) Adjusted R2 0.121 0.121 0.137 0.137 0.137 0.137 Number of observations 789,871 789,871 951,635 951,635 951,635 951,635 (a) All results derived from linear probability models estimated using least squares, including firm and month fixed effects and clustering at the firm level. In parenthesis, the standard deviation of the coefficients is reported. ***, ** and * indicate 1%, 5% and 10% statistical significance of the coefficients, respectively.