D
iscussion
P
aPers
COMMUNITY AFFAIRS DEPARTMENT
F
ederal
r
eserve
B
ank
oF
P
hiladelPhia
SUBPRIME LENDING OVER TIME:
THE ROLE OF RACE
Marvin M. Smith
Federal Reserve Bank of Philadelphia
and
Christy Chung Hevener
Formerly, Federal Reserve Bank of Philadelphia
October 2010
SUBPRIME LENDING OVER TIME:
THE ROLE OF RACE
Marvin M. Smith
Federal Reserve Bank of Philadelphia
and
Christy Chung Hevener
Formerly, Federal Reserve Bank of Philadelphia
October 2010
We thank Loretta Mester, Rick Lang, Robert Hunt, Mitchell Berlin, Chris Henderson, and Dede Myers for their valuable comments, John Wackes for his assistance with the maps, and the research assistance of Brian Tyson.
The views expressed here are those of the authors and do not necessarily represent the views of the Federal Reserve Bank of Philadel-phia or the Federal Reserve System.
TABLE OF CONTENTS
Introduction ...5
Background ...5
Previous Studies ...6
Methodology and Data ...8
Data ...8
Results ...9
Analysis Results ...9
Spatial Location of Subprime Loans ...9
Racial Disparities ...14 Income Differences ...15 Estimation Technique ...17 Decomposition ...19 Concluding Remarks ...22 References ...23 Appendix Tables ...25
SUBPRIME LENDING OVER TIME:
THE ROLE OF RACE
INTRODUCTION
Ideally, a prospective borrower seeking a mortgage loan would prefer to receive a prime loan. But such loans are generally available only to those with a high credit rating (i.e., those deemed highly creditworthy) and with sufficient funds to qualify for the loan. Those who have flawed credit (a history of late payments and/or a high debt-to-income ratio), not enough for a down payment, or no reserve funds usually obtain subprime loans. The terms of these loans are less favorable than those offered under prime loans. The difference between the two types of loans reflects the lender’s risk assessment in making the loan. However, in the wake of efforts to increase access to mortgage capital for all potential borrowers, questions continue to be raised about the influ-ence of race in determining whether a borrower receives a prime or subprime loan.
In light of the increased scrutiny of the subprime market nationally and the concerns raised by com-munity leaders in the Federal Reserve’s Third District (which includes the eastern portion of Pennsylvania, southern New Jersey, and Delaware) that low- and moderate-income and minority homeowners are targeted to receive high-cost loans,1 this study will examine the extent to which subprime lending occurs in Pennsylvania,
New Jersey, and Delaware and its change over time, as well as the role that race plays in obtaining subprime versus prime loans.
BACKGROUND
During the 1990s, there was a surge in lending in the mortgage industry. While loans by both subprime and prime lenders increased, loans by subprime lenders grew at a significantly faster pace. Between 1994 and 2003, prime lenders’ originations grew by an annual rate of roughly 18 percent, but subprime lenders’ loans increased by approximately 25 percent per year.2 In 1994, the share of loans by subprime lenders was only 4.5
percent of all mortgage loans. The share of subprime loans rose to 14.5 percent in 1997 and then declined (Fig-ure 1). In 2003, subprime loan originations comprised about 9 percent of total loan originations. This amounted to nearly a ten-fold growth in the total value of subprime loan originations, from $35 billion to $332 billion.3
The share of subprime loans then reached its highest level in 2005, when it was 21 percent of all loans. By 2007, subprime loans had declined to roughly 8 percent of total loan originations.
1 These concerns were raised at outreach meetings conducted by the staff of the Reserve Bank’s Community Affairs Department. During
outreach meetings, the Reserve Bank’s staff members meet with representatives of financial institutions, government agencies, nonprofit organizations, and consumer advocates to determine mutual areas of interest and activity as well as to discuss any finance-related issues that concern them. The targeting of certain segments of the population for subprime loans is thought to occur, in part, because unscrupulous mortgage brokers work closely with some subprime lenders. While not specifically mentioned during the outreach meetings, some cor-respondent banks, it is worth noting, have also made questionable high-cost loans.
2 See the article by Governor Edward M. Gramlich. 3 See Gramlich (2004).
The growth in mort-gage loans was accompanied by the offering of mortgage products with features such as an adjustable rate, interest-only payments, loans requiring no down payment, and those requiring little or no docu-mentation of income or debt burden that helped prospec-tive homebuyers with poor or limited credit histories to qual-ify for a home loan.4 The rise
in prime and subprime loans helped fuel the increase in the national homeownership rate over the 1994 to 2003 period,
from 64 percent to 68.3 percent. 5,6 In addition to new homebuyers, homeowners have also used subprime loans
to refinance their mortgages. Moreover, lenders were emboldened to seek out potential borrowers for subprime loans to satisfy investors’ demand for such loans to be securitized. While subprime lending has enabled some borrowers to move beyond their credit-blemished past into homes or provide current homeowners with extra funds through refinancing, there has been a downside. Unfortunately, subprime loans have been at the center of the discussion on foreclosures. High-cost lending has placed some borrowers who may not have been ready for homeownership or a refinance loan in an untenable financial position while stripping other homeowners of their equity7 — their primary asset for wealth accumulation — when refinancing their loan. A special point
of contention in this debate has been over minorities receiving a disproportionate share of subprime loans. Of concern is the extent to which the disparity in subprime lending is due to minority status.
Previous Studies
In complying with the Home Mortgage Disclosure Act (HMDA)8 of 1975, most mortgage lending
in-stitutions began collecting loan-level data — which they report to the Federal Financial Inin-stitutions Examina-tion Council — that could be used to enhance the enforcement of laws prohibiting discriminaExamina-tion in lending. Since then, these unique data have shown that lending disparities exist along racial and income lines. In 2005, for example, an examination of HMDA data by Avery et al. revealed that African-Americans were more likely
FIGURE 1. Subprime Mortgage Originations
as a Percent of Total Originations
4 As Chris Henderson so aptly points out, these nontraditional loans are legal and intended for savvy borrowers. Potential problems arise
when these complex products are obtained by unsophisticated borrowers. See Henderson (2007).
5 See Gramlich (2004).
6 In 2007, the homeownership rate declined slightly to 68.1 percent. See
http://en.wikipedia.org/wiki/Homeownership_in_the_Unit-ed_States.
7 For a discussion of legislation signed by Wisconsin Governor Jim Doyle to address this issue, see “Doyle to Sign Legislation Against
Predatory Lenders.”
to receive higher-priced loans than borrowers of other race categories. According to the data, the (unmodi-fied or “gross”) incidence of higher-priced lending for conventional home-purchase loans was 54.7 percent for African-Americans, 46.1 percent for Hispanic whites, 17.2 percent for non-Hispanic whites, and 16.6 percent for Asians.9
HMDA data have been used in a number of studies to investigate many aspects of lending, including the subprime/prime dynamic. But given that the data do not include all the credit and risk variables considered by lenders when making credit decisions, many studies have attempted to augment the HMDA data set with credit variables in order to better explain the lending disparity among racial or income groups. Failure to account for variances in creditworthiness or doing so at an aggregated level runs the risk of erroneously attributing any differential treatment in lending to race.
An earlier study by Immergluck and Wiles explored the relationship between neighborhood variables and the proportion of refinance loans originated by subprime lenders.10 They used 1998 HMDA data, the U.S.
Department of Housing and Urban Development (HUD) list of subprime lenders, and selected census data, but they did not include credit risk variables. The authors found that neighborhoods that were predominantly African-American experienced higher rates of subprime lending. Among the other variables that were found to influence subprime lending were educational attainment, median home value, and neighborhoods that were mixed-minority. 11,12
Bocian, Ernst, and Li (2006) also used an augmented HMDA data set (including credit scores) to model a logistical regression on the likelihood of receiving a higher-rate loan in 2004. They concluded that race and ethnicity continue to be a factor in subprime loan pricing, with African-Americans and Hispanics more likely to receive higher-priced home-purchase and refinance subprime loans than similarly situated white borrow-ers — particularly for loans with prepayment penalties.13 However, this study is limited in that it surveyed only
subprime loans.
An analysis by Calem, Gillen, and Wachter used 1999 HMDA data, the HUD subprime list, 2000 census data, credit information on the tract level, and foreclosure data to estimate the frequency of subprime loans by neighborhood given the demographic composition of the neighborhood.14 They conducted their
inves-tigation on the tract level by focusing on the percentage of tract loans that were subprime and the loan level by considering whether the loan received was subprime. They found that credit risk (i.e., the proportion of individuals with low credit scores or without credit records) was associated with the share of subprime loans in a census tract, but that African-Americans were still positively correlated with a neighborhood’s subprime share in both Chicago and Philadelphia. Moreover, African-Americans were highly likely to obtain a subprime loan, regardless of where they lived.15
9 See Avery, Brevoort, and Canner (2006), p. A160. 10 See Immergluck and Wiles (1999), p. 25. 11 See Immergluck and Wiles (1999), p. 26.
12 For a related line of inquiry that focuses on the role that neighborhood characteristics play in the loan-decision process via information
externalities, see Lang and Nakamura (1993) and Blackburn and Vermilyea (2007).
13 See Bocian, Ernst, and Li (2006), p. 3.
14 See Calem, Gillen, and Wachter (2004), p. 396. 15 See Calem, Gillen, and Wachter (2004), p. 401.
Although the findings by Calem, Gillen, and Wachter are quite enlightening, their controls for credit risk were based on tract level and not individual borrowers. However, the present study uses a unique data set
(a merging of HMDA data and data from a national proprietary data set on loan performance with millions of loan-level records of originations) to examine subprime lending over time in Pennsylvania, New Jersey, and Delaware and the influence of race in the mortgage-lending process. This data set not only allows us to study subprime lending over time but also contains loan-level information on variables that allow for better controls over factors correlated with race so that better inferences can be drawn.
Moreover, while earlier studies have shown a racial disparity in lending with respect to prime and sub-prime loans, the present study improves upon previous efforts by using an estimating procedure that allows the differences in the probability of receiving a subprime loan over a prime loan to be separated into that portion arising from differences in identifiable characteristics and the remaining portion, which may be attributable in part to bias in mortgage lending. In the former portion, not only are the explanatory characteristics identified but their separate contributions are quantified. Thus, this study will fine-tune the influence of race in the al-location of mortgage capital between the prime and subprime markets.
METHODOLOGY AND DATA
The examination of subprime lending over time in Pennsylvania, New Jersey, and Delaware and the role played by race is carried out in three stages. First, we consider an overview of mortgage lending in the three states for 1999 through 2007. We pay attention to the breakdown of prime and subprime loans by race and income for conventional home purchase, refinance, and home improvement. Of special interest are the overall subprime rates for each year by race (American and white) and the subsequent gap between African-Americans and whites. We also take note of the change in the gap from 1999 to 2007.
To establish the existence of a racial disparity in subprime lending and further investigate the underlying influences of the racial disparity in the subprime lending gap, two types of regression analysis are employed.
Data
The analysis in the study is based on a data set constructed by merging data from several sources. The data set is composed of information extracted from the merging of HMDA data and data from a national pro-prietary data set on loan performance for 1999 through 2007. The data from the national propro-prietary data set contain loan-level information from most of the top 10 residential mortgage servicers in the industry.16 Our
data set also contains selected variables obtained from U.S. census data. Added to these data is a list of lenders compiled by the U.S. Department of Housing and Urban Development (HUD) to indicate whether loans were prime or subprime in 1999 through 2003. HUD employed a methodology that characterized a lender as prime or subprime by determining, through research in trade publications, websites, or telephone interviews, the type of loans originated by a lender. Many lenders readily identified themselves as subprime lenders, while others indicated the proportion of subprime loans they originated. If a lender predominantly originated prime loans (i.e., more than 50 percent), the lender was considered a prime lender. If, however, the lender predominantly originated subprime loans, the lender was classified as a subprime lender. For the purposes of our database, all loans originated by a HUD-designated subprime lender were considered subprime, while all loans originated by a lender not designated by HUD as subprime were considered prime.
The HUD list was discontinued in 2005. However, in 2004, HMDA began requiring lenders to disclose the pricing (interest rates and fees) for loans. This information is used to classify loans as “higher-priced” if the mortgage has an annual percentage rate (APR) 3 percentage points over the designated benchmark (Treasury securities).17 The higher-priced loans are a proxy for subprime. In our analysis, we use the HMDA higher-priced
designation for subprime loans in 2004 through 2007.18
The particular variables used in the analysis include socio-economic variables such as race (African-American, white), gender, and borrower’s income.19 We used several variables to capture neighborhood
influ-ences. These measures include the percent of owner-occupied units, tract income (low, moderate, middle, and upper), and whether the tract is a minority tract (over 50 percent minority). We also included information on the borrower’s loan amount and type of loan (conventional home purchase, refinance, or home improvement). In addition, to depict credit and other risk factors, we used some variables that underwriters typically rely on. These variables consist of loan amount, debt-to-income ratio (DTI), credit score,20 and documentation type
(full documentation and not full documentation).21 Following Calem, Gillen, and Wachter, we include the
turnover rate of tract housing stock.22 According to Calem et al., “Neighborhoods with little turnover will tend
to have more uncertain housing values and, hence, represent greater credit risk.”23 We also used HMDA data
to compute a denial rate for non-subprime conventional loans. Calem et al. suggest that this measure can be viewed as a proxy for the availability of such loans as well as a possible proxy for omitted risk variables. 24
RESULTS
Analysis Results
First, we focus on the subprime lending patterns by race in Pennsylvania, New Jersey, and Delaware from 1999 to 2007. Next, we consider the disparities in subprime loans by race and then by income. Then we present the results of the logistic regression analysis of the racial disparities in subprime lending. Finally, we esti-mate the percent of the racial gap explained by differences in the observable characteristics between the races.
Spatial Location of Subprime Loans. The subprime loans of African-Americans and whites were geo-coded to the census tract level in each of the three states for 1999 to 2007. Of interest is not only the spatial location of the loans but also the change in lending patterns over time. In order to highlight these two aspects, only the maps for 1999 and 2005 for each race in the three states will be shown. (The remaining maps are avail-able from the authors upon request.)
17 See Avery, Canner, and Cook (2005), pp. 344–94.
18 Even though the HUD list and the HMDA higher-priced designations for subprime lenders affect the estimates of loan originations,
their use in the regressions estimated in this study where they overlap did not appreciably affect the results. For a similar result, see Mayer and Pence (2009).
19 A list of the variables can be found in appendix Table A-1, p. 25. 20 This is a FICO score.
21 We were unable to use the loan-to-value ratio variable, since it does not include second liens on the property.
22 This variable is equal to the number of home-purchase loans from HMDA divided by the number of owner-occupied housing units from
the census.
23 See Calem et al. (2004), p. 398. 24 See Calem et al. (2004), p. 398.
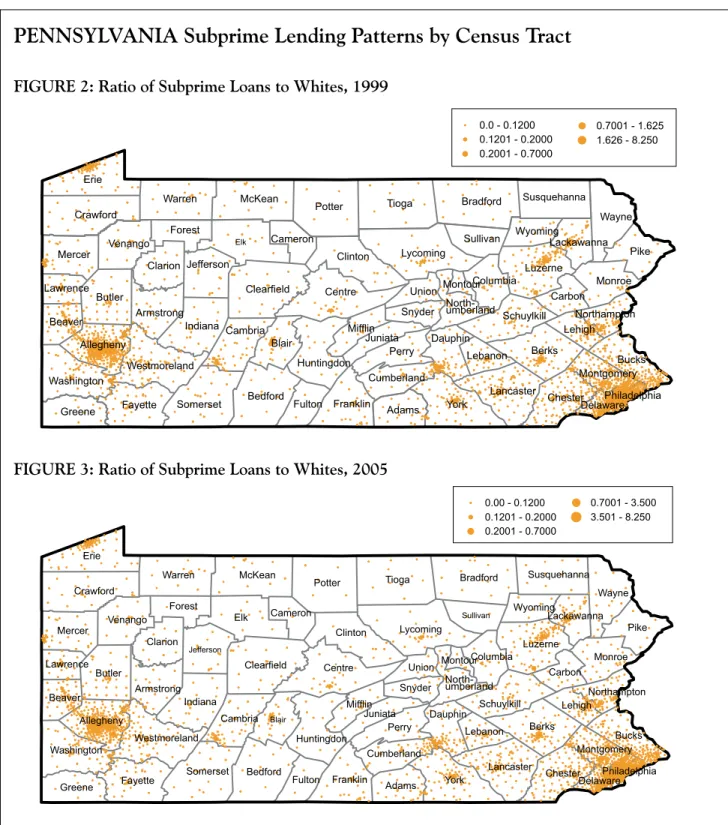
In Pennsylvania, the main clusters of subprime loans for whites in 1999 are located in Philadelphia, Allentown/Easton/Bethlehem, Scranton/Wilkes-Barre, Reading, Harrisburg, York, Pittsburgh, and Erie (Figure 2). In 2005, subprime loans increased in some of these locations and spread to nearby areas (Figure 3). Figure 4 reveals a similar location of subprime-loan clusters for African-Americans in 1999. While subprime loans also increased for African-Americans in 2005, the increases are most notable in Mount Pocono, East Stroudsburg, Allentown/Easton/Bethlehem, and York (Figure 5).
Data Source: HMDA and a Large Mortgage Servicer Database. Prepared by the Federal Reserve Bank of Philadelphia, Community Affairs Department.
PENNSYLVANIA Subprime Lending Patterns by Census Tract
FIGURE 2: Ratio of Subprime Loans to Whites, 1999
FIGURE 3: Ratio of Subprime Loans to Whites, 2005
Elk Erie Tioga York Potter Centre Berks Bradford Butler Pike Lycoming Clinton Bedford Warren Clearfield McKean Blair Indiana Crawford Luzerne Somerset Wayne Fayette Perry Bucks Mercer Lancaster Chester Franklin Clarion Schuylkill Monroe Cambria Venango Greene Huntingdon Adams Allegheny Washington Jefferson Westmoreland Mifflin Forest Fulton Armstrong Dauphin Beaver Susquehanna Sullivan Union Carbon Columbia Lehigh Snyder Cumberland Cameron Wyoming Lebanon Lawrence Juniata Montgomery Lackawanna Northampton North-umberland Delaware Montour Philadelphia 0.0 - 0.1200 0.1201 - 0.2000 0.2001 - 0.7000 0.7001 - 1.625 1.626 - 8.250 Elk Erie Tioga York Potter Centre Berks Bradford Butler Pike Lycoming Clinton Bedford Warren Clearfield McKean Blair Indiana Crawford Luzerne Somerset Wayne Fayette Perry Bucks Mercer Lancaster Chester Franklin Clarion Schuylkill Monroe Cambria Venango Greene Huntingdon Adams Allegheny Washington Jefferson Westmoreland Mifflin Forest Fulton Armstrong Dauphin Beaver Susquehanna Sullivan Union Carbon Columbia Lehigh Snyder Cumberland Cameron Wyoming Lebanon Lawrence Juniata Montgomery Lackawanna Northampton Delaware Montour Philadelphia 0.00 - 0.1200 0.1201 - 0.2000 0.2001 - 0.7000 0.7001 - 3.500 3.501 - 8.250 North-umberland
The spatial location of subprime loans for whites in New Jersey in 1999 tended to cluster in the north-eastern part of the state in Paterson, Jersey City, Newark, and Elizabeth. Other clusters occurred in the areas of Asbury Park, Trenton, and Camden (Figure 6). Figure 7 shows that subprime loans for whites increased some-what in the same general areas in 2005. The clusters of subprime loans for African-Americans in 1999 were located in the same areas as those for whites (Figure 8). However, Figure 9 reveals that in 2005, subprime loans for African-Americans increased in the same areas in which clusters occurred in 1999, but there were additional
PENNSYLVANIA Subprime Lending Patterns by Census Tract
Data Source: HMDA and a Large Mortgage Servicer Database. Prepared by the Federal Reserve Bank of Philadelphia, Community Affairs Department.
FIGURE 4: Ratio of Subprime Loans to African-Americans, 1999
FIGURE 5: Ratio of Subprime Loans to African-Americans, 2005
0.0 - 0.1200 0.1201 - 0.2000 0.2001 - 0.7000 0.7001 - 3.500 3.501 - 8.250 Erie Berks Pike Luzerne Wayne Bucks Chester Monroe Susquehanna Carbon Lehigh Montgomery Lackawanna Northampton Delaware York Potter Bradford Lycoming Blair Perry Lancaster Franklin Schuylkill Adams Allegheny Dauphin Sullivan Union Columbia Snyder Cumberland Wyoming Lebanon Elk Tioga Centre Butler Clinton Bedford Warren Clearfield McKean Indiana Crawford Somerset Fayette Mercer Clarion Cambria Venango Greene Huntingdon Washington Jefferson Westmoreland Mifflin Forest Fulton Armstrong Beaver Cameron Lawrence Juniata Northumberland Montour Philadelphia Huntingdon Columbia Northumberland Montour Crawford Allegheny Elk Tioga York Potter Centre Berks Bradford Pike Lycoming Clinton Bedford Warren Clearfield McKean Blair Indiana Luzerne Somerset Wayne Perry Bucks Lancaster Chester Franklin Schuylkill Monroe Cambria Adams Jefferson Mifflin Forest Fulton Dauphin Susquehanna Sullivan Union Carbon Lehigh Snyder Cumberland Cameron Wyoming Lebanon Juniata Montgomery Lackawanna Northampton DelawarePhiladelphia Erie Butler Fayette Mercer Clarion Venango Greene Washington Westmoreland Armstrong Beaver Lawrence 0.0 - 0.1200 0.1201 - 0.2000 0.2001 - 0.7000 0.7001 - 3.500 3.501 - 8.250
NEW JERSEY Subprime Lending Patterns by Census Tract
Data Source: HMDA and a Large Mortgage Servicer Database. Prepared by the Federal Reserve Bank of Philadelphia, Community Affairs Department.
FIGURE 6:
Ratio of Subprime Loans to Whites, 1999
FIGURE 7:
Ratio of Subprime Loans to Whites, 2005
FIGURE 8:
Ratio of Subprime Loans to African-Americans, 1999
FIGURE 9:
Ratio of Subprime Loans to African-Americans, 2005
Ocean Burlington Morris Sussex Atlantic Salem Warren Monmouth Cumberland Hunterdon Bergen Mercer Somerset Middlesex Gloucester Camden Passaic Cape May Essex Union Hudson 0.0 - 0.1200 0.1201 - 0.2000 0.2001 - 0.7000 0.7001 - 3.500 3.501 - 8.250 0.0 - 0.1200 0.1201 - 0.2000 0.2001 - 0.7000 0.7001 - 1.688 1.689 - 8.250 Ocean Burlington Morris Sussex Atlantic Salem Warren Monmouth Cumberland Hunterdon Bergen Mercer Somerset Middlesex Gloucester Camden Passaic Cape May Essex Union Hudson Ocean Burlington Morris Sussex Atlantic Salem Warren Monmouth Cumberland Hunterdon Bergen Mercer Somerset Middlesex Gloucester Camden Passaic Cape May Essex Union Hudson 0.0 - 0.1200 0.1201 - 0.2000 0.2001 - 0.7000 0.7001 - 3.500 3.501 - 8.250 0.0 - 0.1200 0.1201 - 0.2000 0.2001 - 0.7000 0.7001 - 3.000 3.001 - 8.250 Ocean Burlington Morris Sussex Atlantic Salem Warren Monmouth Cumberland Hunterdon Bergen Mercer Somerset Middlesex Gloucester Camden Passaic Cape May Essex Union Hudson
clusters in such locations as Willingboro, Millville, and Atlantic City.
The location of subprime loans for whites in Delaware in 1999 occurred in the northern part of the state (Wilmington area), the center of the state (Dover area), and the southernmost part of the state (Figure 10). While subprime loans increased in all three states in 2005, the change in the location pattern was most dramatic in Dela-ware. As Figure 11 shows, subprime loans for whites occurred throughout the state. Figures 12 and 13 illustrate that the pattern of subprime loans for African-Americans in Delaware in 1999 and 2005 mirrors that of whites.
DELAWARE Subprime Lending Patterns by Census Tract
FIGURE 10:
Ratio of Subprime Loans to Whites, 1999
FIGURE 11:
Ratio of Subprime Loans to Whites, 2005
Data Source: HMDA and a Large Mortgage Servicer Database. Prepared by the Federal Reserve Bank of Philadelphia, Community Affairs Department.
FIGURE 12:
Ratio of Subprime Loans to African-Americans, 1999
FIGURE 13:
Ratio of Subprime Loans to African-Americans, 2005 Sussex Kent New Castle 0.0 - 0.1200 0.1201 - 0.2000 0.2001 - 0.7000 0.7001 - 3.500 3.501 - 8.250 Sussex Kent New Castle 0.0 - 0.1200 0.1201 - 0.2000 0.2001 - 0.7000 0.7001 - 3.500 3.501 - 8.250 Sussex Kent New Castle 0.0 - 0.1200 0.1201 - 0.2000 0.2001 - 0.7000 0.7001 - 3.000 3.001 - 8.250 0.0 - 0.1200 0.1201 - 0.2000 0.2001 - 0.7000 0.7001 - 3.000 3.001 - 8.250 Sussex Kent New Castle
Racial Disparities.25 Table 1 shows a breakdown in the percent of subprime loans in 1999 through 2007
by state and race for conventional home-purchase, refinance, and all loans. Overall, African-Americans have
TABLE 1.
Racial Disparities in Subprime Rates in Pennsylvania, New Jersey, and Delaware
PENNSYLVANIAAfrican-American
Type of Loan 1999 2000 2001 2002 2003 2004 2005 2006 2007
Conventional Home-Purchase Loans 5.7% 7.3% 8.1% 7.4% 6.4% 19.5% 35.9% 46.1% 34.5%
Refinance Loans 23.6% 47.4% 13.0% 12.5% 9.4% 15.2% 30.2% 48.8% 32.4%
All Loans 8.4% 11.1% 8.6% 9.6% 7.1% 15.1% 30.0% 42.4% 29.7%
Sample Size 1454 1536 1655 2302 3361 4361 4741 4973 4750
White
Type of Loan 1999 2000 2001 2002 2003 2004 2005 2006 2007
Conventional Home-Purchase Loans 1.5% 2.3% 2.7% 1.9% 2.6% 5.9% 10.7% 14.5% 10.9%
Refinance Loans 4.9% 12.8% 3.6% 3.6% 3.8% 5.9% 10.6% 21.1% 13.3% All Loans 2.4% 4.0% 3.1% 2.8% 3.3% 5.6% 10.2% 15.9% 11.2% Sample Size 27591 24089 49826 68527 96185 83778 79699 63895 65002 NEW JERSEY African-American Type of Loan 1999 2000 2001 2002 2003 2004 2005 2006 2007
Conventional Home-Purchase Loans 2.0% 2.6% 3.4% 3.2% 4.1% 13.3% 32.3% 39.4% 22.8%
Refinance Loans 7.1% 16.3% 4.9% 6.4% 7.0% 11.1% 23.9% 37.1% 21.7%
All Loans 2.9% 6.1% 3.7% 4.6% 5.8% 10.8% 25.8% 36.1% 20.9%
Sample Size 1546 1527 2322 3201 5281 6096 6795 6474 5572
White
Type of Loan 1999 2000 2001 2002 2003 2004 2005 2006 2007
Conventional Home-Purchase Loans 1.2% 1.7% 1.4% 1.0% 1.1% 3.0% 6.7% 11.5% 6.8%
Refinance Loans 2.6% 6.3% 2.5% 2.0% 2.5% 4.1% 8.0% 17.0% 10.0% All Loans 1.6% 2.7% 2.2% 1.7% 2.1% 3.5% 7.2% 14.0% 8.3% Sample Size 24406 19575 43933 62481 89862 71078 62795 45628 45871 DELAWARE African-American Type of Loan 1999 2000 2001 2002 2003 2004 2005 2006 2007
Conventional Home-Purchase Loans 3.4% 7.2% 7.9% 4.6% 6.0% 11.0% 29.5% 38.1% 23.9%
Refinance Loans 11.0% 37.3% 6.8% 7.6% 9.8% 10.9% 26.2% 36.7% 22.8%
All Loans 5.1% 8.1% 5.2% 4.8% 8.1% 9.2% 25.1% 33.7% 20.5%
Sample Size 235 265 362 492 428 1035 1239 1265 1027
White
Type of Loan 1999 2000 2001 2002 2003 2004 2005 2006 2007
Conventional Home-Purchase Loans 0.8% 1.6% 1.3% 1.1% 1.9% 3.3% 8.2% 10.7% 6.4%
Refinance Loans 2.5% 5.5% 2.0% 2.1% 3.3% 4.0% 9.0% 16.1% 8.5%
All Loans 1.3% 2.1% 1.7% 1.6% 2.8% 3.5% 8.3% 12.4% 7.0%
Sample Size 2776 2617 5758 7699 6430 9623 8826 6289 6134
Note: These are univariate statistics.
a higher percentage of subprime loans than whites in all three states in all years. Moreover, the percentage for African-Americans is nearly two times that of whites in all years in all states, and this pattern holds for each type of loan. (However, bear in mind that these are simple univariate statistics and that race might be a proxy for other variables correlated with risk and/or demand.)
The disparity in the percentage of subprime loans by race gives rise to a racial gap (Table 2). As Table 2 shows, there is a double-digit subprime gap among African-Americans and whites in the two types of loans and in all loans in 2005-2007 in all three states. Of the three states, Pennsylvania had the largest gap for all loans during the period, as well as all but one of the two different types of loans. However, the overriding point is that there is a racial gap in all years, in all loans, and in all states studied (albeit rather small for conventional home-purchase loans in 1999 and 2000 in New Jersey).
Income Differences. The differences in income by the race of borrowers holding subprime loans are also of interest. Table 3 presents the racial disparities in subprime mortgage holders by income for Pennsylvania, New Jersey, and Delaware for 1999-2007. African-Americans had a higher percentage of subprime loans than whites in each income category (low, moderate, middle, and upper) in all three states in all years, except for low income in 1999 in New Jersey and in 2002 in Delaware. Particularly noteworthy is the percentage of subprime mortgage
Table 2.
Percentage Point Disparities in Subprime Rates by Race in Pennsylvania,
New Jersey, and Delaware
PENNSYLvANIA
Type of Loan 1999 2000 2001 2002 2003 2004 2005 2006 2007
Conventional Home-Purchase Loans 4.1% 5.0% 5.3% 5.5% 3.8% 13.6% 25.2% 31.6% 23.6%
Refinance Loans 18.7% 34.6% 9.4% 8.9% 5.7% 9.3% 19.6% 27.7% 19.1%
All Loans 6.0% 7.1% 5.5% 6.8% 3.9% 9.4% 19.8% 26.4% 18.4%
Sample Size 29045 25625 51481 70829 99546 88139 84440 68868 69752
NEW JERSEY
Type of Loan 1999 2000 2001 2002 2003 2004 2005 2006 2007
Conventional Home-Purchase Loans 0.8% 0.9% 2.0% 2.2% 3.0% 10.3% 25.7% 27.9% 16.0%
Refinance Loans 4.6% 9.9% 2.4% 4.4% 4.5% 7.0% 16.0% 20.1% 11.7%
All Loans 1.3% 3.4% 1.5% 2.9% 3.7% 7.3% 18.5% 22.1% 12.6%
Sample Size 25952 21102 46255 65682 95143 77174 69590 52102 51443
DELAWARE
Type of Loan 1999 2000 2001 2002 2003 2004 2005 2006 2007
Conventional Home-Purchase Loans 2.6% 5.6% 6.6% 3.4% 4.1% 7.7% 21.3% 27.4% 17.5%
Refinance Loans 8.5% 31.8% 4.8% 5.6% 6.5% 6.9% 17.3% 20.6% 14.3%
All Loans 3.8% 6.0% 3.5% 3.2% 5.3% 5.8% 16.8% 21.3% 13.5%
Sample Size 3011 2882 6120 8191 6858 10658 10065 7554 7161
Note: These percentages reflect the African-American subprime rates minus the white subprime rates. Sample size indicates combined sample of African-Americans and whites.
TABLE 3.
Disparities in Subprime Mortgage Holders by Income in Pennsylvania,
New Jersey, and Delaware
PENNSYLVANIA African-American Income Level 1999 2000 2001 2002 2003 2004 2005 2006 2007 Low 10.5% 17.4% 16.9% 8.8% 11.0% 18.4% 31.0% 43.4% 27.1% Moderate 6.8% 11.7% 7.9% 10.7% 7.8% 17.1% 34.2% 42.1% 32.3% Middle 8.9% 10.0% 9.3% 11.8% 8.7% 17.3% 31.5% 39.7% 28.5% Upper 9.4% 11.4% 10.0% 9.6% 7.7% 16.7% 30.6% 43.4% 29.9% Sample Size 1454 1536 1655 2302 3361 4361 4741 4973 4750 White Income Level 1999 2000 2001 2002 2003 2004 2005 2006 2007 Low 4.4% 6.1% 4.1% 3.6% 4.3% 8.6% 12.4% 19.8% 15.2% Moderate 3.2% 5.6% 4.2% 3.8% 4.4% 7.6% 13.0% 19.1% 13.4% Middle 2.5% 4.4% 3.7% 3.5% 3.9% 6.3% 11.5% 16.5% 11.4% Upper 2.3% 3.5% 3.1% 2.7% 2.9% 4.9% 9.0% 13.9% 9.8% Sample Size 27591 24089 49826 68527 96185 83778 79699 63895 65002 NEW JERSEY African-American Income Level 1999 2000 2001 2002 2003 2004 2005 2006 2007 Low 1.4% 3.4% 3.2% 6.1% 10.7% 13.6% 23.8% 23.5% 23.8% Moderate 3.4% 5.8% 3.8% 7.6% 8.3% 10.7% 24.5% 32.3% 18.2% Middle 3.2% 5.9% 6.3% 5.8% 6.7% 12.0% 26.8% 31.3% 15.9% Upper 3.1% 6.8% 3.7% 4.8% 6.3% 11.3% 28.6% 38.7% 27.1% Sample Size 1546 1527 2322 3201 5281 6096 6795 6474 5572 White Income Level 1999 2000 2001 2002 2003 2004 2005 2006 2007 Low 2.1% 2.8% 2.7% 2.5% 3.2% 3.3% 8.2% 11.8% 7.8% Moderate 1.7% 3.5% 3.1% 2.3% 3.0% 3.8% 8.2% 12.6% 6.7% Middle 1.7% 3.3% 2.7% 2.3% 2.7% 4.1% 8.2% 13.0% 7.3% Upper 1.5% 2.4% 2.1% 1.6% 1.8% 3.0% 7.0% 14.2% 8.5% Sample Size 24406 19575 43933 62481 89862 71078 62795 45628 45871 DELAWARE African-American Income Level 1999 2000 2001 2002 2003 2004 2005 2006 2007 Low 12.5% 21.4% 14.3% 0.0% 17.7% 13.9% 17.4% 25.0% 12.0% Moderate 4.0% 5.6% 3.3% 5.2% 7.1% 12.0% 25.4% 29.3% 23.0% Middle 7.5% 5.8% 4.7% 6.3% 11.8% 8.1% 30.2% 31.8% 17.0% Upper 4.7% 9.7% 6.7% 5.3% 8.5% 9.6% 23.7% 36.0% 21.3% Sample Size 235 265 362 492 428 1035 1239 1265 1027 White Income Level 1999 2000 2001 2002 2003 2004 2005 2006 2007 Low 1.6% 6.7% 4.4% 4.5% 5.0% 3.1% 9.8% 10.1% 4.4% Moderate 1.3% 4.0% 2.8% 2.5% 3.0% 4.2% 10.9% 15.2% 5.5% Middle 2.2% 1.5% 2.8% 2.5% 3.3% 4.4% 10.6% 13.2% 7.4% Upper 0.9% 1.9% 1.3% 1.5% 2.5% 3.1% 6.5% 10.7% 6.7% Sample Size 2776 2617 5758 7699 6430 9623 8826 6289 6134
holders in the upper-income category. African-Americans had nearly two times the percentage of subprime loans as whites in the upper-income level in each of the three states in all years. This is worth mentioning since there is some speculation that some borrowers in this income category could have qualified for a prime loan but were taken advantage of and saddled with a subprime loan in-stead.26 Alternatively, it may very well be that these
bor-rowers, despite their high incomes, were high credit risks who warranted a subprime loan.
Estimation Technique
The existence of racial disparities in the share of subprime loans does not necessarily imply any bias toward any segment of borrowers. Clearly, the characteristics of the groups play a role. For a better understanding, we ex-amine the likelihood that a borrower receives a subprime or prime home-purchase mortgage loan. This is accom-plished by estimating logistic regressions of the following form for the three states studied pooled for each year from 1999 through 2007:
(1) Lgn = βg Xgn + μgn (n = 1, …. , ng), where Lgn represents the binary choice of observation n
in group g where L is either a prime or subprime loan (and L=1 if the borrower got a subprime home-purchase loan, and 0 otherwise); Xgn is a 1 x KL vector of variables that reflect socio-economic, loan-related, and credit-related characteristics (see Table A-1 for a list of the variables); βg is a KL x 1 vector of parameters; and μgn is a stochastic component of observation n in group g, where mean = 0 and variance = σμg2 or μ
gn ~ N( 0, σμg2).
Logistic regressions were estimated for all home-purchase mortgage loans in all three states for each year. While the results of the regressions for all years will be discussed, Table 4 shows the findings of the logit regres-sion for 2005 for illustrative purposes.27
Most of the results for the regressions in all years are rather robust. As shown in Table 4, all of the
vari-TABLE 4.
Logistic Regressions for
African-Americans and Whites in the
Three States in 2005
Intercept -1.8105*** (0.2293) African-American 0.5903*** (0.0276) Female 0.0919*** (0.0192) Log Income -0.1881*** (0.0209) Loan Amount -0.0010*** (0.0001) FICO (559 or less) 3.7075*** (0.0402) FICO (560 - 660) 1.9402*** (0.0216) FICO (missing) 1.4089*** (0.0247) Debt-to-Income (40 and over) 1.1001***(0.0248) Debt-to-Income (missing) 0.2500***
(0.0240)
Documentation (Full) -0.2316***
(0.0244) Documentation (Not Full) -0.8386***
(0.0379)
Tract Income (Low) 0.6527***
(0.0595)
Tract Income (Moderate) 0.4544***
(0.0335)
Tract Income (Middle) 0.2577***
(0.0244) Minority Tract -0.0717*** (0.0354) Percent Denial 2.6131*** (0.0940) Percent Turnover -1.2984*** (0.1198) Nonowner Occupancy 0.7400*** (0.0300) Sample size is 172,246. Wald chi-squared test is 20983.697 with 18 df (<0.0001).
Note: Standard errors are in parentheses. *** significant to the 5% level
26 See National Community Reinvestment Coalition (2007), p. 18. 27 The regressions for the remaining years of the data used here are
ables, with the possible exception of one, have the expected sign and are statistically significant. For instance, a borrower’s income is inversely related to having a subprime versus a prime loan. Similarly, all three levels of tract income are positive, implying that income levels other than the highest ones are associated with a higher probability of taking out a subprime loan. Both loan amount and minority tract have an inverse association with the probability of having a subprime loan. While the former might be expected, a case could be made that the latter might have a positive sign. However, the influence of the minority tract variable might be explained by drawing on a rationale offered in the study by Calem et al.: The result might reflect the presence of community reinvestment-type loans by depository institutions crowding out subprime loans.28 Both the full documentation
and not full documentation variables are negatively associated with a subprime loan.29 Nonowner occupancy is
positively related with having a subprime loan.The turnover rate and denial rate variables exhibit the expected signs. In the former case, there is an inverse association with the probability of having a subprime loan, while there is a positive relationship in the latter case. Moreover, the variables reflecting a borrower’s creditworthi-ness have the expected signs. Thus, borrowers with low credit scores (559 or lower and 560 to 660) and DTIs of 40 and over are more likely to hold a subprime loan. These results generally tend to hold to varying degrees in the remaining regressions. But perhaps the most compelling finding is the performance of the race variable. It is consistently positive and statistically significant in the regressions for all years (Table 5). This implies that African-Americans have a relatively high probability of having a subprime versus a prime loan.
While the results of the logistic regressions are instructive, there is a potential concern when using single-equation models to infer discrimination. As Yezer, Phillips, and Trost point out, a potential bias might arise in the estimated coefficients because some of the explanatory variables are endogenous. In the present context, DTI, loan amount, and borrower’s income are likely to be considered endogenous. To account for this possible concern, we performed a robustness test and found that any resulting bias had virtually no effect on the conclusions.30
28 See Calem et al., p. 401.
29 The negative sign on the full documentation variable is expected. But the negative sign on the not full documentation variable might
be misleading. In our data, the vast majority of those with these types of mortgage documentation received prime loans. However, the excluded variable is unknown documentation type, a category in which many borrowers received a subprime loan and are likely to have supplied low or no documentation during the mortgage process.
TABLE 5.
Race Coefficients from the Logistic Regressions by Year
Year African-American Coefficient Standard Error Sample Size
1999 0.4606*** 0.0765 74255 2000 0.3861*** 0.0614 66050 2001 0.3522*** 0.0601 121600 2002 0.6507*** 0.0538 160121 2003 0.4358*** 0.0462 215520 2004 0.2189*** 0.0356 189152 2005 0.5903*** 0.0276 172246 2006 0.4643*** 0.0255 138864 2007 0.2614*** 0.0297 140426
Decomposition. Since the racial disparity cannot be justified by differences in the groups’ characteristics, we further investigate the racial gap by determining the fraction of the gap that can be explained by character-istics. We do so by using a variant of the Blinder-Oaxaca decomposition technique developed by Fairlie.31 The
approach allows for the decomposition when using a binary choice model to identify the factors that contribute to a borrower’s being more likely to receive a subprime home-purchase loan. It permits the identification of the portion of the gap that can be explained by group differences in characteristics (or endowments) and the frac-tion attributable to the returns to the characteristics (or coefficients) of groups. The basic underlying estimat-ing specification used in the decomposition is a modification of equation (1), where equation (1) is estimated separately for each race in each of the three study areas using the same explanatory variables.
The nonlinear decomposition is represented as follows: (2)
where Xj is a row vector of average values of the independent variables, is a vector of coefficient estimates for
race j, and Lj is the average probability of having a subprime loan for race j.
The decomposition can be performed in two ways. In this formulation, the African-American coeffi-cient estimates, βˆA A− , serve as weights in the first term of (2), while the white distributions of the independent
variables, XW, serve as weights in the second term. Alternatively, the decomposition can be carried out with the
white coefficient estimates as weights in the first term and the African-American distributions of the indepen-dent variables as weights in the second term. Both approaches are equally valid but have different implications. In the first method, the decomposition assumes that African-Americans possess the average characteristics of whites and receive the returns to these characteristics that were estimated from the African-American sample — which is referred to in this study as the African-American specification. The second approach assumes that African-Americans have their average characteristics and receive the returns to the characteristics estimated from the white sample — which is referred to here as the white specification. Moreover, these two approaches have different inferences from a policy perspective. In the former method, the implication is that, in time, African-Americans will have the same characteristics as whites. In the latter approach, some action might be necessary to ensure that African-Americans receive the same returns to characteristics as whites. However, in both cases, the racial gap is decomposed into a portion explained by the differences in group characteristics and a portion attributable to differences in coefficients (or behavioral responses to characteristics).
The marginal contribution of variables to the group difference in the gap is somewhat involved when using logistic estimation. According to Fairlie, if we assume that the two groups are of equal size (NW = NA-A) and there is a one-to-one matching of African-American and white observations, then using the estimated coef-ficients from a logistic regression, the independent contribution of X1 to the racial gap in subprime rates can be expressed as:32 (3) 0 1 1 2 2 0 1 1 2 2 1
1
NW(
ˆ
ˆ
ˆ
)
(
ˆ
ˆ
ˆ
)
W W W W A A W W W i i i i iF
X
X
F
X
X
N
α
β
β
α
β
β
− =
+
+
−
+
+
∑
1 1 1 1 ˆ ˆ ˆ ˆ ( ) ( ) ( ) ( ) W W A A A A A A A A W W W W W A A N N N N w A A i i i i W A A W W i i i i F X F X F X F X L L N N N Nβ
− − −β
−β
β
− − − = = = = − = − + − ∑
∑
∑
∑
30 We followed the procedure used by Courchane (2007), whereby we dropped DTI, loan amount, and borrower’s income and added
bor-rower’s income as a percentage of area medium income. The results were quite similar to those reported here.
31 See Blinder (1973), pp. 436-55; Oaxaca (1973), pp. 693-709; and Fairlie (2005), pp. 305-16 . 32 See Fairlie (2005), p. 308.
However, in most cases the two groups have different sample sizes, as is the case here. Fairlie’s decomposition approach compensates for this by drawing a “random subsample of whites equal in size to the full black sample (NB). Each observation in the white subsample and full black sample is then separately ranked by the predicted probabilities and matched by their respective rank-ings. This procedure matches whites who have characteristics placing them at the bottom (top) of their distribution with blacks who have charac-teristics placing them at the bottom (top) of their distribution.”33 Given that the resulting
decom-position estimates rely on the randomly chosen subsample of whites, possible issues might arise re-garding the sampling. To avoid this concern, Fairlie recommends drawing “a large number of random subsamples of whites, match each of these ran-dom subsamples of whites to the black sample, and calculate separate decomposition estimates. The mean value of estimates from the separate decom-positions is calculated and used to approximate the results for the entire white sample.”34 In the
decompositions in this study, we used 200 random subsamples of whites.
The nonlinear decomposition of the Afri-can-American–white gap in subprime mortgages was carried out for the pooled states in each year from 1999 to 2007, using both the African-Ameri-can and white weights. Table 6 is representative of the decompositions and shows the portion of the racial gap in the probability of having a subprime loan that is explained by group differences in char-acteristics for 2005, using both the African-Amer-ican and white specifications as defined above. (The decompositions for the other years are in the appendix Tables B-1 and B-2.) The decomposition for 2005 indicates that the characteristics included in the estimation are all statistically significant and
TABLE 6.
Decomposition Results of Racial
Disparities in Subprime Rates in 2005
2005
(1) (2)
Sample used for coefficients African-American White
White subprime rate 0.0929 0.0929
African-American subprime rate 0.2927 0.2927 White/African-American gap -0.1998 -0.1998 Contributions from racial differences in:
Female -0.0010 -0.0017 0.0011 0.0003 0.48% 0.87% Log Income -0.0022 -0.0031 0.0015 0.0004 1.11% 1.53% Loan Amount 0.0002 -0.0035 0.0014 0.0003 -0.09% 1.76% FICO -0.0744 -0.0770 0.0021 0.0008 37.24% 38.52% Debt-to-Income Ratio 0.0007 0.0001 0.0005 0.0001 -0.33% -0.04% Tract Income -0.0125 -0.0138 0.0029 0.0013 6.25% 6.93% Minority Tract 0.0017 -0.0026 0.0040 0.0024 -0.84% 1.28% Percent Denial -0.0397 -0.0436 0.0042 0.0016 19.86% 21.84% Percent Turnover 0.0017 0.0042 0.0006 0.0004 -0.86% -2.12% Documentation 0.0069 0.0042 0.0008 0.0003 -3.48% -2.11% Owner Occupancy 0.0019 0.0024 0.0003 0.0001 -0.96% -1.20%
Percent Total (Explained) 58.38% 67.25%
Sample Size 14,364 14,364
Note: All equations were estimated using the white specifications.
33 See Fairlie (2005), p. 309. 34 See Fairlie (2005).
account for 58.4 percent of the gap using the African-American specification and 67.3 percent for the white specification. A closer look at the contributions made by specific characteristics reveals that borrowers’ credit scores and the percent denial variable are the major factors in explaining the racial gap in subprime rates in the two specifications. The influence of credit scores is 37.2 percent in the African-American specification and 38.5 percent in the white specification, while the percent denial accounts for 19.9 and 21.8 percent of the total gap in the respective specifications.
It is interesting to note the contrast in the decomposition results of 2005 with those of 2003, a period in which subprime lending increased dramatically. The decomposition for 2003 shows that the group differences in characteristics explain 51.7 percent and 52.3 percent of the racial gap in subprime rates, under the African-American and white specifications, respectively (Table 7). These percentages are lower than those for 2005. The decrease in the explanatory power of the group differences in characteristics might be due in large part to the change that took place in the financial environment during 2003. Low interest rates, an increased willing-ness by investors on Wall Street to assume the risks associated with the securitization of mortgage loans, an excess capacity in the lending industry, and intense competition in the mortgage market all combined to create an explosion in loan originations nationally and in the three states we studied.35 The increase in subprime loan
originations was particularly striking in the refinance area. Nationally, loan refinances totaled approximately 2.5 trillion.36 Refinance loans in Pennsylvania, New Jersey, and Delaware totaled 76.8, 95.7, and 7.2 billion,
respec-tively.37 However, the desire to accommodate the increased demand by investors for high-yielding
mortgage-backed securities38 led some lenders to loosen underwriting standards in order to generate more subprime loans
for securitization pools.39 This was accentuated with the offering of loans requiring minimal or no
documenta-Total Percent Explained Year White African-American White/African- African-American White
subprime rate subprime rate American gap Specification Specification Sample Size
1999 0.0204 0.0556 -0.0352 65.5% 44.9% 6,511 2000 0.0340 0.0868 -0.0528 69.5% 45.4% 6,777 2001 0.0274 0.0655 -0.0382 64.1% 50.2% 7,677 2002 0.0232 0.0730 -0.0498 48.3% 33.9% 9,003 2003 0.0296 0.0761 -0.0465 51.7% 52.3% 11,617 2004 0.0481 0.1366 -0.0885 72.4% 86.1% 13,959 2005 0.0929 0.2927 -0.1998 58.4% 67.3% 14,364 2006 0.1467 0.3845 -0.2378 58.0% 76.6% 14,528 2007 0.0945 0.2411 -0.1465 65.8% 86.2% 13,623
TABLE 7.
Summary of Nonlinear Decomposition Results of Racial Disparities
in Subprime Rates: Total Percent Explained by Year
35 See Ip and Hilsenrath (2007); Bernanke (2007); Brubaker (2007); and Ashcraft and Schuermann (2008). 36 See U.S. Department of Housing and Urban Development (2004).
37 See U.S. Department of Housing and Urban Development (2004).
38 “The subprime loan securitization rate [grew] from less than 30 percent in 1995 to over 58 percent in 2003.” See Chomsisengphet and
Pennington-Cross (2006), p. 37.
tion of income.40 In addition, some lenders made limited use of credit scores. These events no doubt lessened
the influence of certain variables used here in explaining the racial gap in subprime rates.
This is further underscored by comparing the specifics of the decomposition results for 2003 and 2005 (see Table B2). Using the white specification, differences in group characteristics explained 52.3 percent of the racial gap in subprime rates in 2003, but 67.3 percent in 2005. Similarly, the contributions made by credit scores and the percentage of denial variables were 31 and 15.4 percent, respectively in 2003, but 38.5 and 21.8 percent, respectively in 2005. Alternatively, if the unexplained portion is viewed as a proxy for possible bias in lending — more will be said about this later — then a pure cross-sectional estimation of the influence of race in subprime lending in 2003 would be misleading. Such an approach would fail to reflect the distinct temporal explanatory aspect of the impact of race in subprime lending. Thus, an investigation of subprime lending over time using the decomposition technique provides a better context for assessing the effect of race as shown here.
Table 7 summarizes the decomposition of the African-American – white gap in subprime rates in 1999 through 2007 that are explained by group differences in characteristics. As Table 7 shows, group characteristics accounted for 33.9 percent to 86.2 percent of the gap across the states studied and two specifications. But that leaves 13.8 to 66.1 percent unexplained. Some researchers regard the unexplained fraction as a measure of the discrimination in the mortgage market. However, the “unexplained” portion is somewhat difficult to interpret, since it might capture both group differences in unmeasurable or unobserved endowments and possible bias in the lending process.
CONCLUDING REMARKS
This study helps to highlight the influence of race in the allocation of mortgage capital between the prime and subprime markets. It improves upon previous efforts by using a unique data set and the analysis of the racial gap in subprime mortgages is carried out over time—1999 through 2007. Moreover, we employ an estimating procedure that allows the racial differences in the probability of receiving a subprime loan compared to a prime loan to be separated into that portion arising from differences in identifiable characteristics and the remaining unexplained portion. The results, for the most part, are quite robust. Credit scores and the denial rate for non-subprime conventional loans tend to be key factors in accounting for the difference in the racial disparity in subprime rates. However, the influence of race remains contentious. The statistically significant ef-fect of race in the logistic regressions and the results of the decomposition of the African-American – white gap in subprime rates suggest a possible role played by race in the receipt of subprime loans instead of prime loans. Although the unexplained portion of the decomposition remains open for interpretation, the possibility of bias in mortgage lending for the period examined here cannot be ruled out.41
40 See Ip and Hilsenrath (2007), p. A8.
41 This is predicated on the notion, as stated above, that some analysts regard the unexplained portion as an approximation of the degree
REFERENCES
Ashcraft, Adam B., and Til Schuermann. “Understanding the Securitization of Subprime Mortgage Credit,” Federal Reserve Bank of New York, Staff Reports, No. 318, 2008.
Avery, Robert B., Glenn B. Canner, and Robert E. Cook. ‘‘New Information Reported under HMDA and Its Application in Fair Lending Enforcement,’’ Federal Reserve Bulletin, 91 (Summer 2005), pp. 344–94.
Avery, Robert B., Kenneth P. Brevoort, and G. B. Canner. “Higher-Priced Home Lending and the 2005 HMDA Data,” Federal Reserve Bulletin (2006).
Bernanke, Ben S. “The Subprime Mortgage Market,” remarks at the Federal Reserve Bank of Chicago’s 43rd Annual Conference on Bank Structure and Competition, Chicago (May 17, 2007).
Blackburn, McKinley, and Todd vermilyea. “The Role of Information Externalities and Scale Economies in Home Mortgage Lending Decisions,” Journal of Urban Economics, 61 (2007).
Blinder, Alan S. “Wage Discrimination: Reduced Form and Structural Estimates,” Journal of Human Resources, 8 (1973).
Bocian, Debbie Grunstein, Keith S. Ernst, and Wei Li. “Unfair Lending: The Effect of Race and Ethnicity on the Price of Subprime Mortgages,” Center for Responsible Lending (May 31, 2006).
Brubaker, Harold. “Subprime Debtors Few, but Expose Growing Risk,” Philadelphia Inquirer, August 5, 2007. Calem, Paul S., Kevin Gillen, and Susan Wachter. “The Neighborhood Distribution of Subprime Mortgage Lending,” Journal of Real Estate Finance and Economics, 29:4 (2004).
Chomsisengphet, Souphala, and Anthony Pennington-Cross. “The Evolution of the Subprime Mortgage Mar-ket,” Federal Reserve Bank of St. Louis Review, 88:1 (2006).
Courchane, Marsha, J. “The Pricing of Home Mortgage Loans to Minority Borrowers: How Much of the ARP Differential Can We Explain?” Journal of Real Estate Research, 29:4 (2007).
“Doyle to Sign Legislation Against Predatory Lenders,” Riverwest Currents online edition (April 2004), http:// www.riverwestcurrents.org/2004/April/001628.html.
Fairlie, Robert W. “An Extension of the Blinder-Oaxaca Decomposition Technique to Logit and Probit Models,”
Journal of Economic and Social Measurement, 30 (2005).
Gramlich, Edward M. “Subprime Mortgage Lending: Benefits, Costs and Challenges,” remarks to the Financial Services Roundtable Annual Housing Policy Meeting, Chicago (May 21, 2004).
Henderson, Christopher. “Nontraditional Lending to Subprime Borrowers—A viable Path to Homeownership?”
SRC Insights, Federal Reserve Bank of Philadelphia (Second Quarter 2007).
Hudson, Michael. “Lending a Hand: How Wall Street Stoked the Mortgage Meltdown,” Wall Street Journal, June 27, 2007.
Immergluck, D., and M. Wiles. Two Steps Back: The Dual Mortgage Market, Predatory Lending, and the Undoing of Community Development. Chicago: The Woodstock Institute, November 1999.
Ip, Greg, and Jon E. Hilsenrath. “How Credit Got So Easy and Why It’s Tightening,” Wall Street Journal, August 7, 2007.
Lang, William W., and Leonard I. Nakamura. “A Model of Redlining,” Journal of Urban Economics, 33 (1993). Mayer, Chris, and Karen Pence. ‘’Subprime Mortgages: What, Where, and to Whom?’’ in Edward L. Glaeser and John M. Quigley, eds., Housing Markets and the Economy: Risk, Regulation, and Policy. Cambridge, MA: Lincoln Institute of Land Policy, 2009.
National Community Reinvestment Coalition. Income Is No Shield Against Racial Differences in Lending: A Com-parison of High-Cost Lending in America’s Metropolitan Areas. July 2007.
Oaxaca, Ronald. “Male-Female Wage Differentials in Urban Labor Markets,” International Economic Review, 14 (1973).
U.S. Department of Housing and Urban Development, Office of Policy Development and Research, “An Analy-sis of Mortgage Refinancing, 2001-2003,” November 2004.
Yezer, Anthony, Robert Phillips, and Robert Trost. “Bias in Estimates of Discrimination and Default in Lending: The Effects of Simultaneity and Self-Selection,” Journal of Real Estate Finance and Economics, 9 (1994).
TABLE A1.
Definition of Regression Analysis and Decomposition Variables
African-American Dummy variable that equals one if the borrower is African-American
Female Dummy variable that equals one if the borrower is female
Log Income Natural log of the borrower's income
Loan Amount Amount of the borrower's loan
FICO (559 or less) Dummy variable that equals one if the borrower has a FICO score of 559 or less
FICO (560 - 660) Dummy variable that equals one if the borrower has a FICO score between 560 and
660
FICO (missing) Dummy variable that equals one if the borrower has a FICO score that is missing
Debt-to-Income (40 and over) Dummy variable that equals one if the borrower has a debt-to-income ratio of 40 and over
Debt-to-Income (missing) Dummy variable that equals one if the borrower has a debt-to-income ratio that is
missing
Documentation (Full) Dummy variable that equals one if the borrower has a full documentation loan
Documentation (Unknown) Dummy variable that equals one if the borrower has a loan where the documentation
type is unknown
Tract Income (Low) Dummy variable that equals one if the tract is a low-income tract. HUD designates
a tract as low income if the tract median family income as a proportion of the MA's median family income is less than 50 percent.
Tract Income (Moderate) Dummy variable that equals one if the tract is a moderate-income tract. HUD
designates a tract as moderate income if the tract median family income as a proportion of the MA's median family income is more than 50 percent but less than 80 percent.
Tract Income (Middle) Dummy variable that equals one if the tract is a middle-income tract. HUD designates
a tract as middle income if the tract median family income as a proportion of the MA's median family income is more than 80 percent but less than 120 percent.
Minority Tract Dummy variable that equals one if the census tract is over 30 percent minority
Percent Denial Denial rate for non-subprime conventional loans in a census tract
Percent Turnover Number of home-purchase loans divided by total owner-occupied housing units in a
census tract
Nonowner Occupancy Dummy variable that equals one if the loan is non-owner occupied
TABLE B1.
Decomposition Results of Racial Disparities in Subprime Rates by Year and
Race Specification: African-American Sample
1999 2000 2001 2002 2003 2004 2005 2006 2007
White subprime rate 0.0204 0.0340 0.0274 0.0232 0.0296 0.0481 0.0929 0.1467 0.0945 African-American subprime rate 0.0556 0.0868 0.0655 0.0730 0.0761 0.1366 0.2927 0.3845 0.2411 White/African-American gap -0.0352 -0.0528 -0.0382 -0.0498 -0.0465 -0.0885 -0.1998 -0.2378 -0.1465 Contributions from racial differences in:
Female -0.0010 0.0006 0.0002 0.0014 -0.0010 -0.0001 -0.0010 -0.0021 -0.0007 0.0011 0.0011 0.0010 0.0009 0.0009 0.0007 0.0011 0.0012 0.0010 2.73% -1.11% -0.49% -2.76% 2.11% 0.16% 0.48% 0.88% 0.45% Log Income 0.0021 -0.0002 0.0014 -0.0027 -0.0092 -0.0029 -0.0022 0.0039 0.0009 0.0011 0.0016 0.0013 0.0016 0.0020 0.0010 0.0015 0.0013 0.0012 -6.03% 0.37% -3.72% 5.38% 19.71% 3.28% 1.11% -1.66% -0.60% Loan Amount -0.0112 -0.0064 -0.0099 -0.0061 0.0019 -0.0029 0.0002 -0.0011 -0.0027 0.0017 0.0022 0.0018 0.0017 0.0018 0.0010 0.0014 0.0008 0.0009 31.80% 12.14% 25.87% 12.26% -4.03% 3.30% -0.09% 0.48% 1.81% FICO -0.0025 -0.0086 -0.0061 -0.0095 -0.0095 -0.0440 -0.0744 -0.0873 -0.0581 0.0013 0.0017 0.0014 0.0017 0.0014 0.0018 0.0021 0.0023 0.0022 7.07% 16.30% 15.96% 19.05% 20.32% 49.72% 37.24% 36.69% 39.62% Debt-to-Income Ratio -0.0020 -0.0040 -0.0006 -0.0005 0.0006 0.0007 0.0007 0.0013 -0.0145 0.0007 0.0009 0.0004 0.0004 0.0004 0.0002 0.0005 0.0004 0.0014 5.56% 7.65% 1.62% 1.06% -1.36% -0.79% -0.33% -0.54% 9.90% Tract Income -0.0018 -0.0006 -0.0010 0.0000 0.0039 -0.0094 -0.0125 -0.0216 -0.0216 0.0026 0.0032 0.0027 0.0026 0.0023 0.0022 0.0029 0.0034 0.0034 5.08% 1.05% 2.65% 0.04% -8.29% 10.64% 6.25% 9.07% 14.71% Minority Tract -0.0032 -0.0063 -0.0054 -0.0017 -0.0076 0.0027 0.0017 0.0008 0.0032 0.0028 0.0032 0.0027 0.0026 0.0033 0.0037 0.0040 0.0043 0.0041 9.03% 11.89% 14.27% 3.39% 16.30% -3.04% -0.84% -0.32% -2.16% Percent Denial -0.0024 -0.0069 -0.0031 -0.0034 -0.0060 -0.0149 -0.0397 -0.0430 -0.0291 0.0016 0.0020 0.0017 0.0017 0.0016 0.0023 0.0042 0.0050 0.0042 6.79% 13.00% 8.04% 6.91% 12.92% 16.84% 19.86% 18.06% 19.88% Percent Turnover -0.0049 -0.0076 -0.0010 -0.0035 -0.0013 0.0010 0.0017 0.0025 0.0024 0.0022 0.0018 0.0011 0.0011 0.0006 0.0004 0.0006 0.0010 0.0006 13.91% 14.34% 2.51% 6.98% 2.87% -1.17% -0.86% -1.04% -1.64% Documentation 0.0037 0.0032 0.0011 0.0020 0.0038 0.0025 0.0069 0.0085 0.0197 0.0010 0.0010 0.0004 0.0005 0.0009 0.0006 0.0008 0.0009 0.0020 -10.43% -5.99% -2.81% -3.98% -8.27% -2.83% -3.48% -3.59% -13.47% Owner Occupancy 0.0000 0.0001 -0.0001 0.0000 0.0003 0.0032 0.0019 0.0001 0.0040 0.0005 0.0001 0.0001 0.0001 0.0002 0.0006 0.0003 0.0002 0.0003 0.03% -0.17% 0.22% -0.02% -0.58% -3.67% -0.96% -0.04% -2.74% Percent Total (Explained) 65.54% 69.47% 64.12% 48.32% 51.69% 72.44% 58.38% 57.99% 65.77%
Sample Size 6,511 6,777 7,677 9,003 11,617 13,959 14,364 14,528 13,623
Table B2.
Decomposition Results of Racial Disparities in Subprime Rates by Year and
Race Specification: White Sample
1999 2000 2001 2002 2003 2004 2005 2006 2007
White subprime rate 0.0204 0.0340 0.0274 0.0232 0.0296 0.0481 0.0929 0.1467 0.0945 African-American subprime rate 0.0556 0.0868 0.0655 0.0730 0.0761 0.1366 0.2927 0.3845 0.2411 White/African-American gap -0.0352 -0.0528 -0.0382 -0.0498 -0.0465 -0.0885 -0.1998 -0.2378 -0.1465 Contributions from racial differences in:
Female -0.0002 0.0000 -0.0005 0.0000 -0.0004 -0.0008 -0.0017 -0.0025 -0.0002 0.0003 0.0005 0.0003 0.0002 0.0002 0.0002 0.0003 0.0004 0.0003 0.57% 0.07% 1.41% 0.02% 0.88% 0.90% 0.87% 1.04% 0.13% Log Income -0.0011 -0.0023 -0.0019 -0.0027 -0.0049 -0.0029 -0.0031 -0.0030 -0.0060 0.0004 0.0006 0.0004 0.0004 0.0004 0.0003 0.0004 0.0005 0.0005 3.00% 4.28% 4.94% 5.47% 10.48% 3.32% 1.53% 1.28% 4.09% Loan Amount -0.0024 -0.0034 -0.0021 -0.0008 0.0003 -0.0030 -0.0035 -0.0010 0.0019 0.0004 0.0006 0.0003 0.0003 0.0003 0.0003 0.0003 0.0003 0.0003 6.69% 6.42% 5.49% 1.59% -0.68% 3.40% 1.76% 0.42% -1.30% FICO -0.0068 -0.0101 -0.0093 -0.0115 -0.0144 -0.0465 -0.0770 -0.1021 -0.0699 0.0008 0.0008 0.0006 0.0006 0.0005 0.0006 0.0008 0.0009 0.0009 19.22% 19.21% 24.30% 23.07% 31.04% 52.59% 38.52% 42.95% 47.73% Debt-to-Income Ratio -0.0013 -0.0025 0.0005 -0.0001 0.0009 0.0008 0.0001 -0.0009 -0.0084 0.0004 0.0005 0.0001 0.0001 0.0001 0.0001 0.0001 0.0001 0.0003 3.78% 4.82% -1.40% 0.12% -1.98% -0.86% -0.04% 0.36% 5.75% Tract Income -0.0012 -0.0015 -0.0023 -0.0021 -0.0017 -0.0076 -0.0138 -0.0153 -0.0153 0.0010 0.0014 0.0008 0.0009 0.0009 0.0010 0.0013 0.0015 0.0015 3.48% 2.91% 5.97% 4.17% 3.59% 8.58% 6.93% 6.42% 10.47% Minority Tract 0.0005 -0.0014 -0.0015 0.0026 0.0022 -0.0029 -0.0026 -0.0049 -0.0001 0.0017 0.0023 0.0016 0.0014 0.0012 0.0016 0.0024 0.0028 0.0027 -1.37% 2.64% 3.91% -5.22% -4.81% 3.24% 1.28% 2.06% 0.07% Percent Denial -0.0049 -0.0031 -0.0007 -0.0021 -0.0072 -0.0199 -0.0436 -0.0713 -0.0491 0.0011 0.0013 0.0007 0.0006 0.0007 0.0011 0.0016 0.0022 0.0020 13.89% 5.88% 1.91% 4.27% 15.44% 22.50% 21.84% 29.98% 33.51% Percent Turnover -0.0017 -0.0015 -0.0017 -0.0006 -0.0004 0.0029 0.0042 0.0086 0.0053 0.0004 0.0004 0.0003 0.0001 0.0001 0.0003 0.0004 0.0007 0.0004 4.72% 2.89% 4.48% 1.16% 0.90% -3.24% -2.12% -3.61% -3.60% Documentation 0.0030 0.0022 0.0002 0.0003 0.0008 0.0021 0.0042 0.0060 0.0076 0.0007 0.0006 0.0001 0.0001 0.0002 0.0002 0.0003 0.0004 0.0006 -8.37% -4.09% -0.63% -0.68% -1.67% -2.37% -2.11% -2.52% -5.21% Owner Occupancy 0.0002 -0.0002 0.0000 0.0001 0.0004 0.0017 0.0024 0.0043 0.0079 0.0002 0.0001 0.0001 0.0000 0.0001 0.0002 0.0001 0.0002 0.0003 -0.67% 0.36% -0.13% -0.11% -0.92% -1.93% -1.20% -1.82% -5.40% Percent Total (Explained) 44.93% 45.39% 50.24% 33.86% 52.27% 86.12% 67.25% 76.57% 86.24%
Sample Size 6,511 6,777 7,677 9,003 11,617 13,959 14,364 14,528 13,623