70
available online at www.ssbfnet.com
Determinants of Non Performing Loans in Commercial Banks:
A Study of NBC Bank Dodoma Tanzania
Dr. N.Viswanadham.
Lecturer, Department of Accounting,and Finance, School of Business and Economics, The University of Dodoma, Tanzania.
Nahid B
Finance professional, Dodoma, Tanzania.
Abstract
The study attempts to ascertain the determinants of nonperforming loans in National Bank of Commerce. Data was collected from 152 respondents. Tables, percentages, mean and standard deviation were used to analyze data. Data collection methods adopted for the study were interview, questionnaire and documentary evidence. Interest rate, GDP, concentration of lending activities, bank’s loan supervision capacity and economic condition were investigated, and the results suggest that interest rate, GDP, bank’s loan supervision capacity and economic condition influence the level of NPLs. However, the results did not suggest that concentration of lending activities increase the level of NPLs. The study suggests that banks should put in place a vibrant credit process that ensures proper customer selection and risk identification, robust credit analysis, proactive monitoring and clear recovery strategies for bad loans, formulate clear policy framework that addresses issues of ethical standards and check and balance credit process, organizational capacity enhancement of banks, deliberate effort to develop credit culture for managing loans ,and ensure prudent policies that govern bank loans. Since the results for this study were encouraging, the researcher encourages replicating the study for other lending institutions. In order to extend the literature on non-performing loans, the researcher suggested incorporating models of Golem effect, Social loafing, Inverted pyramid effect, Pollyanna effect and High default culture effect. Also, basing on the merits of the study, the researcher suggests determining relationship between non-performing loans and loan size, collateral, credit culture, and credit management information system.
Key words: Banking lending, Banks,Non Performing Loans.ALM In Banking. Economy and NPL’s JEL Classification: G210, G1.
71
1. Introduction
Bank can be described as a financial institution whose current operations consist of accepting deposits from the public and issuing loans. The receiving of deposits and provision of loans distinguishes ‘banks’ from other financial institutions. The term ‘banks’ includes commercial banks, merchant banks, finance houses, building societies, savingbanks, and credit unions (Saleem, 2005).
Banks play an important role in the economic development of a country. Borrowers and lenders have different liquidity preferences. Banks pool funds together and make them available for investments via issuing loans, thereby providing liquidity. Small business borrowers find bank lending important due to their small sizes and capacities. Finding funds through public markets is virtually impossible, because banks build relationships with customers that give them valuable information about their operations. Enhanced bank–customer relationship helps small business to access funding, because the bank has got special knowledge about the firm. In difficult times, for example, economic recession, firms with strong relationships with a bankstand a better chance to obtain financing to endure the recession. Banks administer payment systems which are core to an economy. Through payment systems, banks execute customers’ payment instructions by transferring funds between their accounts. The customer receives payment, and pays for the goods and services by:cheque, credit or debit card, or order fund to flow between individual’s retail business and wholesale markets quickly and safely. Banks are the transmission belt for monetary policy.
The BOT took over the role of EACB and replaced the Annual Finance and Credit Plan (AFCP) and the Foreign Exchange Plan (FEP) (Kimei, 1987; BOT, 1995). In 1967, during the Arusha Declaration all major economic activities including financial institutions and banks were nationalized. After the Arusha Declaration and before 1991, banks and financial institutionsstructural reforms and privatization exercise, all the commanding heights of the economy were controlled and owned by the government. In most cases, the government had 51percent majority share ownership and the government ownership representation was done through the Treasury Registrar. It was after the Arusha Declaration that many parastatal organizations were also established. The banks and financial institutions were also categorized as government parastatals. The Arusha declaration made the BOT to reorient its functions. The monetary instruments guided by market operations were suspended and replaced by the direct instruments (Ndulu, 1998; Noni, 1998 ).In order to solve some of the rural development industrial problems,the government through the BOT, established four special funds: the Rural Finance Fund, the Industrial Finance Fund, the Export Credit Guarantee Fund, and the Capital and Interest Subsidy Fund. Unfortunately, these funds did not achieve the intended results of controlling money supply and supporting rural development. Instead, they led to increased monetization of government deficit, increased financing to agricultural boards and state parastals which were frequently loan defaulters.The ultimate effect was the rapid growth in money supply which escalated the rate of inflation. Parallel to the establishment of BOT, thegovernment established financial institutions and banks. By the end of 1990, there were seven banks and financial institutions. Except for the Tanganyika Development Finance Limited (TDFL) and the Diamond Trust Bank (DTB), all other banks and financial institutions were owned by the government. Commercial banking was monopolized by the National Bank of Commerce (NBC ) for Tanzania mainland, and the Peoples Bank of Zanzibar (PBZ) for the Zanzibar Islands of Pemba and Unguja. Other banks such as the Tanzania Investment Bank (TIB), Tanzania Housing Bank (THB), Cooperative and Rural Development Bank (CRDB) and the Tanganyika Development Finance Ltd (TDFL) were specific parastatals and cooperative unions. Then in the year 1992 the Tanzania banking sector embarked on a plan for financial liberalization in order to sustain its economic growth. As a result of this liberalization, the banking sector in Tanzania has been booming, particularly over the last few years. The total assets have increased by 60 percent, from $1.7 billion at the end of 1999 to $2.7 billion at the end of June 2004. Consequently, new merchant banks, insurance companies, a stock exchange and related financial units have entered the market. With a total of twenty seven banks, and a few non-banking financial institutions, the market is characterized by a few big players and several small banks (Tsango,2007).
72
Over the years there has been an increase in the number of bank failures in both centralized and decentralized economies (The Economist,1992). In Africa, failures have been experienced in more than forty countries including Ghana, Kenya, BukinaFarso, Burundi, Cameroon, Congo, South Africa, Uganda, Tanzania etc( Kimei, 1998). Bank failures affect the customer in terms of relationships and its benefits (Ogema and Smith, 1998). Bank failures can lead to contraction of activity and decline in output in the economy. The effects and impacts sometimes go beyond the firm which has banking relations (Rajan, 1992, Grossman,1993). The impact of bank failure is larger if the failing bank is considered as “a Too Big to Fail Bank (TBTB), because it could trigger the collapse of the entire banking system or the economy as a whole. Considering the importance of the TBTB, it has been common for governments to intervene and bail out such failing banks (Chijoriga,1997).For example, in 1991, the Tanzania government was forced to save the National Bank of commerce (NBC), which was “ a Too Big to Fail Bank” by advancing it a sum of Tsh. 188,886,550,000/= ( about US$ 37 million) in the form of government bonds to cover its non – performing loans. Most banks in African countries which are facing problems have either been bailed out, closed up or restructured (Kimei,1998).Empirical evidence suggests that bank failures are due to external and internal factors. Included in the internal factors are: reckless lending, corruption, fraud and dishonest, embezzlement, management deficiencies, poor credit documentation, non- use of prudent credit classification, and risk assessment methods, lack of capital, low level of technology, lack of full information disclosures, concentration of ownership and lending to insiders, and poor supervision capacity. The causes of bank failures of the Meridian Bio Bank, Trust Bank and Green land Bank in Tanzania are considered to have been contributed more by internal factors. External factors such as poor monetary and fiscal policies, bank deregulation/ regulation policies and procedures, lack of information among bank customers, homogeneity of the banking business, and connections among banks do cause bank failures. For some developing Countries, globalization is also contributing to banks failures. The small and inexperienced banks fail to cope with stiff competition of the big multinational banks in terms of products and services offered. The failure of the NBC, and other government owned banks such as Tanzania Investment Bank (TIB), Tanzania Housing Bank (TBH), and cooperative and Rural Development Bank (CRDB) were due to both internal and external factors.
By 1991, NBC had large sums of non- performing loans which were due to financially distressed parastatals and cooperative unions. The NBC non- performing loans equaled to 70percent of the total bank non-performing loans. The remaining balance belonged to THB, TIB and CRDB banks. The high non – performing loans suffered by the government banks and other institutions had led to the restructuring of almost all banks including National Bank of Commerce (NBC) which had the largest (80%)commercial bank total portfolio. Also according to the World Bank report (2011) the ratio of non- performing loans to total gross loans for different countries are not encouraging. Table 1.1 below summarizes these results:
Table 1.1: Percentage of non-performing loans in different countries
Country 2000 2001 2002 2003 2004 2005 2006 2007 2008 % % % % % % % % % Argentina 16 13.1 18.1 17.7 10.7 5.2 3.4 2.7 2.7 China 22.4 29.8 26 20.4 13.2 8.6 7.1 6.2 2.4 Egypt 13.6 16.9 20.2 24.2 23.6 26.5 18.2 19.3 14.8 Ghana 11.9 19.6 22.7 18.3 16.3 13.0 7.9 6.4 7.7 Kenya 33.3 13.1 18.1 34.9 29.3 25.6 - 10.6 9.0 Nigeria 22.6 19.7 21.4 20.5 21.6 18.1 9.3 9.5 4.8 Morocco 17.5 16.8 17.2 18.7 19.4 15.7 10.9 7.9 0.3
73
Tunisia 21.6 19.2 21.4 24.2 23.6 20.9 19.3 17.6 15.5
Source: World Bank Report-2011
So looking at the above situation, therefore, this study attempts to ascertain determinants of loan repayment in banks in order to prevent banks from further getting hurt.
Granting of advances is the primary function of a bank. A major portion of its funds is used for this purpose, and this is also the major source of bank’s income.Butlending money is a risky business, so banks must take proper precautions in this process. While lending money, banks have to make sure that the borrower is in a position to repay the loan, along with interest, and according to the terms of the loan contract. The bank must also make sure that the borrower is able to repay the loan on demand, or within a short period of time.Banks have to employ their funds profitably so as to earn sufficient income. In order that banks may protect themselves, they have to follow the principle of diversification of risk. Banks must also have good loan policy. The loan policy of a bank must be definite and board-based so that credit officers may not face any problem in evaluating the credit worthiness of loan applicants. The lending policy should prescribe specific guidelines with respect to such items as: loan territory, types of loans to be made, acceptable securities, lending criteria, loan liquidation, loan commitment, and loan authority of credit officials. (Ritu, 2012).
However, the level of bad and doubtful debt provision of banks operating in Tanzania has increased significantly over the past few years in monetary terms and also as percentage of performing loans. The ratio of non-performing loans to total loans inyear 2007 was 6 percent, in year 2008 it was 6.5 percent, and in year 2009 it was 7 percent. (Mutarubkwa,2011). The possible causes of non- performing loans are both internal and external factors. Internal factors include reckless lending,corruption, fraud and dishonest, management deficiencies, poor credit documentation, non use of prudent credit classification and risk assessment methods, concentration of lending activities,poor supervision capacity etc. External factors include poor and sluggish monetary policies and procedures, bank deregulation /regulation policies, economic condition, GDP etc(Fama,1985).
One common feature about banking business is that, it is a homogenous type of business where products offered are almost similar except for the interest rates and quality of services. Thus due to the non- performing loans a bank can fail and this can trigger other banks to fail due to the relationship which exists between them. This happens because bank customers may think that their banks also have similar problems like the one in trouble, therefore, this may create fear in them and force them to withdraw their funds creating liquidity problems to the failing bank. Additionally, as the failing bank struggles to stay afloat it may call for its outstanding loans and refuse to make new loans. This may create what is known as a “credit crunch” and hence contribute to depression of the economy. Ireland, Greece, Spain, and Italy are all haunted by non –performing loans. Tanzania’s experience shows that many banks are suffering from non- performing loans. NBC is one bank which is facing this problem .According to NBC’s financial report (2012), the percentage of non- performing loans in year 2010 was 14 percent, and in year 2011, it was 16 percent. There is a need, therefore, to identify factors that hinderloan repaymentin banks, and this move will help prevent banks from furthergetting hurt.
2. Literature Review
2.1 Direct consequence of non-performing loans
Economic development will always be in its infancy if sufficient capital cannot be formed. Capital formation is basically the function of thrift organizations, like banks and other financial institutions, to motivate the households to save from their earnings. These savings should be utilized in economic processes. Economists have identified at least three broad reasons for saving; life cycle saving: Saving to meet long -term objectives such as retirement, college attendance, or for the purposes of a home; precautionary saving: savings for protecting against unexpected setbacks such as the loss of a job or a medical emergency; bequest saving: Saving done for the purpose of leaving
74
an inheritance. Along with household savings, there is another form of saving investment that basically comes from corporation. Savings can be held in different forms as: financial assets, stores of value, as well as informal financial assets such as savings in informal financial institutions. Getting the small savings from the households, financial institutions form large capital so that it can be invested in the development of various sectors like industry, business, development and others. When saving gets invested rightly it works for the economic development. But if money is wasted wrongly, then it does not work for economic development. So investments have both positive and negative consequences. If the invested funds can be captured timely, it can again form new capital creating a good option of reinvestment or consumption. Both these reinvestments and consumption functions create a positive impact on the economy, because economy gets some value added jobs to do. Apparently, it may seem that it’s good so far as economic development is concerned, as the money remains invested in the economic process. But the reality is that the funds may fail to achieve its ultimate target, it may be unutilized or underutilized or even in extreme case, the funds may flow out of the economy for example due to non-performing loans. Then the loss will be a total loss both to the investing authority and to the society as well. Thus it will lead the economy to be stagnant for the time being, and if not checked, forever. It will also acceralate the path of being and remaining poor for the time being. 2.2 The causes of Non-performing loans
Seven predominant models of non-performing loans focus on different causes. They are Risk premium, principal-agent problem, adverse selection, moral hazard, patronizing effect,Die another day effect, Petroski effect.
2.2.1 Risk Premium
This model which is recommended by Ewert, Schenk, (2000), proposes that financial decisions incur different degrees of risk. The “perceived credit risk” depends on a person’s judgment. Risk and expected return move in tandem; the greater the risk, the greater the expected return. Figure 2.3.1 below shows this risk- return relationship.
Figure 2.2.1: Risk- Return relationship
Source: I.M.Pandey,( 2004)
An investor assuming risk from his/her investment requires a risk premium above the risk –free rate. Risk –free rate is a compensation for time and risk premium for risk. The higher the risk of an action, the higher will be the risk of premium leading to higher required return on that action. So according to this theory, the corresponding risk should affect interest rate, that is, the higher the failure risk of the borrower, the higher the interest rate (Ewert, Schenk,Szczesny, 2000).
2.2.2 .The Principal -Agent problem
The idea underlying this model is that organization decision – taking authority lies in the hands of managers. Shareholders as owners of a company are the principals and managers are their agents. Thus there is a principal – agent relationship between shareholders and managers. In theory managers should act in the best interests of shareholders, that is, their actions and decisions should lead to shareholders wealth maximization (SWM). But in practice, managers may not necessarily act in the best interest of shareholders and they may pursue their own
Risk Premium
Risk – Free Return
Risk
Expected
return
75
personal goals. This problem arises because managers are motivated by self-interest. The root cause of this self – interest is jealousy. Managers work hard to make sure that companies become successful and make huge profit. But due to managers hard work only the shareholders become rich and not managers.
2.2.3. Adverse selection
The idea underlying this model is that borrowers do not always provide all the information required. Even if they do, not all information will be correct (Changeta, 2007). Borrowers generally have private (internal) information about their projects that is more accurate than the information possessed by lenders. As a consequence, a lender could still be uncertain about the default risk of a loan contract and have difficulties in assessing and controlling the nature and behavior of the borrower. The adverse selection problem occurs if lenders try to protect themselves against default risk by setting their contractual terms in a manner appropriate for the expected average quality of their loan applicants.
2.2.4 .Moral Hazard
This model proposes that borrowers who have internal information take hidden actions that increase their default probability. Therefore, moral hazard arises as a result of changes in the two parties incentives after entering into a contract such that the riskiness of the contract is altered (Chengeta, 2007).
2.2.5. Patronizing effect
This model proposes that there is a possibility lenders are unwilling to collect. Unwillingness may arise from several factors such as poor policies, procedures, structure, rewards, physical setting, etc. Such internal problems weaken management and motivate borrowers not to repay the loan, because they are confident that no serious action will be taken against them (Islam, Shil, Mannan, 2005).
2.2.6. Die another day effect
The idea underlying this model is that in our society, people give more importance on current consumption. So they do not mind spending the borrowed fund for consumption, if they are not strictly followed up. People hold a very short vision of thinking for today leading to sufferings tomorrow. So a significant portion of capital goes to unproductive sector that may be termed as die another day effect. So this means that if borrowers are not followed up, they get wrong perception about the management, that is, it is weak, so borrowers will squander the loan money unwisely. In brief, weak follow up weakens the system (Islam, Shil, Mannan, 2005).
2.2.7. Petroski Effect
In “To engineer is human; the role of failure in successful design”, Henry Petroski, a forensic civil engineer fascinated with failure of large structures notes that each new major bridge, for example, always has to be higher, longer, stronger or cheaper than the last bridge of similar design. Something that works tends to be the subject of attempts at replication and improvement in new environments. This means that risk increases and is always to some degree unknown as the low risk situations become saturated. The idea underlying this model is that when credit managers make different types of loans, for example business loans or personal loans, they expect the same characteristics to affect other types of loans. This kind of expectation increases risk (Islam, Shil, Mannan, 2005). Over the last few years the literature that examines poor loan has expanded in line with the interest afforded to understanding the factors that hinder loan repayment. This is because it is widely accepted that the percentage of loan losses is often associated with bank failures and financial crises in both developing and developed countries. Therefore, this section reviews existing literature so as to formulate a theoretical framework to investigate the determinants of loan repayments in NBC.
Keeton and Morris (1987) presented one of the earliest studies to examine causes of loan losses in commercial banks in USA. Their studies found evidence that economic condition, and poor performance of certain sectors were significant determinants of loan losses.
76
Sinkey and GreenWalt (1991), whose study examined the loan loss- experience of large commercial banks in USA, provided evidence that both internal and external factors explain the loan-loss rate (defined as net loan charge of plus NPLs divided by total loans plus net charge offs) of these banks. These authors found a significant positive relationship between the loan – loss rate and internal factors such as high interest rate, excessive lending , and volatile funds. Also in another related study Sinkey and Green Walt (1991) argued that depressed regional economic conditions explained the loss- rate in commercial banks.
Ewert, Schenk and Szczesny (2000) studied banks lending performance in Germany. Their study found evidence that high interest rate, and inadequate collateral had significant positive relationship on the banks poor lending performance.
Bercoff, Jose , Julian, Giovanni and Franque (2002) studied the fragility of the Argentinean banking system over the 1993-1996 period. They strongly suggested that non- performing loans are affected by both bank specific factors and macroeconomic factors.
From 1985 to 1997, Salas and Saurina (2002) studied determinants of problem loans of Spanish commercial and saving banks. Their study found out that real growth in GDP, rapid credit expansion, bank size, capital ratio and market power explained variations in non- performing loans .
Abafita (2003) studied problem loans at Oromai credit and savings share company in Kuyu. The author argued that education, loan size, loan diversion, availability of other credit sources, loan supervision, and suitability of loan were positively related to poor loan repayment performance.
Rajan and Dhal (2003) examined non- performing loans of public sector banks in India. They found evidence that favourable macro –economic conditions, and financial factors such as maturity cost and terms of credit, bank size and credit orientation are significant determinants of non- performing loans.
Fofack (2005) conducted a study on non-performing loans in sub Saharan Africa after which he concluded that economic growth, real exchange rate appreciation, the real interest rate, net interest margins, and inter-bank loans are significant determinants of non- performing loans in these countries. The author attributed strong association between the macroeconomic factors and non-performing loans to the undiversified nature of some African economies. Further, Jimenez and Saurina (2005) studied the Spanish banking sector from 1984 to 2003. They provided evidence that non- performing loans are determined by GDP growth, high interest rate and lenient credit terms.
Oladeebo and Oladeebo (2008) conducted research on factors affecting loan repayment among small holder farmers in Ogbomoso agricultural zone of Oyo state in Nigeria. They found evidence that amount of loan collected, age experience with credit usage, and level of education were major significant socio-economic factors determining loan repayment.
Aballey (2009) studied the causes of bad loans portfolio at African Development Bank. He found evidence that non-performing loans are positively correlated to ineffective monitoring of loans and poor credit appraisal. Further, Kangimba (2010) studied determinants of non- performing loans in Standard Charted Bank. He argued that long duration granted for repayment of loans, unwillingness of borrowers to pay back the loan, cheating in declaration of collateral, poor management, lack of business skills, and high competition are the reasons for non-performing loans.
Din’ohi (2011) who conducted research on factors that increased the level of non- performing loans at AKIBA commercial bank found out that poor practicing of credit policies, and procedure, unavailability of accurate information were positively related to non- performing loans.
Several studies which followed the publication of Din’ohi have proposed similar explanations for problematic loans in Tanzania. For instance Mwakoba (2011) studied determinants of non- performing loans at SACCOS,
77
and found strong association between non-performing loans and high interest rate, insufficient collateral and business problems. More recently Kwayu (2011) analyzed factors for non- repayment of bank loans at NBC Dodoma region. She argued that interest rate does not affect repayment of loans, but costs incurred during loans application are high. The attitudes of borrowers contributed to non-repayment of loans. Other reasons for poor repayment of loans were bad economic condition and high competition.
3.Methodology
This research was conducted at NBC Dodoma main branch , Tanzania. This is because NBC is situated in a region where conditions are ripe for banks to perform profitably because many houses are being constructed, and also more academic institutions and businesses are being established, therefore creating more demands for loans. But this increase in demand for loans has led to increase in percentage of non-performing loans. From year 2008 to 2012 many banks such as Barclays, DTB , NBC, and some other banks have opened new branches in Dodoma and creating a very competitive environment.
In this study cross- sectional survey design was adopted to know the determinants of non-performing loans at NBC. Generally, the design minimizes bias and maximizes the reliability of data to be collected because different data collection methods.
3.1.Sample size
According to Saleemi (2007), sample size is the number of observations for calculating estimates of a given population. Sample size was selected from customers and staffs of NBC Dodoma main branch. By using simple random sampling 140 customers were selected, and through judgmental sampling 12 bank staffs were selected. Experts (Krejcie and Morgan) have advised that the required sample size should consist of 152 respondents, that is , 60.9 percent of the total population if the confidence limit is set at 95 percent, and the margin of error is 5 percent , and if the population size is of 250 respondents.
The study used various methods to collect data from different respondents. These were interviews, questionnaires, and documentary evidence.Bank officers and customers were given questionnaires to fill in due to their understanding and experience on loans. Questionnaires for bank officers were classified into five sections.
The analysis was performed with SPSS V.17. Descriptive statistics was employed to analyze data and the results were tested with non-parametric tests of significance. Tables, percentages, mean, and standard deviation were used to analyze the questionnaire survey results.
3.2. Objectives of the study
The objective of the study is to determine factors hindering loan repayment in banks so as to prevent banks from getting into financial trouble (crisis).
3.3. Specific objectives
(i) To determine interest rate and GDP delay repayment of bank loans.
(ii) To verify concentration of lending activities hinder repayment of bank loans.
(iii) To establish economic condition obstructs to NPL’s.
3.4. Research questions
(i) In what way does interest rate and GDP obstruct repayment of bank loans?
(ii) How does concentration of lending activities hinder repayment of bank loans?
78
4. Empirical studyThe increase in the level of NPLs in banks is directly related to bank failures. Therefore, determining factors that increase the level of NPLs will enable to identify factors that hinder loan repayment in commercial banks. The existing literature provides evidence that suggests a strong association between NPLs and several macroeconomic factors. Several macroeconomic factors which the literature proposes as important determinants are: economic condition, GDP, interest rate , country risk etc. Because it is impossible to examine them all in the time frame provided for the researcher, this study will consider a subset of more important variables which are: GDP and economic condition.
4.1. GDP
There is significant empirical evidence of a negative relationship between growth in GDP and NPLs (Salas and Suarina, 2002, Rajan& Dhal, 2003, Jimenez and Saurina, 2005 and Fofack,2005). The explanation provided by the literature for this relationship is that strong positive growth in GDP usually translates into more income which improves the debt serving capacity of borrower which in turn contributes to lower non- performing loans.
4.2. Economic condition
The literature also provides evidence of a negative relationship between economic condition and NPLs (Keeton and Morris, 1987, Sinkey and Greenwalt , 1991, and Kwayu, 2011). The explanation provided by the literature for this relationship is that when the economy is expanding this translates into people spending more money, which stimulates the production of goods and services which in turn stimulates employment.
4.3. Interest rate
The impact of interest rates on NPLs is extensively documented in the literature.In fact several studies report that high interest rate and non- performing loans are positively related (Sinkey and Greenwalt , 1999 , Ewert, schenk and Szczesny, 2000 , Fofack, 2008, Jimenez and Saurina ,2005, Mwakoba, 2011). The explanation provided by the literature is that banks charge high interest rates when they perceive higher risk of default. This situation attracts bad borrowers to borrow, therefore, increasing chances of loan default. Conversely, banks charge low interest rate when they perceive low risk of default. This causes more borrowers to borrow money from banks. 4.4. Concentration of lending activities
There is also evidence in the literature of a positive association between NPLs and concentration of lending activities (Abafita ,2003 ). The explanation provided by the literature for this relationship is that common characteristics become a common source of weakness for the loans in concentration, therefore, the loans pose considerable risk to earnings and capital.
4.5. Bank’s loan supervision capacity
The impact of bank’s loan supervision capacity on NPLs is extensively documented in the literature. In fact, several studies report that bank’s loan supervision capacity is positively related to NPLs (Abafita, 2003, Aballey; 2009, Kagimba ;2010). According to these studies the relationship means that a good supervision capacity contributes to lower non- performing loans and bad supervision capacity increases non- performing loans.
79
5. Application of the Model
5.1. This section presents and analyses questions answered by NBC Bank customers.
5.1.Socio-Demographic Background
Table 5.1: Age of Respondents
Age Frequency Percentage
25-35 38 27.1
36-45 25 17.9
46-55 52 37.1
56-65 25 17.9
Total 140 100.0
Source: Research Data, 2013
The above table shows that majority of the respondents were between the age of 46-55, that is 37.1 percent, then followed by respondents aged between 25-35, that is, 27.1 percent, then followed by respondents aged between 36-45 and 56-65, that is,17.9 percent, and finally followed by respondents who are less than 25 years and over 65 years that is, 0 percent. The results indicate that majority of the respondents for the studies wereaged between 46-55 years.
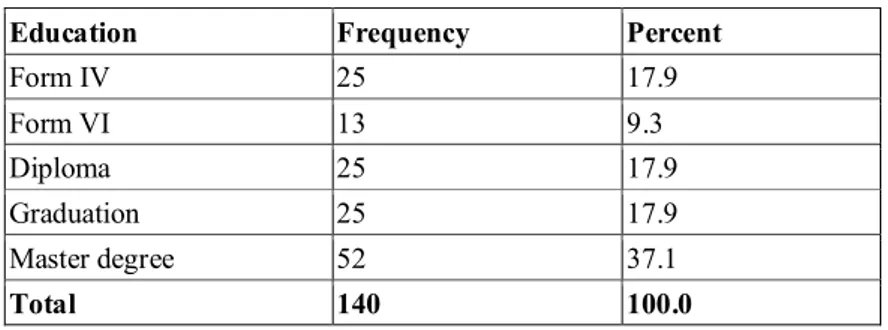
Table 5.1.1: Education of Respondents
Education Frequency Percent
Form IV 25 17.9 Form VI 13 9.3 Diploma 25 17.9 Graduation 25 17.9 Master degree 52 37.1 Total 140 100.0
Source: Research Data, 2013
The above table shows that majority of the respondents were those who had masters degree, that is, 37.1 percent, followed by those who had graduated, diploma and form IV certificate holders, that is,17.9 percent. The fact that majority of the respondents had high level of education helped the researcher to capture a good quality of data.
Table 5.1. 2: Gender of Respondents
Gender Frequency Percent
Male 127 90.7
Female 13 9.3
Total
140 100.0
80
The above table shows that majority of the respondents were males, that is, 90.7 percent, followed by females that is, 9.3 percent. Therefore, the results indicate that majority of respondents for the study wasmales. Next table presents and summarizes information with regard to marital status of the respondents.
Table 5.1.3: Marital Status
Marital Status Frequency Percent
Single 13 9.3
Married 114 81.4
Divorced 13 9.3
Total 140 100.0
Source: Research Data, 2013
The above table clearly shows that majority of the respondents were married, that is, 81.4 percent, followed by single and divorced respondents, that is, 9.3 percent and,finally widowed respondents, that is, 0 percent. Therefore, the results show that majority of the respondents for the study was married. Next table summarizes and presents information with regard to the employment status of the respondents.
Table 5.1.4: Currently in Paid Employment
Employment Frequency Percent
Currently in paid employment 63 45
Currently not in paid employment 77 55
Total 140 100
Source: Research Data, 2013
The above table shows that 55 percent of the respondents are not currently in paid employment, and 45 percent of the respondents are currently in paid employment. Therefore, the results indicate that majority of the respondents for the study was not in paid employment.
5.2 Loan Utilization
Table 5.2.1: Purpose of Loan
Purpose Frequency Percent
Agriculture - - Business 102 72.7 Education - - Housing - - Personal 38 27.3 Others - - Total 140 100
Source: Research Data, 2013
The above table shows that 72.7 percent of the respondents took loan for business purpose, and 27.3 percent for personal purpose. Therefore, the results show that majority of respondents took loans for business purpose. The
81
results also show that the bank does not provide agriculture, education and business loans. Therefore, the results indicate that the bank does not want to take unnecessary risks. Next table presents and summarizes information with regard to loan amount obtained was enough for the purpose intended.
Table 5.2.2: Loan Amount enough for the purpose Intended
Purpose intended Frequency Percent
Yes 89 63.6
No 51 36.4
Total 140 100
Source: Research Data, 2013
The above table clearly shows that 63.6 percent of respondents agree that loan amount was sufficient for the purpose for which they took, and 36.4 percent disagree that the loan amount was sufficient for the purpose for which they took. Therefore, the results indicate that majority of the respondents understand that the amount taken was enough for the purpose intended.
The respondents responses with regard to whether they spent the entire loan on the purpose specified in the loan agreement were that all respondents (100%) agreed that they spent their borrowed money for the specified purpose.
5.3 Loan and its repayment
The respondents responses with regard to the question Did you have any source of credit other than the one from NBC was that all respondents (100%) agreed they did not have any source of credit other than from NBC. Also, the respondent’s responses with regard to whether the repayment period set by NBC is suitable are summarized and presented in next table
Table 5.3.1: Repayment period
Repayment period suitable Frequency Percent
Yes 89 63.6
No 51 36.4
Source: Research Data, 2013
The above table shows that 63.6 percent of the respondents feel that the repayment period was suitable, and 36.4 percent feel that the repayment period was unsuitable. Therefore, the results show that majority of the respondents feel that the repayment period was suitable. Next table summarizes and presents information with regard to whether loans are issued timely.
Table 5.3.2: Loans issued timely
Loans issued timely Frequency Percent
Yes 51 36.4
No 89 63.6
Total 140 100
Source: Research Data, 2013
The above table clearly shows that 63.6 percent of the respondents perceived that the loans were not issued timely, and 36.4 percent of the respondents perceive that the loans were issued timely. Therefore, majority of the respondents were of the view that the loans were issued timely. The respondents responses with regard to status of recent loans are summarized and presented in the following table
82
Table 5.3.3: The status of recent loan
The status of recent loan Frequency Percent
Fully paid 64 45.5
Repayment in schedule 76 54.5
Repayment in arrears - -
Total 140 100
Source: Research Data, 2013
The above table shows that 45.5 percent of the respondents had repaid their loans, and 54.5 percent were in process of repaying the loans. Therefore, the results show that the majority of the respondents were still in the process of repaying their loans. Also the respondents responses with regard to interest charged are summarized and presented in next table.
Table 5.3.4: Interest rates
Interest rates are reasonable Frequency Percent
Yes 115 81.8
No 25 18.2
Total 140 100
Source: Research Data, 2013
The above table clearly shows that 81.8 percent of the respondents feel that the interests charged by this monetary institution are not reasonable, but 18.2 percent of the respondents feel that the interests charged by this monetary institution are reasonable. Therefore, the results show that majority of the respondents feel that interest charged by this institution is unreasonable. So the above result proves that interest rate affects repayment of loans, and it is positively related to non-performing loans.The respondent’s responses with regard to type of interest rates thatare imposed by the bank are summarized and presented in next table.
Table 5.3.5: Type of interest rate imposed by the bank
Type of interest rate imposed by bank Frequency Percent
Fixed rate 40 28.0
Current rate 25 18.0
Hybrid rate 75 54.0
Total 140 100
Source: Research Data, 2013
The above table shows clearly that 54.0 percent of the respondents perceive that the bank imposes hybrid rate, 28.0 percent of the respondents perceive that the bank imposes fixed rate, and 18.0 percent of the respondents perceive
83
that the bank imposes current rate. Therefore, the results show that majority of the respondents perceive that the bank imposes hybrid rate.
5.4 Other factors affecting loan repayment
Table 5.4.1: Other factors affecting loan repayment
Factors Strongly
Agree
Agree Neither Disagree Strongly
Disagree Total Respondents Bank size - 27.1% - 55% 17.9% 100% Concentration of lending activities - 33.6% 21.4% 29.3% 15.7% 100% Size and duration of loans 25% 50% 3.6% 21.4% - 100% GDP 25.7% 46.4% 17.9% 10% - 100% Economic growth in the country 35.7% 32.9% 31.4% - - 100% Economic condition 42.9% 32.1% 25% - - 100%
Source: Research Data, 2013
From the above result 75 percent of the respondents agree that economic condition affects repayment of loans. On the other hand 72.1 percent agree that GDP affects repayment of loans. With regard to concentration of lending activities, 45 percent of the respondents disagree that it affects repayment of loans. So the results suggest that economic condition and GDP are negatively related to non-performing loans. On the other hand, the results also suggest that concentration of lending activities is negatively related to non-performing loans.
5.5 Loan Supervision
Table 5.5.1: Supervised for loan repayment
Supervised for loan repayment Frequency Percent
Yes 13 9
No 127 91
Total 140 100
Source: Research Data, 2013
The table above clearly shows that 91 percent of the respondents say that they have not been supervised for loan repayment, but only 9 percent of the respondents say that they have been supervised for loan repayment. Therefore, the results show that the majority of the respondents have never been supervised for loan repayment. So the results prove that management is ineffective, it affects repayment of loans, and is positively related to non - performing
84
loans. Also, the respondents response to whether they have ever been supervised for loan utilization are summarized and presented in the following table.
Table 5.5.2: Supervised for loan utilization
Supervised for loan utilization Frequency Percent
Yes 13 9
No 127 91
Total 140 100
Source: Research Data, 2013
The above table clearly shows that 91 percent of the respondents say that they have not been supervised for loan utilization, but only 9 percent of the respondents say that they have been supervised for loan utilization. Therefore, the results show that majority of the respondent have never been supervised for loan utilization. So the result proves that management is ineffective and affects repayment of loans.
5.6. Presentation and analysis of questions answered by management and employees
Table 5. 6.1: Age of Respondents
Age Frequency Percent
25-35 8 66.7
35-45 3 25.0
46-55 1 8.3
Total 12 100.0
Source: Research Data, 2013
The above table shows that the respondents who were aged between 25-35 were 66.7 percent, followed by respondents who were aged between 36-45, that is, 25 percent, and then respondents aged between 46-55, that is, 8.3 percent. The results show that majority of the respondents for the study was aged between 25-35 years.The respondent’s response with regard to their education background are summarized and presented in the following table.
Table 5.6.2: Education of Respondents
Education Frequency Percent
Form IV 2 16.7
Form VI 4 33.3
Diploma 4 33.3
Graduation 2 16.7
Total 12 100.0
85
The above table shows that the respondents who had diploma’s and form VI certificate were 33.3percent, followed by respondents with bachelors degree and form IV certificates ,that is, 16.7percent. The results show that majority of the respondent for the study was those with form VI certificate and diploma. Also, the respondent’s response with regard to their gender are summarized and presented in the following table.
Table 5.6.3: Gender of Respondents
Gender Frequency Percent
Male 10 83.3
Female 2 16.7
Total 12 100.0
Source: Research Data, 2013
The above table shows that majority of the respondents were male, that is, 83.3 percent, and followed by females, that is, 16.7 percent. The results show that majority of the respondents for the study were male.
5.7 Loan Policies
Respondents had to provide information on loan policies. The respondents response with regard to risk associated with lending are summarized and presented in the following table.
Table 5.7.1: Risks associated with lending
Risks Frequency Percent
Collateral 6 50
Financial 4 33
Economy 2 17
Total 12 100
Source: Research Data, 2013
The table above shows that 50 percent of the respondents perceived collateral risk to be associated with lending. Also, 33 percent perceived financial risk, and 17 percent perceived economy risk. But no respondent perceived credit and interest rate risk to be associated with lending. Therefore, the results show that majority of the respondent view that collateral risk to be associated with lending. Next table summarizes and presents information with regard to factors considered before granting loans.
Table 5.7.2: Factors
Factor Ranking
The purpose for which the loan will be issued 4
The amount involved 5
The source of repayment 3
The type of account the customer operates 1
The earning power of the customers 2
The collateral security offered 6
86
The period of repayment 8
The customers referees 9
The present government policy on banking lending 10
Source: Research Data, 2013
The above table shows that type of account the customer operates was ranked first, followed by earning power of the customers and source of repayment. The purpose for loan was ranked fourth and collateral security offered was ranked sixth. The results show that type of account the customer operates, the earning power of the customer and source repayment are consider being important factors when granting loan.The respondent’s response with regard to types of loans they prefer are summarized and presented in the following table.
Table 5.7.3: Types of loan
Type of loan Frequency Percent Ranking
Business 8 66 1
Personal 4 34 2
Total 12 100
Source: Research Data, 2013
The above table shows that business was ranked first, that is, (66%) followed by personal, that is, (33%). The results show that the bank prefers to provide business and personal loans. Also, the respondents response with regard to evaluation of risk factor from an individual application are summarized and presented in the following table.
Table 5.7.4: Risk factor
Risk factor Ranking
Know your customer 1
Collateral offered 2
Account operates 3
Source: Research Data, 2013
The above table shows that knowing your customer was ranked first, followed by collateral offered and account operations. The results show that Know your customer is very important risk factor from an individual application, and then followed by Collateral offered and Account operates.
5.8 Repayment Policies
Respondents had to provide information on repayment policies.The respondent’sresponse with regard to policy for all the loans is same are summarized and presented in the following table.
Table 5.8.1: Policy for the loans
Policy for the loans same Frequency Percent
Yes - -
No 12 100
Total 12 100
87
The table above shows that all the respondents disagrees, meaning that policies are different for different type of loans. This proves that the policies are too broad, that means credit standards may be unclear and cannot provide meaningful guidance. No response was given for the question what are your institutions policies on bad debt management, but this shows that there are no policies or the bank officers are not aware of the policies on bad debt management. Therefore, this proves that the bank’s management is ineffective.The respondent’s response to the questionwhat is your concentration on non-repayment loans was that first they communicate with the customer then legal procedures are followed.The respondent’s response to the question Are the interest rates the same for all loans or different was that different interest rates are charged depending on loan facility. This indicates that interest charged depends on the “perceived judgment” of the credit officer; therefore this shows deficiency in management. 5.9 Non-performing loan policies
The respondents had to provide information on non-performing loan policies. The respondents response with to whether the institution has credit policy administration are summarized and presented in the below table.
Table 5.9.1: Credit policy administration
Credit policy administration Frequency Percent
Yes - -
No 12 12
Total 12 100
Source: Research Data, 2013
The above table shows that all the respondents disagree (100%), therefore the results show that the bank’s management is ineffective. The respondents response with to whether the institution has loan review system are summarized and presented in the below table.
Table 5.9.2: Loan review system
Loan review system Frequency Percent
Yes - -
No 12 100
Total 140 100
Source: Research Data, 2013
The above table shows that all the respondents disagree (100%), therefore the result show that the loan review system is weak. The respondents response to whether the institution has auditing committee on NPLs are summarized and presented in the below table.
Table 5.9.3: Auditing committee on NPLs
Auditing committee on NPLs Frequency Percent
Yes - -
No 12 100
Total 140 100
88
The above table shows that all the respondents disagree (100%); therefore the results show that the bank has no auditing committee on NPLs, so it shows clearly management is weak. No response was given to the question what measure you use to measure credit loss meaning that management is inefficient and ineffective. Also, the respondents response to whether the institution hascollection and work out units are presented in the below table.
Table 5.9.4: Workout and collection units
Workout and collection units Frequency Percent
Yes - -
No 12 100
Total 140 100
Source: Research Data, 2013
The above table shows that all the respondents disagree (100%), therefore the results show that the bank does not have collection and work out units in remote areas, therefore this shows management is weak. The respondents response with regard to whether NPLs affects profitability are summarized and presented in the below table.
Table 5.9.5: Non-performing loans affects profitability
NPLs affects profitability Frequency Percent
Yes 12 100
No - -
Total 140 100
Source: Research Data, 2013
The above table shows that all respondents agree (100%), therefore the results show that bank officers are aware of impact of NPLs. No response was given for the question what percentage of non-performing loans does your organization maintain? If it exceeds 5% then what type of control methods will you take? This shows that management and staffs are not aware, therefore providing proof that the bank’s management is inefficient.
5.10 Other factors affecting NPL
The study actually focused on economic condition, GDP and concentration of lending activities, because these factors increase the level of NPLs. The respondents were required to show their agreement and disagreement on these factors (Below table)
Table 5.10.1. Other factors affecting NPL
Factors Strongly
Agree
Agree Neither Disagree Strongly
Disagree Total Respondents Bank size - 33.3% 50% 16.7% - 100% Concentration of lending activities - 25% 16.7% 41.6% 16.7% 100%
Size and duration of loans - 25% 33.3% - 41.7% 100% GDP - 83.3% 16.7% - - 100% Economic growth in the - 66.6% 25% 8.4% - 100%
89
country Economic growth in the country 75% - 8.4% 16.6% - 100%Source: Research Data, 2013
From the above result 75 percent of the respondents agree that economic condition affects repayment of loans, and 83.3 percent of the respondents agree that GDP affects repayment of loans. On the other hand 58.3percent disagree that concentration of lending activities affects repayment of loans. So the results suggest that economic condition and GDP are negatively related to non-performing loans. On the other hand the results also suggest that concentration of lending activities is negatively related to non-performing loans. The following table shows customers agreement and disagreement on other factors affecting loan repayment.
Table 5.10.2:Other factors affecting NPL
Factors Strongly Agree Agr ee Neit her Disagr ee Strongly Disagree Total respondent Mean Standard deviation Bank size - 38 - 77 25 140 3.63 1.07 Concentration of lending activities - 47 30 41 22 140 3.27 1.09
Size and duration
of loans 35 70 5 30 - 140 2.21 1.04 GDP 36 65 25 14 - 140 2.12 0.90 Economic growth in the country 50 46 44 - - 140 1.95 0.82 Economic condition 60 45 35 - - 140 1.82 0.86
Source: Research data, 2013
Above tableshows management and employment and employee’s agreement and disagreement on other factors affecting NPL
Table 5.10.3: Other factors affecting NPL
Factors Strongly Agree Agree Neithe r Disagr ee Strongly Disagree Total responden ts Mea n Standard deviation Bank size - 4 6 2 - 12 2.83 0.68 Concentratio n of lending activities - 3 2 5 2 12 3.5 1.08 Size and duration of loans - 3 4 - 5 12 3.58 1.25 GDP - 10 2 - - 12 2.16 0.37 Economic growth in the country - 8 3 1 - 12 2.42 0.64 Economic condition 9 - 1 2 - 12 1.66 0.80
Source: Research data, 2013
Tables display the results for economic condition, GDP, and concentration of lending activities. Both customers (mean 1.82 and standard deviation 0.86), and bank officers (mean 1.66 and standard deviation 0.80) view that
90
economic condition affects repayment of loans. Also customers (mean 2.12 and standard deviation 0.90), and bank officers (mean and 2.16 and standard deviation 0.37) view that GDP affects repayment of loans. But both customers (mean 3.27 and standard deviation 1.09), and bank officers (mean 3.5 and standard deviation 1.08) view that concentration of lending activities does not affect repayment of bank loans. So the results suggest that economic condition and GDP are negatively related to non-performing loans. On the other hand, the results also suggest that concentration of lending activities is negatively related to non-performing loans.
5.11 Discussion
In this study descriptive statistics was employed to identify the determinants of NPL in NBC. Tablessummarize results for the study.The researcher found a positive association between interest rate and NPLs (Sinkey and Greenwalt, 1999, Ewert, Schenk and Szczesny, 2000, Fofack, 2005, Jimenez and Saurina, 2005, Mwakoba, 2011). This indicates that when a commercial bank increases its interest rate, this may translate immediately into higher non-performing loans. Results from the study reveal that banks charge high interest rate because they perceive higher risk of default. This situation attracts bad borrowers to borrow, thereby increasing chances of loan default.The results are consistent with combined models of Risk premium and Adverse selection. The researcher found negative relationship between GDP and NPLs (Salas and Suarina, 2002, Rajan and Dhal, 2003, Jimenez and Saurina, 2005 and, Fofack, 2005). This means that an improvement in GDP is likely to see an instantaneous reduction in NPLs. Results from the study indicate that a strong positive growth in GDP translates into more income which improves the debt serving capacity of borrowers which in turn contributes to lower NPLs.This situation causes bank managers to become overconfident about the health of the economy; therefore, such wrong perception tempts them to give cheaper loans to their customers, in exchange for some incentives. Such kind of temptation attracts bad borrowers thereby increasing the chances of loan default. The results are consistent with Principal – Agent problem model.
The researcher found negative relationship between concentration of lending activities and NPLs. The results suggest that common characteristics cannot become common source of weakness for the loans in concentration, therefore, can not pose risk to earnings and capital.In other words, common characteristics reduce the level of NPLs. The study is also inconsistent with previous study (Abafita, 2003) and Petroski effect model.
The researcher found a negative relationship between economic condition and NPLs (Keeton and Morris, 1987, Sinkey and Greenwalt, 1991,Kwayu, 2011). The results suggest that an improvement in economic condition is likely to see reduction in NPLs of commercial banks. This is because as economic condition improves, this translates into more income which improves debt servicing capacity of borrowers which in turn contributes to lower NPLs. This situation causes bank managers to become overconfident about the health of the economy; therefore, such wrong perception tempts them to give cheaper loans to their customers, in exchange for some incentives. Such kind of temptation attracts bad borrowers thereby increasing the chances of loan default. The results are consistent with Principal- Agent problem model.
The researcher found a positive relationship between bank’s loan supervision capacity and NPLs (Abafita, 2003, Aballey, 2009, Kangimba, 2010). The results suggest that supervision capacity is an important determinant of credit risk, that is, whenever there is ineffective management, the level of NPLs likely to increase. This is because a good supervision creates awareness in customers to utilize the loan properly, but bad supervision does not create awareness in customers to utilize the loan properly, therefore, increases the probability of loan default. The results are consistent with combined models of Moral hazard, Patronizing effect and Die another day effect. Table 5.11 below summarizes the pattern of results.
Table 5.11: Relationship between NPLs and its variables
91
GDP Negative
Economic condition Negative
Interest rate Positive
Concentration of lending activities Negative
Bank’s loan supervision capacity Positive
Source: Research Data, 2013
For interest rate, the study found positive relationship with NPLs. In addition, the results for interest rate were consistent with combined models of Risk premium and adverse selection models. This indicates that when a commercial bank increases its interest rate, this translates immediately into higher NPLs. Results from the study reveal that banks charge high interest rate because they perceive higher risk of default. This situation attracts bad borrowers to borrow thereby increasing the chances of loan default.
For GDP,the study found negative relationship with NPLs. In addition, the results for GDP were consistent with Principal-Agent problem model. This means that an improvement in GDP is likely to see reduction in NPLs. Results from the study indicate that a strong positive growth in GDP translates into more income which improves the debt serving capacity of borrowers which in turn contributes to lower NPLs.
For concentration of lending activities, the study found negative relationship with NPLs. In addition, the results for concentration of lending activities were inconsistent with Petroski effect model. The results suggest that common characteristics cannot become common source of weakness for loans in concentration, therefore, cannot pose risk to earnings and capital. In other words, common characteristics could reduce the level of NPLs.
For economic condition, the study found a negative relation with NPLs. In addition, the results for economic condition were consistent with Principal-Agent problem model. This means that an improvement in economic condition is likely to see reduction in NPLs. Results from the study indicate that a strong positive growth in the economy translates into more income which improves the debt serving capacity of borrowers which in turn contributes to lower NPLs.
For bank’s loan supervision capacity, the study found a positive relationship with NPLs. Additionally, the results for bank’s loan supervision capacity were consistent with combined models of Moral, Patronizing effect and Die another day effect. The results suggest supervision capacity is an important determinant of NPLs, that is, whenever there is ineffective management the level of NPLs is likely to increase.
6. Conclusion
The empirical results support the view that macro-factors such as: economic condition and GDP impact significantly on the level of non-performing loans. The study found a significant negative relationship between economic condition and non – performing loans. This means that strong performance in economy results into lower non-performing loans. The empirical results also revealed negative relationship between non-non-performing loans and GDP. With respect to the bank specific variable, the study found out that banks which charge relatively high interest rates tend to experience greater non-performing loans. This is evident from significant positive association between NPLs and interest rates. However, results show that concentration of lending activities is negatively associated with NPLs, which conflict with previous studies. The results of the study also show that bank’s loan supervision capacity impacts significantly on the level of NPLs. This means that a good loan supervision capacity results in lower non-performing loans and vice versa.
Based on the study findings, it means that commercial banks should pay attention to several factors when providing loans in order to curtail the level of NPLs. Specifically, commercial banks should constantly review the interest rates on loans since delinquencies are higher for banks which increase their interest rates. Commercial banks should also
92
take into consideration economic condition and GDP when making loans given the reality that during economic boom, managers may get tempted to make cheaper loans. Finally, the lending institutions should also take the banks supervision capacity into account when extending loans, since this may impair the ability of borrowers from repaying their loans which in turn would result in higher NPLs.
Lending money is the principal business activity for most commercial banks. But it is also one of the greatest sources of risk to the bank’s safety and prosperity. Whether due to lax credit standards, poor bank supervision, weakness in the economy, loan problems have historically been the major causes of bank losses and failures. Effective management of the loan is fundamental to a bank’s safety and soundness. Effective management of loan begins with:
(i) Oversight of the risk in individual loans. Prudent risk in selections is vital to maintaining favorable loan quality. To mange loans properly, bankers must understand not only the risk posed by each credit but also how the risks of individual loans and portfolios are interrelated.
(ii) Understanding the credit culture and the risk profile of the banks is central to successful loan management. Because of the significance of a bank’s lending activities, the influence of the credit culture frequently extends to other banks activities. Staff members throughout the bank should understand the bank’s credit culture and risk profile. The knowledge should pass from chief credit policy officer to account officers to administrative support. Directors and senior management officers should not only publicly endorse the credit standards that are a credit culture’s backbone, but should also employ them when formulating strategic plans overseeing portfolio management.
(iii) Consistently successful banks achieve a balance between asset quality, growth and earnings. They have cultural values, credit policies and processes that reinforce each other and that are clearly communicated, well understood, and carefully followed. The culture, risk profile and credit practices of a bank should be linked. If the credit practices and risk taking activities of a bank are inconsistent with the desired culture and policies, management should find out why and initiate change to bring them back in balance. Senior management and the board should periodically evaluate the bank’s credit culture and risk profile. Because the credit culture influences every aspect of the credit process, management should regularly confirm that the culture is consistent with the desired appetite for risk. Independent audit and internal loan review functions should help with this assessment.
REFERENCES
Abafita,J. (2003).Micro Finance and Loan Repayment Performance: A case study of theOromia credit and savings share Company in Kuyu, MBA thesis, University of South Africa.
Aballey, F.B. (2009).Bad Loans Portfolio: A case of ADB,MBA Dissertation, University of Pretoria.
Baking and Financial Institutions Act (2008), United Republic of Tanzania.
Bank of Tanzania (1995), Its functions and Monetary Policy Instruments, United Republic of Tanzania.
Bercoff, Jose. J., Julian di, Govanni and Franque, Grimard (2002), Argentinean Banks, Credit Growth and the Lequila Crisis: A Duration Analysis.
Business Dictionary (2013), (http://www.BusinessDictionary.com),site visited on 8/04/2013.
Chengeta,R(2007), Importance of banks in an economy,(