AN ANALYSIS AND EVALUATION OF AUDIO FEATURES FOR
MULTITRACK MUSIC MIXTURES
Brecht De Man
1, Brett Leonard
2, 3, Richard King
2, 3, Joshua D. Reiss
1 1Centre for Digital Music, Queen Mary University of London
2
The Graduate Program in Sound Recording, Schulich School of Music, McGill University
3Centre for Interdisciplinary Research in Music Media and Technology
b.deman@qmul.ac.uk
,
brett.leonard@mail.mcgill.ca
,
richard.king@mcgill.ca
,
joshua.reiss@qmul.ac.uk
ABSTRACT
Mixing multitrack music is an expert task where charac-teristics of the individual elements and their sum are ma-nipulated in terms of balance, timbre and positioning, to resolve technical issues and to meet the creative vision of the artist or engineer. In this paper we conduct a mixing experiment where eight songs are each mixed by eight dif-ferent engineers. We consider a range of features describ-ing the dynamic, spatial and spectral characteristics of each track, and perform a multidimensional analysis of variance to assess whether the instrument, song and/or engineer is the determining factor that explains the resulting variance, trend, or consistency in mixing methodology. A number of assumed mixing rules from literature are discussed in the light of this data, and implications regarding the automa-tion of various mixing processes are explored. Part of the data used in this work is published in a new online mul-titrack dataset through which public domain recordings, mixes, and mix settings (DAW projects) can be shared.
1. INTRODUCTION
The production of recorded music involves a range of ex-pert signal processing techniques applied to recorded mu-sical material. Each instrument or element thereof exists on a separate audio ‘track’, and this process of manipulat-ing and combinmanipulat-ing these tracks is normally referred to as mixing. Strictly creative processes aside, each process can generally be classified as manipulating the dynamic (bal-ance and dynamic range compression), spatial (stereo or surround panning and reverberation), and spectral (equal-isation) features of the source material, or a combination thereof [1, 4, 8, 15].
Recent years have seen a steep increase in research on automatic mixing, where some of the tedious, routine tasks in audio production are automated to the benefit of the in-experienced amateur or the time constrained professional.
c
Brecht De Man, Brett Leonard, Richard King and Joshua D. Reiss.
Licensed under a Creative Commons Attribution 4.0 International Li-cense (CC BY 4.0). Attribution: Brecht De Man, Brett Leonard, Richard King and Joshua D. Reiss. “An Analysis and Evaluation of Au-dio Features for Multitrack Music Mixtures”, 15th International Society for Music Information Retrieval Conference, 2014.
Most research is concerned with the validation of a mixing rule based on knowledge derived from practical literature or expert interviews [2, 6, 7, 9], usually through an exper-iment where a method based on this assumption is com-pared to a set of alternative methods. Furthermore, some research has been done on machine learning systems for balancing and panning of tracks [13]. In spite of these ef-forts, the relation between the characteristics of the source material and the chosen processing parameters, as well as the importance of subjective input of the individual ver-sus objective or generally accepted target features, is still poorly understood. Recurring challenges in this field in-clude a lack of research data, such as high-quality mixes in a realistic but sufficiently controlled setting, and tackling the inherently high cross-adaptivity of the mixing problem, as the value of each processing parameter for any given track is usually dependent on features and chosen process-ing parameters associated with other tracks as well.
In this work, we conduct an experiment where a group of mixing engineers mix the same material in a realistic setting, with relatively few constraints, and analyse the ma-nipulation of the signals and their features. We test the validity of the signal-dependent, instrument-independent model that is often used in automatic mixing research [6, 7], and try to identify which types of processing are largely dependent on instrument type, the song (or source mate-rial), or the individual mixing engineer. Consequently, we also identify which types of processing are not clearly de-fined as a function of these parameters, and thus warrant further research to understand their relation to low-level (readily extracted) features or high-level properties (instru-ment, genre, desired effect) of the source audio. We dis-cuss the relevance of a number of audio features for the assessment of music production and the underlying pro-cesses as described above. This experiment also provides an opportunity to validate some of the most common as-sumptions in autonomous mixing research.
2. EXPERIMENT
The mixing engineers in this experiment were students of the MMus in Sound Recording at the Schulich School of Music at McGill University. They were divided in two groups of eight, where each group corresponds with a class
from a different year in the two-year programme, and each group was assigned a different set of four songs to mix. Each mixing engineer allocated up to 6 hours to each of their four mix assignments, and was allowed to use Avid’s Pro Tools including built-in effects (with automation) and the Lexicon PCM Native Reverb Plug-In Bundle, a set of tools they were familiar with.
Four out of eight songs are available on a new multi-track testbed including raw multi-tracks, the rendered mixes and the complete Pro Tools project files, allowing others to re-produce or extend the research. The testbed can be found onc4dm.eecs.qmul.ac.uk/multitrack. The au-thors welcome all appropriately licensed contributions con-sisting of shareable raw, multitrack audio, DAW project files, rendered mixes, or a subset thereof. Due to copyright restrictions, the other songs could not be shared.
We consider three types of instruments - drums, bass, and lead vocal - as they are featured in all test songs in this research, and as they are common elements in contempo-rary music in general. Furthermore, we split up the drums in the elements kick drum, snare drum, and ‘rest’. Three out of eight songs had a male lead vocalist, and half of the songs featured a double bass (in one case part bowed) while the other half had a bass guitar for the bass part.
For the purpose of this investigation, we consider a frag-ment of the song only, consisting of the second verse and chorus, as all considered sources (drums, bass and lead vo-cal) are active here.
Whereas the audio was recorded and mixed at a sam-pling ratio of 96 kHz, we converted all audio to 44.1 kHz to reduce computational cost and to calculate spectral fea-tures based on the mostly audible region. The processed tracks are rendered from the digital audio workstation with all other tracks inactive, but with an unchanged signal path including send effects and bus processing1.
3. FEATURES
The set of features we consider (Table 1) has been tailored to reflect properties relevant to the production of music in the dynamic, spatial and spectral domain. We consider the mean of the feature over all frames of a track fragment.
We use the perceptually informed measure of loudness relative to the loudness of the mix, as a simple RMS level can be strongly influenced by high energy at frequencies the human ear is not very sensitive to. To accurately mea-sure loudness in the context of multitrack content, we use the highest performing modification in [12] (i.e. using a time constant of 280ms and a pre filter gain of+10dB) on the most recent ITU standard on measuring audio pro-gramme loudness [3].
1When disabling the other tracks, non-linear processes on groups of tracks (such as bus dynamic range compression) will result in a different effective effect on the rendered track since the processor may be trig-gered differently (such as a reduced trigger level). While for the purpose of this experiment, the difference in triggering of bus compression does not affect the considered features significantly, it should be noted that for rigorous extraction of processed tracks, in such a manner that when summed together they result in the final mix, the true, time-varying bus compression gain should be measured and applied on the single tracks.
Category Feature Reference
Dynamic Loudness [3, 12]
Crest factor (100 ms and 1 s) [17]
Activity [7] Spatial SPS [16] P[band] [16] Side/mid ratio Left/right imbalance Spectral Centroid [5] Brightness Spread Skewness Kurtosis · Rolloff (.95 and .85) · Entropy Flatness Roughness Irregularity Zero-crossing rate Low energy [5]
Octave band energies
Table 1: List of extracted features
To reflect the properties of the signal related to dynamic range on the short term, we calculate the crest factor over a window of 100 ms and over a window of 1 s [17].
To quantify gating, muting, and other effects that make the track (in)audible during processing, we measure the percentage of time the track is active, with the activity state indicated by a Schmitt trigger with thresholds at−25and
−30dB LUFS [7].
To analyse the spatial processing, we use the Stereo Panning Spectrum (SPS), which shows the spatial position of a certain frequency bin in function of time, and the Pan-ning Root Mean Square (P[band]), the RMS of the SPS over
a number of frequency bins [16]. In this work, we use the absolute value of SPS, averaged over time, and the stan-dardPtotal (all bins), Plow (0-250 Hz), Pmid (250-2500
Hz) andPhigh(2500-22050 Hz), also averaged over time.
Furthermore, we propose a simple stereo width measure, the side/mid ratio, calculated as the power of side chan-nel (sum of left and right chanchan-nel) over the power of the mid channel (average of left channel and polarity-reversed right channel). We also define the left/right imbalance, as (R−L)/(R+L)whereLis the total/average power of the left channel, andR is the total/average power of the right channel. A centred track has low imbalance and low side/mid ratio, while a hard panned track has high imbal-ance and high side/mid ratio. Note that while these features are related, they do not mean the same thing. A source could have uncorrelated signals with the exact same energy in the left and right channel respectively, which would lead to a low left/right imbalance and a high side/mid ratio.
Finally, we use features included in the MIR Toolbox [5] (with the default 50 ms window length) as well as oc-tave band energies to describe the spectral characteristics of the audio.
4. ANALYSIS AND DISCUSSION 4.1 Analysis of variance
Table 2 shows the mean values of the features, as well as the standard deviation between different mixing engineers and the standard deviation between different songs. Most considered features show greater variance for the same en-gineer across different songs, than for the same song over different engineers. Exceptions to this are the left/right im-balance and spectral roughness, which on average appear to be more dependent on the engineer than on the source content. The change of features (difference before and af-ter processing, where applicable) varies more for differ-ent mixing engineers than for differdiffer-ent songs, too, for all features. However, when considering the features instru-ment by instruinstru-ment, the source material only rarely causes the means of the feature to differ significantly (the means are only significantly different through the effect of source material for the zero-crossing rate of the snare drum track, and for the spectral entropy of the vocal track). This sug-gests that engineers would disagree on processing values, whereas the source material has less effect.
For each feature, we perform an analysis of variance to investigate for which feature we can reject the hypothe-sis that the different ‘treatments’ (different source material, mixing engineer or instrument) result in the same feature value. For those features for which there is a significant ef-fect (p <0.05), we perform a multiple comparison of pop-ulation means using the Bonferroni correction to establish what the mean values of the feature are as a function of the determining factor, and which instruments or songs have a significantly lower or higher mean than others. We discuss the outcome of these tests in the following paragraphs.
As some elements were not used by the mixing engi-neer, some missing values are dropped when calculating the statistics in the following sections.
4.2 Balance and dynamics processing
In general, the relative loudness of tracks, averaged over all instruments, is dependent on the song (p <5·10−11).
However, when looking at each instrument individually, the relative loudness of the bass guitar (p < 0.01), snare drum (p < 0.05) and other drum instruments (‘rest’, i.e. not snare or kick drum, p < 5 ·10−4) is dependent on
mixing engineer.
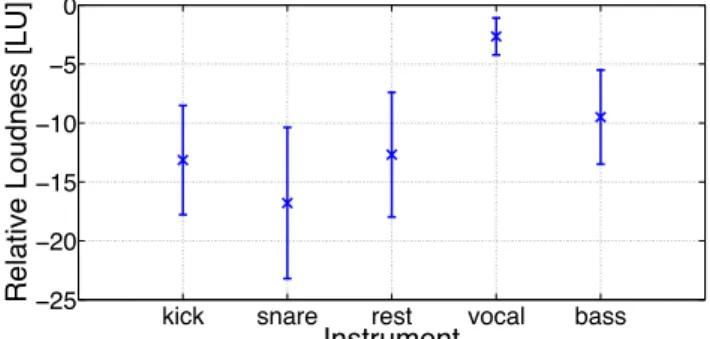
In automatic mixing research, a popular assumption is that the loudness of the different tracks or sources should be equal [7]. A possible exception to this is the main ele-ment, usually the vocal, which can be set at a higher loud-ness [1]. From Figure 1, it is apparent that the vocal is sig-nificantly louder than the other elements considered here, whereas no significant difference of the mean relative loud-ness of the other elements can be shown. Furthermore, the relative loudness of the vocal shows a relative narrow range of values (−2.7±1.6LU), suggesting an agreement on a ‘target loudness’ of about−3LU relative to the overall mix loudness.
It should be noted that due to crosstalk between the drum microphones, the effective loudness of the snare drum
kick snare rest vocal bass
−25 −20 −15 −10 −5 0
Relative Loudness [LU]
Instrument
Figure 1: Average and standard deviation of loudness of
sources relative to the total loudness of the mix, across songs and mixing engineers.
and kick drum will differ from the loudness measured from the snare drum and kick drum tracks. As a result, dis-agreement of the relative loudnesses of snare drum and other drum elements such as overhead and room micro-phones does not necessarily suggest a significantly differ-ent desired loudness of the snare drum, as the snare drum is present in both of these tracks. In this work, however, we are interested in the manipulations of the different tracks as they are available to the engineer.
The crest factor is affected by both the instrument (p <
5·10−3) and song (p < 10−20), and every instrument
in-dividually shows significantly different crest factor values for different engineers (p < 5·10−3). One exception to
the latter is the kick drum for a crest factor window size of 1 s, where the hypothesis was not disproved for one group of engineers.
All instruments show an increase in crest factor com-pared to the raw values (ratio significantly greater than one). This means that the short-term dynamic range is effectively expanded, which can be an effect of dynamic range compression as transients are left unattenuated due to the response time of the compressor, while the rest of the signal is reduced in level.
The percentage of the time the track was active did not meaningfully change under the influence of different source material, individual mixing engineers or instruments. A drop in activity in some instances is due to gating of kick drum, but this is the decision of certain mixing engineers for certain songs, and no consistent trend.
4.3 Stereo panning
Both the average left/right imbalance and average side/mid ratio were significantly higher for the non-pop/rock songs (p <10−6).
The Panning Root Mean Square valuesP[band]all show
a larger value for the total mix and for the ‘rest’ group. The difference is significant except for the lowest band, where only the bass is significantly more central than the total mix. This can be explained by noting that most of the low frequency sources are panned centre (see further).
In literature on automatic mixing and mixing engineer-ing textbooks, it is stated that low-frequency sources as well as lead vocals and snare drums should be panned cen-tral [1, 2, 4, 6, 8–10, 14]. To quantify the spatialisation for different frequencies, we display the panning as a function
Feature Kick drum Snare drum Rest drums Bass Lead vocal Average Mix Loudness [LU] -13.15±4.05 3.89 -16.78 ± 6.17 4.57 -12.68 ± 5.46 2.80 -2.65 ± 1.52 1.31 -9.50 ± 3.51 2.86 -10.95 ± 4.14 3.09 N/A Crest (100 ms) 3.599 ±00..603330 4.968 ± 0.998 0.469 4.510 ± 1.065 0.354 2.565 ± 0.443 0.166 3.315 ± 0.403 0.208 3.791 ± 0.634 0.274 3.332 ± 0.294 0.116 Crest (1 s) 9.824 ±3.074 1.911 16.724± 6.458 3.135 12.472 ± 4.710 1.823 4.339 ± 1.098 0.449 5.283 ± 1.102 0.514 9.728 ± 2.907 1.398 5.315 ± 0.997 0.554 Activity 0.676 ±0.250 0.122 0.861 ± 0.161 0.078 0.909 ± 0.115 0.029 0.958 ± 0.076 0.009 0.844 ± 0.089 0.044 0.850 ± 0.117 0.048 0.995 ± 0.009 0.004 L/R imbalance 0.075±0.094 0.137 0.144 ± 0.153 0.227 0.361 ± 0.303 0.213 0.107 ± 0.135 0.176 0.045 ± 0.072 0.085 0.146 ± 0.139 0.152 0.088 ± 0.075 0.074 Side/mid ratio 0.036±0.055 0.076 0.036 ± 0.040 0.043 0.242 ± 0.183 0.154 0.009 ± 0.013 0.015 0.022 ± 0.018 0.022 0.069 ± 0.060 0.059 0.101 ± 0.049 0.046 Ptotal 0.104 ±00..102090 0.108 ± 0.082 0.059 0.307 ± 0.028 0.027 0.075 ± 0.093 0.083 0.134 ± 0.022 0.027 0.145 ± 0.060 0.052 0.234 ± 0.030 0.027 Plow 0.066±0.078 0.087 0.122 ± 0.102 0.073 0.243 ± 0.045 0.041 0.040 ± 0.063 0.059 0.147 ± 0.034 0.042 0.123 ± 0.061 0.056 0.188 ± 0.042 0.034 Pmid 0.066±0.074 0.076 0.114 ± 0.090 0.064 0.290 ± 0.023 0.023 0.052 ± 0.082 0.067 0.177 ± 0.027 0.035 0.140 ± 0.054 0.048 0.248 ± 0.027 0.023 Phigh 0.106 ±0.104 0.091 0.105 ± 0.081 0.058 0.309 ± 0.029 0.028 0.076 ± 0.094 0.085 0.124 ± 0.022 0.028 0.144 ± 0.061 0.053 0.231 ± 0.033 0.029 Centroid [Hz] 2253.8±1065.6 729.8 4395.3± 1448.6 554.2 4130.8 ± 1228.1 483.2 1046.5± 520.1 232.4 2920.2± 452.1 264.7 2949.3± 872.1 418.6 2478.8 ± 517.9 247.1 Brightness 0.306 ±00..105103 0.598 ± 0.156 0.069 0.557 ± 0.115 0.058 0.135 ± 0.082 0.031 0.455 ± 0.071 0.040 0.410 ± 0.100 0.056 0.362 ± 0.070 0.034 Spread 3250.1±783.2 447.5 4363.6± 701.9 335.9 4422.1 ± 734.6 292.3 2426.6± 559.2 320.4 3369.9± 324.6 191.3 3566.5± 587.5 298.0 3453.2 ± 421.7 200.6 Skewness 3.649 ±1.068 0.886 1.492 ± 0.663 0.301 1.665 ± 0.682 0.246 6.234 ± 1.885 0.630 2.470 ± 0.573 0.243 3.102 ± 0.912 0.427 2.779 ± 0.600 0.257 Kurtosis 23.847±11.997 9.164 5.965 ± 2.905 1.474 7.053 ± 3.449 1.263 58.870± 31.874 11.107 11.579± 4.267 1.784 21.463± 9.834 4.477 13.646 ± 4.511 2.073 Rolloff .95 [Hz] 8880.1±3679.2 2151.2 13450.9± 3100.6 1582.2 13373.4± 2594.1 1007.4 4389.4± 2714.7 1244.5 9879.0± 1335.7 725.3 9994.5± 2498.0 1240.8 9679.0 ± 1563.8 734.3 Rolloff .85 [Hz] 4513.7±27361788..68 8984.3± 3139.7 1348.5 8755.3 ± 2742.5 975.6 1625.5± 1205.0 594.3 5595.8± 1121.4 609.7 5894.9± 2047.2 986.1 5026.2 ± 1337.8 599.8 Entropy 0.655 ±0.104 0.090 0.840 ± 0.084 0.057 0.832 ± 0.051 0.025 0.552 ± 0.073 0.026 0.735 ± 0.043 0.016 0.723 ± 0.066 0.038 0.744 ± 0.043 0.015 Flatness 0.148 ±0.072 0.051 0.350 ± 0.142 0.056 0.337 ± 0.118 0.045 0.073 ± 0.035 0.020 0.167 ± 0.030 0.018 0.215 ± 0.074 0.035 0.174 ± 0.046 0.020 Roughness 84.72±84.85 98.32 36.30 ± 41.16 43.32 67.57 ± 71.76 46.28 236.04± 160.38 176.05 247.00± 216.15 247.36 134.33± 319.30 338.44 1843.31± 1341.50 1419.35 Irregularity 0.158 ±0.098 0.063 0.235 ± 0.151 0.079 0.297 ± 0.135 0.069 0.502 ± 0.176 0.065 0.540 ± 0.165 0.094 0.346 ± 0.136 0.075 0.705 ± 0.090 0.078 Zero-crossing 584.7 ±509409..54 2222.0± 1183.3 604.7 1988.9 ± 944.1 466.1 246.6 ± 217.8 89.6 1177.5± 233.7 143.6 1243.9± 554.3 305.4 905.2 ± 237.4 118.8 Low energy 0.752 ±0.113 0.081 0.723 ± 0.084 0.055 0.682 ± 0.047 0.034 0.507 ± 0.096 0.033 0.544 ± 0.065 0.048 0.641 ± 0.073 0.048 0.541 ± 0.035 0.038 Figure 1: default 1
Table 2: Average values of features per instrument, including average over instrument and value of total mix, with standard
deviation between different songs by the same mixing engineer (top), and between different mixes of the same song (bot-tom). Values for which the variation across different mixes for the same song is greater than the variation across different songs for the same engineer are displayed in bold.
102 103 104 0 0.05 0.1 0.15 0.2 Frequency [Hz] Average SPS
Figure 2: Mean Stereo Panning Spectrum (with standard
deviation) over all mixes and songs
of frequency in Figure 2, using the average Stereo Panning Spectrum over all mixes and songs. From this figure a clear increase in SPS with increasing frequency is apparent be-tween 50 Hz and 400 Hz. However, this trend does not extend to the very low frequencies (20-50 Hz) or higher frequencies (>400 Hz).
4.4 Equalisation
To assess the spectral processing of sources, mostly equali-sation in this context, we consider both the absolute values of the spectral features (showing the desired features of the processed audio) as well as the change in features (show-ing common manipulations of the tracks). When only
tak-ing the manipulations into account, and not the features of the source audio, similar to blindly applying a software equaliser’s presets, the results would be less translatable to situations where the source material’s spectral charac-teristics differs from that featured in this work [2]. How-ever, considering the change in features could reveal com-mon practices that are less dependent on the features of the source material. Therefore, we investigate both.
The spectral centroid of the whole mix varies strongly depending on the mixing engineer (p < 5·10−6). The
centroid of the snare drum track is consistently increased through processing, due to a reduction of the low energy content as well as spill of instruments like kick drum (see further regarding the reduction of low energy) and/or the emphasis of a frequency range above the original centroid. The brightness of each track except bass guitar and kick drum (the sources with the highest amount of low energy) is increased.
For a large set of spectral features (spectral centroid, brightness, skewness, roll-off, flatness, zero-crossing, and roughness), the engineers disagree on the preferred value for all instruments except kick drum. In other words, the values describing the spectrum of a kick drum across engi-neers are overlapping, implying a consistent spectral target (a certain range of appropriate values). For other features
(spread, kurtosis and irregularity) the value correspond-ing with the kick drum track is also significantly different across engineers. The roughness shows no significantly different means for any instrument except the ‘rest’ bus.
The low energy of each track is reduced for each in-strument, with significantly more reduction for snare drum than for kick drum and bass guitar. Its absolute value for bass and vocal is significantly different across engineers, whereas there is a general overlap for all other instruments including the mix. As the variation in the resulting value of low energy is higher than the variation for the unprocessed versions, no target value is apparent for any instrument, nor for the total mix.
Analysis of the octave band energies reveals definite trends across songs and mixing engineers, for a certain in-strument as well as the mix. The standard deviation does not consistently decrease or increase over the octave bands for any instrument when compared to the raw audio. The suggested ‘mix target spectrum’ is in agreement with [11], which derived a ‘target spectrum’ based on average spec-tra of number one hits from various genres and over sev-eral decades. Figure 4 shows the measured average mix spectrum against the octave band values of the average spectrum of a number one hit after 2000 from that work, which lies within a standard deviation from our result with the exception of the highest band. The average relative change in energies is not significantly different from zero (no bands are consistently boosted or cut for certain instru-ments), but taking each song individually in consideration, a strong agreement of reasonably drastic boosts or cuts is shown for some songs. This confirms that the equalisation is highly dependent on the source material, and engineers largely agree on the necessary treatment for source tracks showing spectral anomalies.
5. CONCLUSION
We conducted a controlled experiment where eight mul-titrack recordings mixed by eight mixing engineers were analysed in terms of dynamic, spatial and spectral process-ing of common key elements.
We measured a greater variance of features across songs than across engineers, for each considered instrument and for the total mix, whereas the mean values corresponding to the different engineers were more often statistically dif-ferent from each other.
The relative loudness of the lead vocal track was found to be significantly louder than all other tracks, with an av-erage value of−3LU relative to the total mix loudness.
The amount of panning as a function of frequency was investigated, and found to be increasing with frequency up to about 400 Hz, above which it stays more or less con-stant.
We measured a consistent decrease of low frequency energy and an increase of crest factor for all instruments, and an increase of the spectral centroid of the snare drum track. Spectral analysis has shown a definite target spec-trum that agrees with the average specspec-trum of recent com-mercial recordings.
(a) Kick drum
31.5 63 125 250 500 1k 2k 4k 8k 16k −60 −40 −20 0 kick Energy [dB] Band [Hz] 31.5 63 125 250 500 1k 2k 4k 8k 16k −60 −40 −20 0 snare Energy [dB] Band [Hz] 31.5 63 125 250 500 1k 2k 4k 8k 16k −60 −40 −20 0 rest Energy [dB] Band [Hz] 31.5 63 125 250 500 1k 2k 4k 8k 16k −60 −40 −20 0 vocal Energy [dB] Band [Hz] 31.5 63 125 250 500 1k 2k 4k 8k 16k −60 −40 −20 0 bass Energy [dB] Band [Hz] 31.5 63 125 250 500 1k 2k 4k 8k 16k −60 −40 −20 0 bounce Energy [dB] Band [Hz] (b) Snare drum 31.5 63 125 250 500 1k 2k 4k 8k 16k −60 −40 −20 0 kick Energy [dB] Band [Hz] 31.5 63 125 250 500 1k 2k 4k 8k 16k −60 −40 −20 0 snare Energy [dB] Band [Hz] 31.5 63 125 250 500 1k 2k 4k 8k 16k −60 −40 −20 0 rest Energy [dB] Band [Hz] 31.5 63 125 250 500 1k 2k 4k 8k 16k −60 −40 −20 0 vocal Energy [dB] Band [Hz] 31.5 63 125 250 500 1k 2k 4k 8k 16k −60 −40 −20 0 bass Energy [dB] Band [Hz] 31.5 63 125 250 500 1k 2k 4k 8k 16k −60 −40 −20 0 bounce Energy [dB] Band [Hz] (c) Drums rest 31.5 63 125 250 500 1k 2k 4k 8k 16k −60 −40 −20 0 kick Energy [dB] Band [Hz] 31.5 63 125 250 500 1k 2k 4k 8k 16k −60 −40 −20 0 snare Energy [dB] Band [Hz] 31.5 63 125 250 500 1k 2k 4k 8k 16k −60 −40 −20 0 rest Energy [dB] Band [Hz] 31.5 63 125 250 500 1k 2k 4k 8k 16k −60 −40 −20 0 vocal Energy [dB] Band [Hz] 31.5 63 125 250 500 1k 2k 4k 8k 16k −60 −40 −20 0 bass Energy [dB] Band [Hz] 31.5 63 125 250 500 1k 2k 4k 8k 16k −60 −40 −20 0 bounce Energy [dB] Band [Hz] (d) Bass 31.5 63 125 250 500 1k 2k 4k 8k 16k −60 −40 −20 0 kick Energy [dB] Band [Hz] 31.5 63 125 250 500 1k 2k 4k 8k 16k −60 −40 −20 0 snare Energy [dB] Band [Hz] 31.5 63 125 250 500 1k 2k 4k 8k 16k −60 −40 −20 0 rest Energy [dB] Band [Hz] 31.5 63 125 250 500 1k 2k 4k 8k 16k −60 −40 −20 0 vocal Energy [dB] Band [Hz] 31.5 63 125 250 500 1k 2k 4k 8k 16k −60 −40 −20 0 bass Energy [dB] Band [Hz] 31.5 63 125 250 500 1k 2k 4k 8k 16k −60 −40 −20 0 bounce Energy [dB] Band [Hz] (e) Vocal 31.5 63 125 250 500 1k 2k 4k 8k 16k −60 −40 −20 0 kick Energy [dB] Band [Hz] 31.5 63 125 250 500 1k 2k 4k 8k 16k −60 −40 −20 0 snare Energy [dB] Band [Hz] 31.5 63 125 250 500 1k 2k 4k 8k 16k −60 −40 −20 0 rest Energy [dB] Band [Hz] 31.5 63 125 250 500 1k 2k 4k 8k 16k −60 −40 −20 0 vocal Energy [dB] Band [Hz] −40 −20 0 bass Energy [dB] −40 −20 0 bounce Energy [dB]
Figure 3: Average octave band energies (blue) with
stan-dard deviation (red) for different instruments after process-ing, compared to the raw signal (black).
31.5 63 125 250 500 1k 2k 4k 8k 16k −60 −40 −20 Energy [dB] Band [Hz] 31.5 63 125 250 500 1k 2k 4k 8k 16k −60 −40 −20 Energy [dB] Band [Hz] 31.5 63 125 250 500 1k 2k 4k 8k 16k −60 −40 −20 0 rest Energy [dB] Band [Hz] 31.5 63 125 250 500 1k 2k 4k 8k 16k −60 −40 −20 0 vocal Energy [dB] Band [Hz] 31.5 63 125 250 500 1k 2k 4k 8k 16k −60 −40 −20 0 bass Energy [dB] Band [Hz] 31.5 63 125 250 500 1k 2k 4k 8k 16k −60 −40 −20 0 bounce Energy [dB] Band [Hz]
Figure 4: Average octave band energies for total mix,
compared to ‘After 2000’ curve from [11] (green dashed line)
6. FUTURE WORK
Future work will be concerned with perceptual evaluation of mixes and its relation to features, using both qualita-tive (‘which sonic descriptors correspond with which fea-tures?’) and quantitative analysis (‘which manipulation of audio is preferred?’).
Further research is needed to establish the desired loud-ness of sources, as opposed to loudloud-ness of tracks, and its variance throughout songs, genres, and mixing engineers.
An extrapolation of the analysis described in this paper to other instruments is needed to validate the generality of the conclusions regarding the processing of drums, bass and lead vocal at the mixing stage, and to further explore laws underpinning the processing of different instruments. Based on the findings of this work, which showed trends and variances of different relevant features, we can inform knowledge engineered or machine learning based systems that automate certain mixing tasks (balancing, panning, equalising and compression).
This work was based on a still relatively limited set of mixes, for which the engineers came from the same insti-tution. Through initiatives such as the public multitrack testbed presented in this paper, it will be possible to anal-yse larger corpora of mixes, where more parameters can be investigated with more significance.
7. ACKNOWLEDGEMENTS
The authors would like to thank George Fazekas for assis-tance with launching the multitrack testbed.
This study was funded in part by the Engineering and Physical Sciences Research Council (EPSRC) Semantic Media grant (EP/J010375/1).
8. REFERENCES
[1] Alex Case.Mix Smart: Professional Techniques for the Home Studio. Focal Press. Taylor & Francis, 2011. [2] Brecht De Man and Joshua D. Reiss. A
knowledge-engineered autonomous mixing system. In135th Con-vention of the Audio Engineering Society, 2013. [3] ITU. Recommendation ITU-R BS.1770-3 Algorithms
to measure audio programme loudness and true-peak audio level. Technical report, Radiocommunication
Sector of the International Telecommunication Union, 2012.
[4] Roey Izhaki. Mixing audio: concepts, practices and tools. Focal Press, 2008.
[5] Olivier Lartillot and Petri Toiviainen. MIR in Matlab (II): A toolbox for musical feature extraction from au-dio. InProceedings of the 8th International Society for Music Information Retrieval Conference, 2007. [6] Stuart Mansbridge, Saoirse Finn, and Joshua D. Reiss.
An autonomous system for multi-track stereo pan posi-tioning. In133rd Convention of the Audio Engineering Society, 2012.
[7] Stuart Mansbridge, Saoirse Finn, and Joshua D. Reiss. Implementation and evaluation of autonomous multi-track fader control. In132nd Convention of the Audio Engineering Society, 2012.
[8] Bobby Owsinski. The Mixing Engineer’s Handbook. Course Technology, 2nd edition, 2006.
[9] Enrique Perez-Gonzalez and Joshua D. Reiss. Auto-matic mixing: Live downmixing stereo panner. In
10th International Conference on Digital Audio Effects (DAFx-10), 2007.
[10] Pedro Pestana.Automatic mixing systems using adap-tive digital audio effects. PhD thesis, Catholic Univer-sity of Portugal, 2013.
[11] Pedro Duarte Pestana, Zheng Ma, Joshua D. Reiss, Al-varo Barbosa, and Dawn A. A. Black. Spectral charac-teristics of popular commercial recordings 1950-2010. In135th Convention of the Audio Engineering Society, 2013.
[12] Pedro Duarte Pestana, Joshua D. Reiss, and Alvaro Barbosa. Loudness measurement of multitrack audio content using modifications of ITU-R BS.1770. In Au-dio Engineering Society Convention 134, 2013. [13] Jeff Scott and Youngmoo E. Kim. Analysis of acoustic
features for automated multi-track mixing. In Proceed-ings of the 12th International Society for Music Infor-mation Retrieval Conference, 2011.
[14] Jeff Scott and Youngmoo E. Kim. Instrument identifi-cation informed multi-track mixing. InProceedings of the 14th International Society for Music Information Retrieval Conference, 2013.
[15] M. Senior.Mixing Secrets. Taylor & Francis, 2012. [16] George Tzanetakis, Randy Jones, and Kirk McNally.
Stereo panning features for classifying recording pro-duction style. InProceedings of the 8th International Society for Music Information Retrieval Conference, 2007.
[17] Earl Vickers. The loudness war: Background, specu-lation, and recommendations.129th Convention of the Audio Engineering Society, 2010.


![Figure 4: Average octave band energies for total mix, compared to ‘After 2000’ curve from [11] (green dashed line)](https://thumb-us.123doks.com/thumbv2/123dok_us/9804745.2472574/6.892.81.431.71.258/figure-average-octave-energies-total-compared-curve-dashed.webp)
