PRODUCT REVIEW
tion, and trading applications. It has a recent, fully compatible companion, VectorVest ProTrader, which is a broad technical analysis charting software module that also offers the ability to find certain chart patterns.
W
HATYOURECEIVEThe regular program arrives on a CD-ROM, with three months of daily data and one year of weekly data for more than 7,400 stocks that trade on four VECTORVEST, INC. 2167 Wehrle Drive Williamsville, NY 14221 Phone: 716 565-9630, 888 658-7638 Fax: 716 632-4871 E-mail: [email protected] Internet: http://www.vectorvest.com Product: A stock analysis and portfolio
management system with buy, sell, and hold recommendations plus a separate technical analysis charting program with pattern recognition capabilities.
Equipment requirements: Pentium 75
MHz or faster computer with Windows 95 or higher, 16 megabytes of RAM (32 MB recommended), minimum of 250 MB hard disk space, a 4X or faster CD-ROM drive, 14.4 baud or faster modem, mouse, and Internet access.
Price: $49 per month for daily
down-loads or an annual subscription of $545. Trial offer for VectorVest ProGraphics: $29.95 for a five-week trial. ProTrader trial offer, $9.95 for 30 days.
by Barbara Star, Ph.D.
N
eed help finding good buyor sell candidates? Look-ing for tradLook-ing strategies to uncover just those stocks that meet your personal trading style? Want to find the strongest stocks in the strongest industry groups? How about including a charting pack-age filled with technical indicators to further refine and monitor trades? VectorVest ProGraphics and its new add-on module, VectorVest ProTrader, offer all this and more.VectorVest ProGraphics, the brain-child of Bart DiLiddo, is an end-of-day program that incorporates a unique sys-tem for stock selection, market
direc-different exchanges. (If users have enough hard drive space available, they may re-quest a free upgrade that contains six months of daily and two years of weekly data.) The software includes an Internet
Calendar Relative safety Relative value Stock viewer Relative timing VST vector Projected growth rate Buy/sell recommend Stop price
Number of buy, sell, holds in the databas Industry
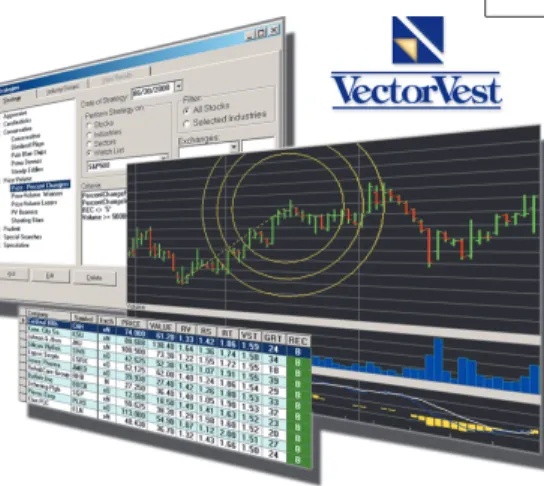
FIGURE 1: THE STOCK VIEWER SPREADSHEET: The Stock Viewer spreadsheet appears with the proprietary indicators developed by VectorVest, plus more than 20 additional fundamental and technical analysis categories. There is so much information that it is necessary to use the vertical and/or horizontal scroll bars. The user must decide whether to rank the stocks from high to low or from low to high. In this case, the stocks holding the highest VST ratings for the day rose to the top. Spreadsheets may be displayed in both daily and weekly time frames. The calendar shows past data rankings so that traders may see changes over time. Beneath the spreadsheet lies information about the number and percent of buy, sell, and hold recommendations given that day. The industry group for any highlighted stock is automatically displayed near the bottom of the page.
VectorVest combines fundamental and technical analysis along with a newsletter, market timing system, and built-in search engines, making it unique in its field.
VectorVest ProGraphics
Version 5.0
And Vector
Vest ProTrader
downloader, a users’ manual, a video overview, and a book by DiLiddo titled
Stocks, Strategies & Common Sense.
For most computers, the installation begins automatically when the CD-drive door closes. Some computers, however, may need a manual install via the start and setup selections. Computer speed counts to maintain reasonable waiting times for the sorting and searching func-tions on its large database, so faster is better! Internal ranking and sorting func-tions usually take only a few seconds, at least on my Pentium II.
Because all data needs to be pro-cessed through the VectorVest system prior to downloading, daily data up-dates are available from the Internet after 8 pm Eastern time. Downloading time depends on modem speed and Internet traffic. It took about five min-utes to transfer the data to my hard drive. In case of an Internet logjam, the company also provides a telephone num-ber (a toll call) from which to download. And, while traveling, the company fur-nishes free use of the Internet-only lim-ited-content version.
Manual datafeeds or data transfers from outside vendors are not possible, but an export feature does allow infor-mation transfer from the ProGraphics program to text, .csv, and ASCII files.
Everything in the package is geared toward making the program simple to use. DiLiddo’s book explains the value-oriented trading philosophy that underlies VectorVest and suggests practical trading strategies. The video, the demo module on the CD-ROM, and the help menu contain step-by step instructions. The manual contains the same instructions, but without the graphics. Still stymied? Not to worry! For the cost of a phone call, technical support is available every day. Every user I spoke with had high praise for
FIGURE 2: BUSINESS SECTORS AND INDUSTRY GROUPS. This graphic presents an overlap of three charts in weekly mode to show that the Stock Viewer also performs rankings on sectors and industry groups. The list on the left presents the top sectors found that week. Although multiple sectors can be chosen, only the first sector, banking, was selected here. The middle panel brought up the list of industry groups in that sector. Clicking on the top group, multiregional, produced the stocks that make up the multiregional banking industry, ranked from the highest to the lowest VST scores. The program simplifies the process of ranking and locating the best stocks in the hottest sectors and industry groups.
the courteous, patient, and knowledge-able technical support staff.
T
HEHEARTOFP
ROG
RAPHICSThose who have visited the VectorVest Website for stock analysis know that the heart of the program is the propri-etary ranking system from which the buy, hold, and sell recommendations are made. A vector is a quantity that has magnitude and direction; the program derives its name from a master ranking category, called VST-Vector (VST). The ranking system incorporates three indi-cators:
• Relative value (RV), an indicator
that measures a stock’s long-term price appreciation potential com-pared with an investment in AAA corporate bonds
• Relative safety (RS), a measure of
the probability that a stock will meet price performance expecta-tions, and
• Relative timing (RT), which
re-flects and projects a stock’s short-term price performance.
VST stands for value-safety-timing vector and is a weighted vector sum of the RV, RS, and RT values. Stocks with high VST ratings have the best combina-tions of value, safety, and timing. Each indicator is applied daily to every stock in the database. For easy comparison, each indicator is plotted on a scale of zero to +2.00. Scores above +1.00 (the closer to +2 the better) are considered favorable. Scores below 1.00 are unfa-vorable. (See Figure 1.)
In addition, the VectorVest system computes an inherent price value (“Value”) for each stock, a projected long-term growth rate (GRT), and a stop price (“Stop”) exit placement. Buy, hold, and sell recommendations (“REC”) are based on value, timing, and risk.
All these rankings are presented on a spreadsheet in the Stock Viewer compo-nent of ProGraphics. Also presented are the name of the market exchange on which each stock trades, whether it is optionable, the industry group to which it belongs, and two dozen categories of both funda-mental and technical information. See sidebar, “Stock Viewer spreadsheet
cat-Each indicator is applied daily
to every stock in the database.
For easy comparison, each
indicator is plotted on a scale
of zero to +2.00.
egories.” Users may sort in ascending or descending order in any category by sim-ply clicking on its heading.
The program provides similar rankings and information for industry groups and business sectors but without the buy/sell recommendations. It is also possible to view the industry groups within the business sectors and the stocks that compose them. (See Figure 2.)
A calendar on the spreadsheet takes the user back in time, either daily or weekly, to see how the rankings have changed. Highlighting the company name on the spreadsheet and clicking the graph icon will display any stock, industry group, or business sector as a price chart. (See Figure 3A.) Multiple charts are stacked and shown one at a time.
The default charts aren’t pretty, but they yield instant information about tim-ing, value, safety, stop-loss placements, and buy/sell recommendations. You could create nicer-looking charts plus moving averages and trendlines by selecting the OHLC option. (See Figure 3B.)
S
TOCKHUNTINGTraders who use ProGraphics told me they find it very user-friendly. The steps for locating stocks are few and easy. One user even told me the procedure was a “no-brainer,” that it was that simple to master.
Find market direction: First, down-load the data and read VectorVest Views, a daily newsletter written by DiLiddo. Check out the sections on market tim-ing and strategies to learn which work best under current market conditions.
Market timing is based on the VectorVest Composite (VVC), a special indicator that can be analyzed and graphed as if it were a stock. The price movements of VVC signal the market direction. By waiting until the signal is verified, VVC can detect major market turns soon after (and sometimes before) the market changes direction. (See Figure 4.)
VectorVest contends that its market timing system (MTI) has never failed to keep traders on the right side of market trends. Color Guard, which is based on the VVC, signals both market strength and direction. (See Figure 5.) The
news-FIGURE 3B: CINTAS OHLC PRICE CHART. A much more familiar price chart emerges when the open-high-low-close option is chosen. Price bars in the top panel and volume bars in the bottom panel turn color in response to daily or weekly changes. Up to three moving averages may be plotted in addition to trendlines.
FIGURE 3A: VECTORVEST PRICE CHARTS.VectorVest default charts are really graphic displays of the stock’s closing price (black dots), its inherent value (blue plus sign), and the stop price (green diamond shape) in the upper panel. This chart of Cintas Corp. indicates that the price at which it was trading was well above its real value. It also shows where it would have received a sell signal each time it fell below its stop price. The lower panel contains a red relative timing indicator and a horizontal line at the indicator’s 1.00 level. When the RT crosses the +1.0 level, it indicates that the stock price is gaining price momentum. The vertical line indicates the date another buy recommendation was given.
Stop price
Value
Closing price
Date
STOCK VIEWER SPREADSHEET CATEGORIES
Company Company name
Symbol The stock’s ticker symbol Exchange Where the stock is traded Price The closing price for the day Value The stock’s intrinsic value
RV Relative value, an indicator of long-term price appreciation potential
RS Relative safety, an indicator of consistency and predictabil-ity
RT Relative timing, an indicator reflecting short-term perfor-mance
VST VST-Vector, an overall rating of value, safety and timing REC Buy, hold or sell recommendation
STOP Stop price
EPS Leading 12-month earnings forecast, $/share EY Earnings yield in percent
P/E Price to earnings ratio
GRT Forecasted earnings growth rate GPE Growth to P/E
DIV Annual dividend payment in $/share DY Dividend yield in percent
DS Dividend safety
DG Dividend growth rate in %/year YSG Dividend yield-safety-growth vector Risk Dividend risk assessment
Open Opening price for the day High High price for the day Low Low price for the day
Range High minus low
% PRC Day-to-day percent price change Volume Total # of shares traded
AvgVol 50-day moving average of daily volume % Vol % Volume change from average volume Shares (M) Outstanding shares in millions
Sales ($M) Sales in millions
Mkt Cap ($M) Market capitalization in millions P/S Price to sales/share ratio SPS Sales per share
Industry Name of industry group
• Fundamental factors include: Value, RV, RS, GRT, $Div, DY, EY, EPS, P/E, GPE, DS, DG, YSG, Risk, and Industry.
• Technical factors include: Price, RT, Stop, Volume, AvgVol, % Vol, Open, High, Low, and % PRC, P/S, SPS, Mkt Cap ($M).
VST-Vector and REC combine both fundamental and technical factors. —B. Star letter suggests trading strategies based
on market strength, direction, and the user’s trading style.
VectorVest Views contains other infor-mation of interest, such as the investment climate, an evaluation of the DJIA, a list of selected stocks, a top stock of the week, user group locations, and upcoming events.
Narrow the search: Now that market
direction and general strategy are known, select the strategy icon and run one or more of the built-in strategies on the entire database of stocks, industry groups, or business sectors.
The Strategies component searches and sorts stocks, industry groups, or
business sectors that meet a given set of criteria on a given day. Pick a category that reflects your risk-taking style, be it conservative or speculative, and the pro-gram generates several specific strate-gies from which to choose. (See Figure 6.) For instance, a prudent trader might prefer to balance safety, value, and tim-ing, while a more aggressive or specula-tive trader would decide to place greater emphasis on timing, even though it en-tails greater risk. In addition, there are strategies based on special interests, such as price-volume expansions or under-valued stocks that have maintained con-sistent dividends.
Another component, Trendsetter, can search for stocks that match several criteria over as many as 10 time periods. This powerful feature not only uncov-ers trending stocks, industry groups, or business sectors, it also serves as a pat-tern recognition method that is espe-cially useful for bottom-fishing. Figure 7 shows an example of one of the many built-in Trendsetter patterns.
Stick with the built-in searches or develop your own. Both the Strategies and Trendsetter components allow any of about 30 categories to be used as parameters along with many operators (for example, +, -, *, /, >, <, =, <>). Advanced users even create search rou-tines that further refine other searches. And, as with most aspects of the pro-gram, these can be backtested up to the amount of data in the user’s database.
Create watchlists: Each search and sort routine produces a list of stocks. Trans-fer those stocks into one or more watchlists as shown in Figure 8A. When a particular search contains a large num-ber of stocks, rank them by VST. Then save only the top 10 to 20 stocks, be-cause they probably represent the best of the bunch. Look for REC change on existing watchlists (Figure 8B).
VectorVest ProGraphics comes with more than two dozen watchlists that include the Dow Jones Industrial Aver-age (DJIA) and Standard & Poor’s 500. Maintain as many watchlists as you wish; there are no restrictions as to the number or content size. It is even pos-sible to manually enter stocks
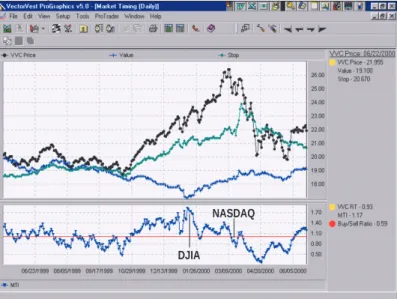
sug-FIGURE 4: TIMING THE MARKET. The market timing composite (VVC), the black line in the upper panel, is an average of the closing price of every stock in ProGraphics 5.0. Value and stop price also share that panel. The market timing indicator (MTI), which occupies the lower panel of the chart, combines the VVC price, the relative timing of the VVC, and a buy/sell ratio into a single indicator. The up arrow on the MTI panel indicates where the Dow Jones Industrial Average made its top in January. The down arrow shows when the MTI broke below its 1.0 line. That happened on March 14, 2000, just four days after the Nasdaq Composite peaked. The strategy section of the “VectorVest Views” newsletter warned, “This seems to be the beginning of a severe correction, therefore serious caution is advised.”
FIGURE 5: THE COLOR GUARD. The Color Guard timing method appears daily in “VectorVest Views.” It is meant to portray an accurate description of the direction and strength of the stock market. The numeric direction of the three Color Guard indicators — the price of the VectorVest Composite (VVC Price), the relative timing of the VectorVest Composite (VVC RT), and the buy/ sell ratio (BSR) — determines its strength. Each indicator is colored green to show strength in that category, red shows weakness, and yellow is neutral.
The final column in the graph is called “trend.” It looks at the direction of both the VVC price and the MTI in relation to the day (or week) before. From the beginning of March 1 through March 10, the trend was up. By March 14, the trend had changed from up to down. That plus the change in the buy/sell ratio to red, the string of yellow in the relative timing, and the decreasing VVC prices led to the warning that a correction had begun.
FIGURE 6: TRADING STRATEGIES. This feature offers many search-and-sort routines that meet different trading approaches. Here are the choices available. The Hidden Gems routine was highlighted and its parameters appeared in the criteria box. This search looks for stocks priced $30 or less, with good relative safety at 1.25 or higher, and a projected growth rate of 20%. It can run this search on all stocks and present the results on a spreadsheet sorted from high to low, according to their VST rankings. These strategies, even those in the more aggressive categories, may catch part of a move but not necessarily actual tops or bottoms.
FIGURE 7: TRENDSETTER. Trendsetter differs from strategies in a few ways. First, it is not concerned with trading style or risk levels. Second, it can contain multiple criteria that occur over several periods. In the example above, Trendsetter would look for a bottom-fishing search based on changes in the buy, sell, and hold recommendations given for the last six days. The criteria specify that the recommendations (REC) move from a sell to a nonbuy (either a sell or hold) to a buy.
gested by newsletter gurus or finan-cial publications into a watchlist and run trading strategies on those. Maybe you want to keep a watchlist of optionable stocks. Analyze them
fur-ther by using the option feature to determine volatility based on the delta.
Track your trades: When buy/sell trad-ing positions are taken, monitor how
well the stocks perform via the portfolio manager feature. (See Figure 9.) With each data download, the ProGraphics program automatically updates the stocks in the portfolio, including changes
DJIA
in buy, hold, and sell recommendations. Stock splits are adjusted automatically. Pie charts show the percentage of indi-vidual stock holdings or the industry group diversity that exist in each portfo-lio. (See Figure 10.)
Traders can even create a watchlist of the stocks in the portfolio and run search and sort routines to help make the decision whether to keep or dump certain stocks.
The history tab of the portfolio man-ager displays stocks sold. Print the dis-play and receive two reports, one for the long term and the other for short-term holdings. It’s great to have at tax time!
V
ECTORV
ESTP
ROT
RADERVectorVest offers ProTrader as a sepa-rate technical analysis program designed to work only with ProGraphics 5.0. The ProTrader module provides a seamless link with ProGraphics. Its impressive array of popular indicators allows trad-ers to chart and analyze stocks, industry groups, or watchlists without having to leave the ProGraphics software. Be-cause it draws from the existing ProGraphics database, it eliminates the need to create duplicate data directo-ries, saving time and hard drive space. (See sidebar, “ProTrader technical analysis tools,” for the list of indicators, studies, and price charting styles.) There is a separate ProTrader help index within the larger help menu. There is no formal manual at this time.
ProTrader can display up to three indicators plus price on each chart along with moving averages, Bollinger Bands, trendlines, and other interactive draw-ing features on price. (See Figure 11. Note that the background color of Fig-ure 11 has been changed for ease of reference for this review.) Traders may view charts by choosing from several preset periods or by setting custom date parameters. It takes noticeably longer to construct price charts when custom settings are used.
Right-click on any displayed indica-tor to change its length, color, line width, and line style. Plot your three favorite indicators within one of the preset time frames and save it as a layout. Run single or multiple charts directly from
FIGURE 8A: WATCHLIST. A watchlist is similar to a directory that holds only those stocks you wish to follow. Create any number of watchlists to keep stock, industry, or index categories separate. ProGraphics has watchlists for stocks that make up the DJIA, S&P, and the Nasdaq plus several other categories. Once a watchlist is created, view the stocks to see what the new download ranks are and/or run any strategies or Trendsetter sort routines on them.
FIGURE 9: PORTFOLIO MANAGER. VectorVest maintains a model portfolio. Using an initial investment of $100,000, this portfolio grew almost $4,000 ($103,827) in eight trading days. Build portfolios derived from actual stock transactions or on “what-if” scenarios.
FIGURE 10: PORTFOLIO ALLOCATION. A pie chart within the portfolio manager gives traders a snapshot of their sector and industry allocation. The pie chart here shows the asset allocation heavily weighted in the semiconductor industry of the electronic sector.
FIGURE 11: VECTORVEST PROTRADER PRICE CHART. ProTrader produces colorful charts that display up to three indicators. It is similar to, but more sophisticated than, charting packages seen on the Internet. This chart also contains two of the interactive drawing features on price — moving average envelopes and speed resistance fan lines.This chart also contains two of the interactive drawing features on price — moving average envelopes and speed resistance fan lines.
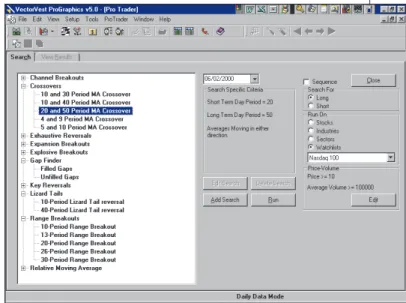
FIGURE 12: PROTRADER PATTERN SEARCHES. As with all search functions, VectorVest includes many types and variations of preprogrammed searches. Here’s a 20- and 50-day moving average crossover of the Nasdaq 100 watchlist. A sequencing function allows traders to further narrow the search by selecting searches from other category types — for example, choosing a crossover of the moving average, an unfilled gap, and a 20-period range breakout on the same day. Search results are presented for those stocks that meet all, not just one, of the searches’ chosen criteria.
the ProGraphics spreadsheet of stocks, industry groups, sectors, or watchlists. Create a watchlist of your portfolio(s) to analyze their contents with technical indicators.
P
ATTERNRECOGNITIONOn the surface, ProTrader looks like a nice little charting package. However, if you were to look deeper, you would
discover its powerful pattern recogni-tion component, a feature that separates ProTrader from many other technical analysis programs.
The module contains several prepro-grammed searches that work alone or in conjunction with ProGraphics trading searches and sorts. Some printed mate-rial accompanies the program to ex-plain how and when to use the built-in
pattern searches.
Figure 12 shows the interesting as-sortment of major categories currently available. Within each major category are one or more preprogrammed choices for the user to select for the search. The program also provides the capability to add other choices.
A pattern search looks only for those stocks that fit the selected choice on the
day it is run. If noth-ing is found for the current day, users may change the cal-endar date and rerun the search on any prior day.
Run any search on stocks, industries, sec-tors, or watchlists.
users room to grow as trading needs and styles change.
ProTrader certainly provides chart displays that are superior; it offers a basic charting program for those who like the opportunity to use, or learn to use, technical indicators that enhance entry and exit decisions. In all, ProTrader’s built-in search routines are a boon for those who want a fast and easy method for locating signs of poten-tial price changes.
VectorVest has a combination of fun-damental and technical analysis along with a newsletter, market timing sys-tem, and built-in search engines, all of which come together as a stock analysis and portfolio management system that makes it unique in its field.
Barbara Star, Ph.D., 818 224-4070, is a part-time trader and former university professor. She is a past vice president of the Market Analysts of Southern Cali-fornia and led a MetaStock users group for many years. She is a frequent
con-tributor to Technical Analysis of STOCKS
& COMMODITIES. Currently, she pro-vides individual instruction and consul-tation to those interested in technical analysis. She may also be reached via E-mail at [email protected].
VectorVest has a combination of fundamental
and technical analysis along with a
newsletter, market timing system, and
built-in search engbuilt-ines, all of which come together
as a stock analysis and portfolio management
system that makes it unique in its field.
Create a watchlist of the stocks in a portfolio to check for one of the selected patterns. It is even possible to run mul-tiple searches using ProTrader’s Se-quencer; for instance, search for the cross-over of the five- and 10-unit moving averages and also for unfilled gaps. First, the program looks for any match of the crossover. Then it searches any cross-over stocks that were found to locate unfilled gaps. The sequential search is another way to further refine stock selec-tion. Care should be taken not to narrow the selection process so much that no stocks could be found.
C
ONCLUSIONVectorVest ProGraphics 5.0 and ProTrader make a powerful team for those traders who want to combine fun-damental and technical analysis. ProGraphics 5.0 offers so many useful features that it can meet the needs of many types of traders. The ProGraphics users I spoke with liked the ease with which the software can be run and being able to locate good stocks from which to make trading decisions. Once users be-come familiar with the basics of the program, there is room for them to cre-ate new, more complex strcre-ategies. In other words, it is a program that allows
PROTRADER TECHNICAL ANALYSIS TOOLS
This software has these studies:
Accumulation/distribution indicator
Average true range Bollinger Bands Chaikin’s oscillator Chaikin’s volatility Commodity channel index Detrended price oscillator Ease of movement
Exponential moving average Lane’s stochastic (%D
and %K) Mass index Median price
Moving average conver-gence/divergence Money flow index Negative volume index On-balance volume Performance
Price and volume trend Price rate of change Rate of change percent Relative strength index Standard deviation Triangular moving average TRIX
Typical price
Vertical horizontal filter Volume oscillator Weighted close
Weighted moving average Williams’ %R
And these interactive drawing features: Gann — Fans
Fibonacci — Arcs, fans, retracements, and time zones
Tirone — Midpoint, mean Lines — Resistance,
quadrant, and trend —B. Star