Facility Management
Stuart RichChief Technology Officer PenBay Solutions LLC
Kevin H. Davis
Director of Business Development PenBay Solutions LLC
Geographic Information Systems (GIS) for Facility Management
i
TABLE OF CONTENTS
Acknowledgements . . . .1
About the Authors . . . .2
Foreword . . . .3
Part 1 Executive Summary . . . 5
Part 2 Introduction. . . 6
Part 3 An Overview of Geographic Information Systems. . . 7
3.1 GIS Basics . . . 7
3.1.1 GIS Has Layers . . . 7
3.1.2 GIS Provides Seamless Scaling. . . 8
3.1.3 GIS Attribute Data Is Strongly Typed . . . 8
3.1.4 Basic Kinds of GIS Feature Classes . . . 8
3.1.5 GIS Supports Topologically Rich Data Models . . . 9
3.2 GIS Data Storage and Organization. . . 9
3.3 Enterprise GIS Framework . . . 9
3.4 Spatial Data Infrastructure . . . 9
Part 4 GIS in Facility Management. . . 11
4.1 Spatial Data Infrastructure for Facilities . . . 11
Part 5 GIS Integration With Integrated Workplace Management Systems (IWMS) and Others. . . 13
5.1 Overview . . . 13
5.2 Computer Aided Facility Management (CAFM) and Integrated Workplace Management Systems (IWMS) . . . 13
5.3 Approaches to Integration . . . 14
5.3.1 Open Application Programming Interface . . . 14
5.3.2 “Map It” Approach. . . 14
5.3.3 Fully Integrated GIS/IWMS. . . 14
5.4 Market Organization . . . 14
5.4.1 Project Management . . . 15
5.4.2 Real Estate and Portfolio Management . . . 15
5.4.3 Facility and Space Management . . . 16
5.4.4 Maintenance Management . . . 16
5.4.5 Environmental Sustainability and Management . . . 17
5.5 Market Drivers. . . 17
5.5.1 Facility Real Estate Consolidation and Portfolio Rationalization . . . 18
5.5.2 Globalization: Requiring a Worldwide Portfolio View. . . 18
5.5.3 Life Cycle Approach to Facility and Real Estate Management . . . 18
5.5.4 Requirements to Enhance the User Experience . . . 18
5.5.5 Business Continuity and Disaster Recovery . . . 18
5.5.6 Compliance With US Government Legislation . . . 18
5.5.7 GIS and the Future of the IWMS Sector . . . 19
5.5.8 Other Enterprise Integrations With GIS . . . 19
5.6 Summary. . . .20
Part 6 GIS in Emergency Preparedness . . . 21
Part 7 GIS Complements Building Information Modeling (BIM) . . . 23
Geographic Information Systems (GIS) for Facility Management
ii
7.1.1 Data Exchange From the Construction Phase to the Operations and
Maintenance Phase . . . 24
7.1.2 Laser Scanners. . . 24
7.1.3 Collection and Cataloging of Room Data Information Logistics. . . 24
7.2 buidingSMART alliance . . . 24
7.3 Open Geospatial Consortium CityGML . . . 24
7.4 BIM for Design and Construction . . . 25
7.5 BIM for Operations and Maintenance . . . 25
Part 8 GIS Data Management . . . .27
Part 9 GIS Analysis . . . .29
Part 10 GIS Visualization . . . 31
Part 11 In-Building GIS . . . 37
Part 12 Making the Business Case for GIS in Facility Management . . . .39
12.1 Site Selection . . . .39
12.2 Market and Customer Analysis . . . .40
12.3 Emergency Action Planning: Floods, Fires and Incident Planning. . . 40
12.4 Developing Efficient Workflows and Business Processes . . . 41
12.5 Visualization of Time-Based Phenomena From the Local to the Global Scale . . . 41
12.6 Conclusion . . . 42
Part 13 Case Studies . . . .43
13.1 MacDill Air Force Base, Facility Management Mapping. . . .43
13.1.1 Challenge . . . .43
13.1.2 Solution . . . .44
13.2 Air Combat Command Web Map Viewer and Training Management System . . . .44
13.2.1 Challenge . . . .44
13.2.2 Solution. . . .44
13.3 Sky Harbor International Airport, Phoenix, Arizona, GIS Implementation . . . 45
13.3.1 Challenge . . . .46
13.3.2 Solution. . . 46
13.4 US Army Corps of Engineers GIS for Spatial Allocation . . . 47
13.4.1 Challenge . . . 47
13.4.2 Solution. . . .48
13.5 NASA Optimization and Associated Technology Status and Plan. . . 49
13.5.1 LaRC Investment . . . .50
13.5.2 Near-Term and Future Tactical Efforts . . . .50
13.6 Conclusion . . . 51
Part 14 Appendices . . . .52
14.1 Appendix A: References . . . 52
14.2 Appendix B: Additional Resources . . . .53
14.3 Appendix C: Glossary . . . .54
TABLE OF CONTENTS
Geographic Information Systems (GIS) for Facility Management
1
ACKNOWLEDGEMENTS
‘Expand knowledge of the built environment, in a changing world, through scholarships, education and research’
The Vision Statement of the IFMA Foundation We acknowledge the following people and
organi-zations not only for their assistance in the produc-tion of this white paper, but also for their thought leadership in the application of geographic infor-mation systems (GIS) to facility management:
• John Young, ESRI • Matt Davis, ESRI • Eric Wittner, ESRI
• Mark Sorensen, GPC, Inc.
• Mike Parkin, Massachusetts Institute of Technology
• John Przybyla, Woolpert, Inc.
• Neils LaCour, University of Massachusetts Amherst
• Brad Ball, NASA
• Troy Hergenrader, Teng & Associates, Inc. • Ray Dinello, University of North Carolina at
Charlotte
We also acknowledge BISDM, the Building Infor-mation Spatial Data Model committee, and IFMA, the International Facility Management Association, for their efforts to influence the application of GIS to facility management.
The Building Information Spatial Data Model (BISDM) committee was formed in late 2007 as a community of interest focused on creating a GIS
data model for buildings. The BISDM committee is a volunteer organization dedicated to providing a collection of best practices, case studies and templates that individuals can adopt or adapt to specific project needs.
IFMA is the world’s largest and most widely rec-ognized international association for professional facility managers, supporting more than 19,000 members in 78 countries. The association’s mem-bers, represented in 123 chapters and 16 councils worldwide, manage more than 37 billion square feet of property and annually purchase more than $100 billion (US dollars) in products and services. Formed in 1980, IFMA certifies facility managers, conducts research, provides educational pro-grams, recognizes facility management certificate programs and produces World Workplace, the world’s largest facility management conference and exposition.
Finally, we would like to extend our gratitude to Ann Marie Lynch, marketing communications manager, PenBay Solutions LLC, for her assis-tance on this project. Ann Marie edited this publi-cation, taking the seemingly incoherent notes and ramblings of the authors and organizing them into a cohesive paper, which we hope makes a positive contribution to the discussion of the intersection between facility management and GIS technology.
Reviewers
Russ Anderson, PMP, MCSD Facilities Solutions Group
Troy Hergenrader
Teng & Associates, Inc
Eberhard Laepple, PhD, LEED AP HOK
Angela Lewis, PE, LEED AP
University of Reading; Building Intelligence Group
Paul Teicholz, PhD
Founder of CIFE at Stanford University
Burcu Akinci, PhD Carnegie Mellon University
Geographic Information Systems (GIS) for Facility Management
2
Stuart Rich
Stuart Rich is chief technology officer at PenBay Solutions LLC with more than 15 years’ experience developing database applications and geographic information systems (GIS) for government and com-mercial organizations across the United States and internationally. He has been a technical pioneer in bringing GIS inside the building, leading PenBay in its innovative efforts of providing spatial robotic data collection and 3D visualization technologies to a variety of industries around the world. Stuart has been a leader in the development of the Building Interior Space Data Model (BISDM), a data model for creating, storing and sharing information about structures and their assets. He has several years of extensive GIS experience, with expertise in ESRI technology and a focus on project management, data analysis and modeling, business process analysis and workflow methodology design.
Kevin H. Davis
Kevin H. Davis is the director of business develop-ment at PenBay Solutions LLC with more than 20 years’ experience in business management within the enterprise technology market and the real estate development and construction industries. At PenBay, he is leading the effort to bring GIS to the field of facility management. As director of busi-ness development, Kevin is responsible for account and channel management, as well as new market development for products and services related to the application of GIS technology in facility man-agement. Kevin focuses on a number of markets, including health care, higher education and airports. Kevin also concentrates on partner strategy and re-lationship management for the integrated workplace management system and computer aided facility management (IWMS/CAFM) market, which includes application vendors and vertical market services companies.
This Publication is Sponsored by:
Manhattan Software425 Fortune Boulevard, Suite 200 Milford, MA 01757 USA
www.manhattansoftware.com
ESRI 380 New York Street Redlands, CA 92373 USA
www.esri.com
Geographic Information Systems (GIS) for Facility Management
3
In modern society, people spend the vast majority of their waking and sleeping hours inside of buildings. Buildings are man-made
ecosystems – vast assemblages of interdependent living and nonliving components. Facilities have become the primary habitat for humans.
As technology advances at a record pace, our man-made ecosystems are becoming more complex and sophisticated. These intricate collections of materials, infrastructure, machinery and people, with countless spatial and temporal relationships and dependencies, require
progressively more sophisticated tools to design and manage them.
Given the importance of facilities and their place in society, a revolution in facilities management is occurring. Geographic information systems (GIS) are designed specifically for the management and analysis of spatial relationships, and offer many benefits to the facilities management community. In the past, GIS was commonly used to help measure the impact of a facility on a natural ecosystem. Today, GIS is increasingly being used to plan, manage and operate the man-made ecosystem – the facility. Facilities managers are finding GIS tools, which have been used successfully for many years in fields such as environmental analysis and landscape planning, support a broad range of applications inside and outside of buildings, such as operations planning, emergency management, Americans
with Disabilities Act (ADA) compliance, safety and security planning, space utilization and optimization, and more.
GIS can be used throughout the life cycle of a facility – from site selection, design and construction to use, maintenance and adaptation, and ultimately through closing, repurposing and reclamation. The challenge is to manage each step of the process in a way that maximizes the benefits of the facility to society while minimizing short- and long-term impacts on the natural environment. As an integrative platform for management and analysis of all spatial things, I believe, as the authors of this white paper have eloquently stated, GIS “is the only technology that has the ability to scale across any expanse, from the individual asset within a building to a virtually global context.”
Jack Dangermond
President ESRI
GEOGRAPHIC INFORMATION SYSTEMS
(GIS) FOR FACILITY MANAGEMENT
Geographic Information Systems (GIS) for Facility Management
4
White Paper Editorial and Production Team Executive Editor: Eric Teicholz, IFMA Fellow,
President, Graphic Systems
Editorial Assistant: Angela Lewis, PE, LEED AP, PhD Candidate, University of Reading; High Performance Buildings Engineer, Building Intelligence Group
Copy Editor: Lisa Berman, Editing and Writing Consultant
Production: Troy Carpenter, Graphic Design and Production Layout
International Facility Management Association
August 2010 IFMA Foundation
1 E. Greenway Plaza, Suite 1100 Houston, TX 77046-0194 Phone: 713-623-4362
www.ifmafoundation.org
The Mission of the IFMA Foundation is to promote and support scholarships, educational and research opportunities for the advancement of facility management worldwide. Established in 1990 as a nonprofit, 501(c)(3) corporation, the IFMA Foundation is supported by the generosity of a community of individuals – IFMA members, chapters, councils, corporate sponsors and private contributors – and is proud to be an instrument of information and opportunities for the profession and its representatives.
A separate entity from IFMA, the IFMA Foundation receives no funding from annual membership dues to carry out its mission. Supported by the generosity of the FM commu-nity, the IFMA Foundation provides education, research and scholarships for the benefit of FM professionals and students. Foundation contributors share the belief that education and research improve the FM profession.
Geographic Information Systems (GIS) for Facility Management
5
1
EXECUTIVE SUMMARY
Geographic information systems (GIS) are one technology that has many practical uses for facility managers. A GIS is a system that allows one to view, understand, question, interpret and visualize data in many ways that reveal relationships, patterns and trends in the form of maps, globes, reports and charts. A GIS can be used by facility managers for space management, visualization and planning, and emergency and disaster planning and response, as well as many other applications.
This white paper provides a detailed overview about geographic information systems, including five case studies. The white paper is intended to be useful for individuals and leaders within facility management, as well as real estate managers, property developers, architects, engineers, consultants and government entities. Students in facility management will also find this white paper relevant.
The paper includes detailed discussion about the following topics:
• GIS basics
• How GIS can be used in facility management ○ Real estate and portfolio management
○ Facility and space management ○ Maintenance management
○ Environmental and sustainability management
○ Emergency preparedness ○ Visualization
• How GIS can be integrated with other applications, such as computer aided facility management (CAFM) and integrated workplace management systems (IWMS) and building information modeling (BIM)
• Market drivers • Case studies
○ Space management for janitorial contracts
○ Information sharing and decision making
○ Spatial data utilization
Geographic Information Systems (GIS) for Facility Management
6
2
INTRODUCTION
Our world is growing smaller by the day and, as a result, business processes that just a few decades ago involved only a relatively small business footprint now span campus, regional and national borders. This phenomenon is increasingly evident in the realm of facility management. Yet the tools and applications that professional facility managers use to manage buildings, capital assets, maintenance, infrastructure – and a dizzying array of business processes – were not designed to be truly scalable. Thus, these tools and applications are not ideally suited to meet the requirements for managing broadly geographically dispersed portfolios of physical assets and business processes.
Out of necessity, the facility management application industry has adopted architectural floor plans as the common denominator for viewing the built environment. This is
understandable because architectural floor plans, and by extension, computer aided design (CAD), historically represented the only media available for understanding and interacting with buildings and their contents and associated workflows. The progression from hand-drawn floor plans to CAD drawings, and now building information models (BIM), is essentially a progression from single floor plate views to whole building representations. To be truly effective across geographies the tools used to manage these distributed and disparate assets and workflows need to be able to scale far beyond individual buildings and individual site maps.
CAD was conceived as a set of tools and applications for design and construction. By contrast, geographic information systems (GIS) were conceived of and developed as a technology for managing information related to entities across the landscape. The value proposition for utilizing GIS for facility management business processes is not as a replacement for CAD and other enterprise facility management applications, like integrated
workplace management systems (IWMS). The true value of GIS to facility management is as a complementary technology that, when integrated with the myriad facility management technologies and applications already in use, provides much greater benefits than the sum of its parts.
While CAD traditionally was concerned only with buildings and building interiors, GIS focused on what is referred to as the landscape or exterior environment. Neither technology crosses the boundary of the other, yet business processes do not have such artificial boundaries. There are many examples where facility management processes cross these boundaries:
• Utilities – Power and water would not be of much use if they stopped at the outside of the building.
• Maintenance management – Maintenance workflows require work both inside and outside buildings and across the entire supply chain. Before GIS, there has not been a single
technology that provides a holistic view and supports integrated workflows that place the material components of these workflows into their real world, landscape-level context both inside and outside the built environment. Only GIS can do this effectively because it is the only technology that has the ability to scale across any expanse, from the individual asset within a building to a virtually global context. This is not to say that GIS can replace CAD and, more importantly, BIM. When a workflow calls for interaction with extremely detailed construction and engineering information within a structure, these tools are by far the appropriate choice and can be accessed (integrated) from the GIS, similar to any other application. When the workflow calls for managing assets simultaneously inside and outside of the built structure, GIS is the only option for a foundation technology platform that seamlessly provides “world-to-the-widget” scalability.
Geographic Information Systems (GIS) for Facility Management
7
AN OVERVIEW OF GEOGRAPHIC INFORMATION SYSTEMS
3
Modern GIS is an integrated system of computer software and data and information about the location and geography of things and phenomena and the relationships between them. GIS is used to interact with, manage and display geographic information.
The map below (Figure 1) is one of the earliest representations of spatial relationships and phenomena. The map is of Victorian London, produced by Dr. John Snow in 1854 (Johnson 2006) to represent the relationship between the location of cholera deaths and a water pump that he suspected of being the source of deadly bacteria during the 1840 London cholera epidemic. Snow produced this map showing the location of the Broad Street pump and other water pumps in the vicinity, as well as the points where each of the cholera victims died. By establishing that each of the residences that drew water from the Broad Street pump was also the location of a cholera death, Snow proved the source of the contamination. This is a wonderful early example of mapping spatial (location) and temporal (timing) relationships between things, in this case pumps and residences, and phenomena, deaths and drawing water.
GIS was first computerized in the 1960s (GIS.net 2010) as an effort to automate the landscape planning process of separating design influences, such as hydrography, vegetation, soils and ownership boundaries, into different layers. The approach before computerization was to draw each of the layers to scale on a separate page of acetate and then physically recombine them by stacking the pages in order to visualize different aspects of a proposed design. In the ensuing decades, GIS has matured into an enterprise-class technology platform that allows users to model the spatial relationships between and among many important aspects of our complex world.
Before the specifics of how GIS is being applied to facility management are discussed, it is
important to review some of the core concepts that define what a GIS is and how it works to better understand how this technology complements and extends other technologies that support the needs of facility managers.
3.1 GIS Basics
There are five basic core concepts of GIS: • GIS has layers
• GIS provides seamless scaling • GIS attribute data is strongly typed
• There are several kinds of GIS feature classes • GIS supports topologically rich data models Each of these core concepts is further discussed below.
3.1.1 GIS Has Layers
The layers in a GIS correspond to groups of features that have similar attributes and/or behaviors. Road centerlines are a good example
GIS has matured into an enterprise-class technology platform that enables us-ers to undus-erstand spatial relationships that
are helpful to manage the complexities of facilities.
Figure 1: Dr. John Snow’s map of cholera victims living near the Broad Street pump in London, 1854
Geographic Information Systems (GIS) for Facility Management
8
of a common GIS layer. Each segment in a road centerline layer might have attributes that describe pavement width, number of lanes, speed limit or turn restrictions. A specific layer in a GIS is called a feature class. All of the features in a feature class share the same attributes and spatial reference. Traditional geospatial data layers that might be of interest to facility managers include:
• Transportation (road centerlines, edge of pavement, rail lines, airports)
• Hydrography (lakes, ponds, rivers, streams) • Utilities • Pedestrian corridors • Land use • Zoning • Parcel ownership • Aerial imagery
• Digital elevation models • Demographics
• Facility condition index (FCI)
• Performance measurement by building • Total cost of occupancy by building
The GIS data layers bulleted above are typical of traditional applications of GIS. Additional data layers specifically identifying components of the built environment, and possibly of greater interest to the facility management community, will be discussed in Part 4 GIS in Facility Management and Part 11 In-Building GIS.
3.1.2 GIS Provides Seamless Scaling
GIS provides seamless scaling from very large-scale global data to very small-large-scale local perspectives. The various scales at which GIS is useful for facility management include from global, regional and local to campus and room or space scales. At the global scale GIS can:
• Visualize patterns in portfolio performance • Symbolize portfolio elements by a key
performance indicator (KPI) and show them on a map
At the regional to local scale, GIS can tie facilities, portfolio elements and customers together into a geographic context by:
• Providing an understanding of how well the portfolio is geographically aligned with customer base
• Supporting site selection based on business demographics
• Supporting site selection based on proximity to workforce
• Optimizing work order assignments and support with routing
At the local or campus scale GIS can:
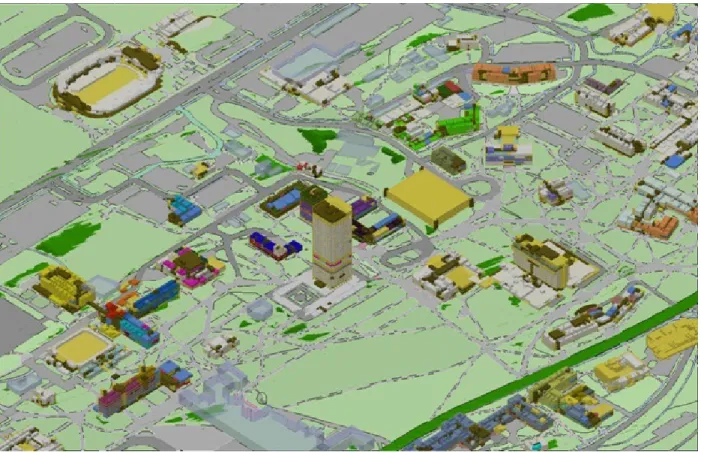
• Provide analysis and visualization of 2.5D space data across the campus
• Visualize departmental fragmentation across campuses
• Analyze relationships between office and parking assignments
• Analyze potential use conflicts
• Visualize spatial and temporal space use patterns
• Understand work order patterns and asset locations
• Spatially enable infrastructure asset inventory 2.5D refers to visualization of buildings and other models in apparent 3D that is derived from a single averaged measurement of ceiling and/or floor-to-floor heights and then used to construct generally representative building models that show length (on the x axis), width (on the y axis) and height (on the z axis) of the structure. In contrast, true 3D is an architecturally accurate building model in three dimensions. For building and construction purposes, 3D modeling is sometimes the required standard. For the vast majority of maintenance and operations purposes, 2.5D is typically adequate and it is much less expensive and time consuming to establish.
At the room and space scale, GIS can visually interact with assets, inventory and their exact locations to support regulatory, maintenance and resourcing.
3.1.3 GIS Attribute Data Is Strongly Typed GIS attribute data is descriptive data that is linked to map features. If an attribute in a feature class is, for example, of a date type, it will only accept properly formatted dates as inputs, and if it is a number type, it will not accept text characters. The result of this is strong data typing, and is ideally suited for GIS data and analysis. Unlike CAD attribute blocks where annotation is stored as all text and annotation is only loosely associated with a feature, GIS attributes are directly tied to features and all of the attributes are strongly typed. 3.1.4 Basic Kinds of GIS Feature Classes
A GIS feature class is a homogenous collection of common features, each having the same spatial representation. The most basic kinds of GIS feature classes are points, lines and areas (polygons). In recent years, however, new kinds of data have found their way into the GIS platform. As 3D becomes more important to modeling, new
Geographic Information Systems (GIS) for Facility Management
9
types of data, such as surfaces and multipatches (see Glossary), are allowing for more precise modeling of three-dimensional features.
3.1.5 GIS Supports Topologically Rich Data Models
As different components of the world were modeled digitally, it was determined quickly that things have important relationships to other things. For example, valves have important relationships to pipes when modeling how water can be delivered from one place to another. A GIS allows relationships to be built between features in different feature classes. For example, pipes in a line feature class and valves in a point feature class create more complex topological structure, such as geometric networks and transportation networks.
3.2 GIS Data Storage and Organization
The way GIS data is organized and stored makes it ideally suited for storage in database systems and for analysis. As GIS data is typically stored in a real-world spatial reference system, the analysis of the data can be applied across a campus, region, country or the world.
A few of the many different types of geospatial analyses that are appropriate on facility data might include:
• Buffer analysis – How many unoccupied offices are within 1,000 ft. (305 m) of this parking space?
• Overlay analysis – Which wet labs are within the proposed project area?
• Find ‘n’ nearest – Find the five closest assets with open work orders to this particular point. (where n represents the number sought) • Line of sight – What can be seen from this
window?
• Way finding – What is the shortest wheelchair accessible route from room x to room y? • Travel time – How many employees will have
to travel more than half an hour to get to this office location?
As the application of GIS has become more frequently used, particularly in the government arena, an enormous amount of geospatial data has been developed at a variety of scales. Much of this data is freely available over the Internet from a variety of GIS data portals like the US national geospatial data site geodata.gov.
3.3 Enterprise GIS Framework
In most sizable organizations, information
technology (IT) management has been recognized as an essential strategic asset. The modern organization can no longer exist without a secure network backbone, centralized user authentication and entitlement control, e-mail administration, enterprise database management and support for a variety of enterprise applications, like accounting, personnel management and an array of loosely connected Web applications.
Over the past decade, GIS has similarly become a recognized component of the enterprise IT suite of capabilities. GIS can now be implemented on enterprise-class databases, published through Web services and integrated with a variety of mobile device platforms. While it is certainly possible, and in some cases most appropriate, to create a stand-alone GIS on a laptop or workstation, it is important to recognize that enterprise deployment has become available over the past decade. Enterprise deployment enables GIS capabilities to be shared with a wide variety of users throughout the organization.
Furthermore, professionals that manage IT capabilities of large organizations are becoming more aware of the value that geospatial support represents to decision makers across many different departments. It is very possible that GIS already exists in an organization and it can be utilized by facility managers. For example, if your organization is in telecommunications, your engineering group may have implemented GIS to track locations and rights of way. Therefore, this technology may be only a workstation away from being available to facility managers. The same is true in many higher education settings. It is very likely that there is an academic or research GIS installation that could be accessed by facility management.
3.4 Spatial Data Infrastructure
Many geodata portals have been established over time to enable and support the sharing of geospatial data and analytical models. As this activity has become more widespread, certain best practice patterns have emerged to support this
Management professionals are becom-ing acutely aware of the value that geospa-tial support represents to the enterprisewide
Geographic Information Systems (GIS) for Facility Management
10
cooperative approach. One specific example of such a best practice is spatial data infrastructure (SDI).
Spatial data infrastructure is a framework of technologies, policies, standards and human resources necessary to acquire, process, store, distribute and improve the use of geospatial data across multiple public and private organizations. Therefore, SDI is a framework of connected spatial data, metadata and tools used to centrally manage data with tools and services connected via computer networks to various sources to make spatial data most efficient. SDI can be thought of as a shared repository of GIS layers and tools. Individuals adding data to the repository share the understanding that the contributions to the repository that are being made are generally freely available for the common good, and those who are closest to a particular layer will retain stewardship responsibilities for it.
Typically, when an SDI is to be established, the architects will begin by establishing framework layers. The landscape level of the framework will often include road centerlines, hydrography, parcels, a land use and elevation model, and some form of aerial imagery. These framework layers serve as a foundation from which other layers can be derived and to which many different kinds of business processes can be attached. For example, parcels are an important foundation layer because zoning layers usually are designed to
be coincident with parcel boundaries, and parcels are often an anchor for municipal processes concerned with taxation, permitting and public safety. Building footprints are another framework layer in SDI.
Spatial data infrastructure frameworks all have some number of similar components as described above and can be implemented on a range of scales from the most local level, such as a small town, to a virtually global scale. The most complex and comprehensive SDIs are similar to the United States’ National Spatial Data Infrastructure and the European Community’s Infrastructure for Spatial Information in Europe (INSPIRE) program. Most US states also have well-developed spatial data infrastructures that are often commonly used, regardless of community size. Disaster response and recovery is one such example. Within disaster response and recovery situations, SDI can be applied or accessed and be an invaluable tool. In the event of an earthquake, the combination of map data can be used to answer a variety of questions about where things are, ranging from collapsed bridges to operational water and sewer lines, to roadways for evacuation – all of which are components of an SDI. As demonstrated in this example, one of the most important aspects of an SDI is that it is a system for sharing information across functional boundaries, across jurisdictions and across geographic boundaries.
Geographic Information Systems (GIS) for Facility Management
11
4
GIS IN FACILITY MANAGEMENT
For years, facility managers have been using GIS at the landscape level to manage a number of the assets in their facility portfolio. Some of the earliest applications of GIS in facility management were related to pavement management at airports, municipal water and wastewater infrastructure, and electric utility distribution. For example, facility managers of the US Air Force have developed a standardized set of GIS layers to support the management of Air Force bases.
The spatial data that exists in a facility geodatabase has often been developed from aerial imagery or global positioning system-enabled (GPS) field data collection practices. The limitation of these data collection techniques is that they are blind to building interiors. Aerial photography cannot see through the roof. GPS signals are not available inside buildings. The result of these constraints has been that significant holes have developed in the rich geospatial data fabric that describes our facilities. These holes correspond to our most concentrated financial investments and the places where people spend most of their time – inside buildings.
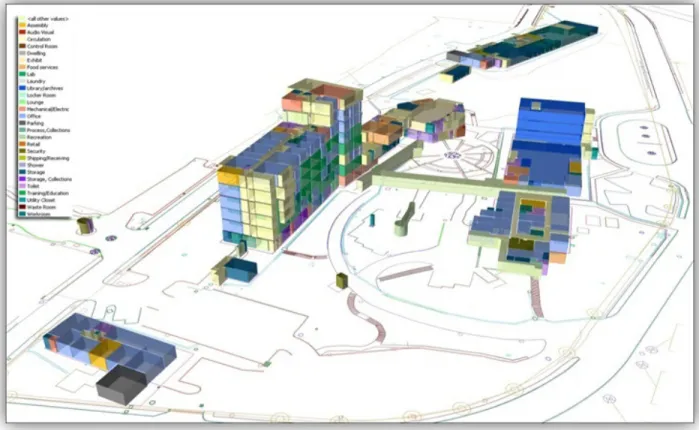
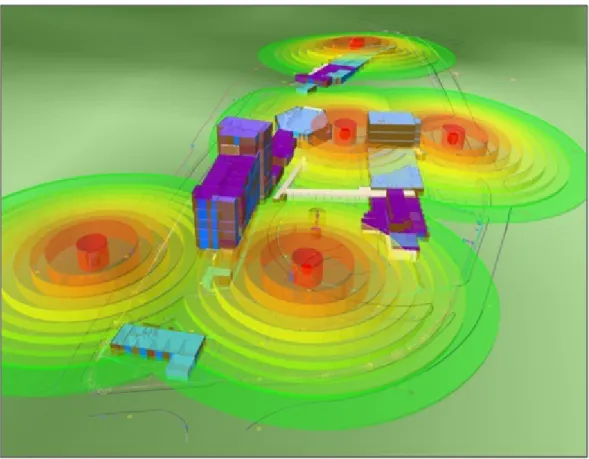
New technologies and techniques have become available to register existing information about the insides of a building, such as CAD floor plans or building information models (BIM), with the surrounding landscape-level geospatial data framework. This integration is making it possible to apply geospatial analysis and visualization to business processes that occur inside buildings. Today, it is becoming possible with GIS to think about and analyze the spatial aspects of every
component of facility management workflows to decrease cost and increase productivity. None of the enterprise applications used within the arena of facility management have advanced spatial analytic capabilities to support business processes that span geographic areas or provide complex scenario modeling that includes multidimensional visualization including 3D (space), 4D (time) and 5D (money).
GIS is a platform that supports the integration of information from all of these spatial, temporal and informational dimensions. Examples of such integrations include:
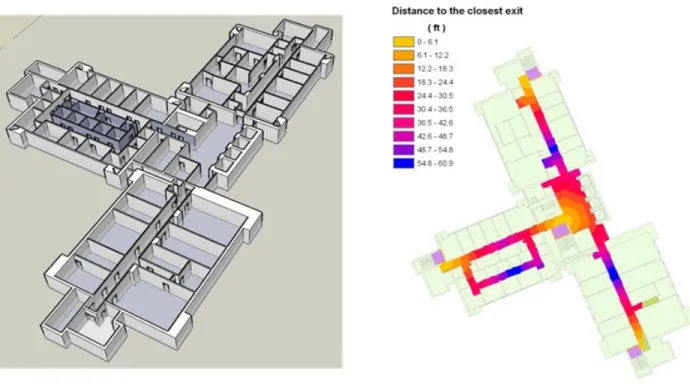
• Combining cost data with the visualization of space and occupancy across the campus • Analyzing routing barriers for disabled persons
for use during evacuation planning and emergency action planning
• Conducting visualization of energy consumption data at the room level while simultaneously managing maintenance workflows for mechanical, electrical and plumbing systems for a nationwide facility infrastructure
• Managing security concerns both inside and outside buildings, across regions and continents, simultaneously (4D) and contiguously (3D)
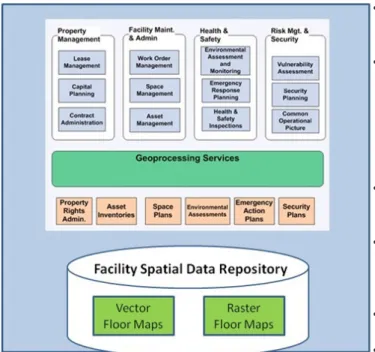
4.1 Spatial Data Infrastructure for Facilities As GIS is becoming more widely used inside buildings, facility managers are applying the insights gained from spatial data infrastructures to the spaces inside buildings. There are framework levels inside the building, just as there are
framework levels at the landscape level, such as roads and parcels. A few examples of framework layers inside a building include floor levels, walls, windows, doors and the spaces that are defined by architectural structures (Figure 2).
Once the core architectural elements of the
Significant holes have developed in the world’s geospatial data fabric – holes that represent the inside of facilities where some
Geographic Information Systems (GIS) for Facility Management
12
building have been established in the GIS, it is possible for many other layers to be derived from this foundation. Some of the layers that can be derived from basic floor plans include:
• Space use and type definitions • Lease areas
• Security zones • Management zones • Asset locations
• Evacuation collection areas • Navigable routes
Once this basic data has been added to the GIS, it is possible to provide geospatial support to a wide variety of information systems and business processes for the facility management community:
• Grouping multibuilding and multisite work orders by location to reduce transportation and logistics costs
• Visualizing energy consumption data at the room, building and/or enterprise level over time
• Analyzing space use, space availability and space optimization across campus or regional extents
• Conducting building condition assessments, fire safety inspections and asset inventories using handheld, location-aware (GPS-enabled) devices. These devices provide rapid data capture and precise location of issues, items and assets, supporting visualization, analysis and reporting.
• Analyzing and visualizing lease performance metrics across the portfolio, regardless of geographic extent
• Analyzing, route mapping and reporting of Americans with Disabilities Act (ADA) compliance and/or ADA facility and fixture availability across the campus or portfolio • Visualizing the impact of proposed building
projects on the campus environment • Conducting line of sight analysis for special
events
• Modeling the impact of proposed use changes on the supporting utility infrastructure
• Visualizing proposed space planning scenarios
In order to provide best practices guidance and support for facility managers interested in establishing facility GIS capabilities, an independent committee made up of software vendors, government users, higher education facility managers and facility managers from various levels of government formed the Building Information Spatial Data Model (BISDM)
committee in 2007. This committee has published several versions of the Building Information Spatial Data Model and continues to enhance and extend the model and its tools, making them available to the community. A diagram of the conceptual BISDM is shown in Figure 3. Further information and materials are available for download at the following Web site: resources.arcgis.com/content/ building-interior-space-data-model.
Figure 2: Spatial data infrastructure can spatially enable many enterprise systems
Geographic Information Systems (GIS) for Facility Management
13
GIS INTERGRATION WITH INTEGRATED WORKPLACE MANAGEMENT
SYSTEMS (IWMS) AND OTHERS
5
5.1 Overview
Most of this section will discuss GIS and integrated workplace management systems (IWMS) integration as IWMS most specifically apply and most often relate directly to the job functions of facility managers. GIS and IWMS are complementary technologies that, when integrated, have the ability to support the broadest range of facility management activities more efficiently and effectively than either one independently. However, the discussion is also applicable to other enterprise applications. Many of the examples given to illustrate bidirectional GIS to IWMS integration are applicable to business processes and workflows involving integration between GIS and enterprise asset management (EAM), enterprise resource planning (ERP), customer relationship management (CRM) and supply chain management (SCM) applications. These applications can all be critical to spatial data infrastructure discussed previously, and are an important part of any discussion of GIS for facility management.
5.2 Computer Aided Facility Management (CAFM) and Integrated Workplace Management Systems (IWMS)
Many facility management professionals are familiar with the acronym CAFM, which stands for computer aided facility management. Over the past few years, CAFM has become understood as a subset of an IWMS and is often described as space and occupancy. The primary driver in the growing discussion of GIS as a partner technology to enterprise applications, like IWMS, is a direct result of the market influences that drive the delineation between CAFM and IWMS: there
is an increasing adoption of a comprehensive and life cycle approach to facility management. Historically, most of the functionality within IWMS applications existed as stand-alone applications focused on very few and often only one business process or set of processes. Over time,
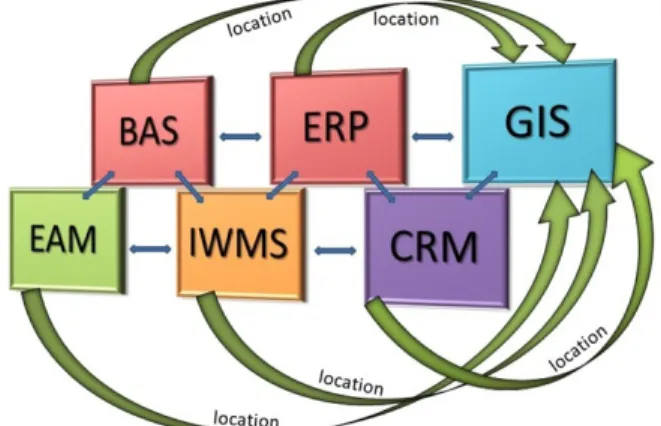
functions such as project management, project accounting, space management, maintenance management, lease management and portfolio management have been logically integrated as natural extensions of one another to become today’s IWMS (Figure 4). The primary thread that connects these functions is spatial data, or location information associated with the area of interest of each function.
If the users of an IWMS are concerned with constructing, managing, maintaining and/ or leasing a space, the common denominator is the space. A space is defined at the most basic level by its boundaries and its location. However, each function must have access to a slightly different interpretation of the space. The potential for deriving benefit from combining the various perspectives on the space is substantial. Combining building automation systems (BAS)
Spatial data is the primary thread that holds together functions such as project,
space, maintenance, lease and portfolio management.
Figure 4: GIS as a complementary technology for managing location data
Geographic Information Systems (GIS) for Facility Management
14
with cost accounting (ERP) can yield tremendous insights and efficiencies. Combining maintenance records in the enterprise asset management (EAM) system with space and occupancy information from the IWMS can support more cost-effective procurement decisions, such as the selection of materials or custodial options. The visualization and data management
capabilities of GIS and the geodatabase provide landscape-level visualization and the tools and technical infrastructure to generate and manage location data, including very precise locations, which are required for truly comprehensive and integrated management. These two components, landscape-level visualization and spatial data storage and management, in the geodatabase are core GIS functions. They are the glue used to precisely integrate disparate systems because, at its core, each enterprise system has some set of functions related to a location.
The current paradigm for interacting with building data in IWMS/CAFM applications is a combination of tabular information and a CAD-based, two-dimensional, single floor plate view. Core GIS technology adds to the IWMS/CAFM by extending beyond the individual floor plate to a visual interaction with information across multiple floors, multiple buildings, campuses, regions, countries and even globally, both within and outside of the building. Three-dimensional representations of data also become achievable with the integration of GIS.
5.3 Approaches to Integration
There are three primary GIS integration methodologies with the IWMS market: open application programming interface, the “map it” approach and fully integrated GIS/IWMS.
5.3.1 Open Application Programming Interface Within an open application programming interface (API) model, the data within the IWMS application is made available for use and integration with the GIS through an open API. This is essentially a “here it is, come and get it” approach. This approach requires custom GIS application development in order to take advantage of the data in both the GIS and IWMS applications. This requirement generally requires the end user to develop the interface and tools for interacting with the IWMS data from within the GIS framework. The primary advantage of this approach is that it is infinitely flexible.
5.3.2 “Map It” Approach
The next model is the “map it” approach, in which the GIS data is made available to the IWMS user through a separate but semi-integrated window launched from the IWMS application. The window is designed to look and feel like the host application, but does not appear to be a part of the core IWMS application. The map viewer launches as a separate window when the user asks to see the map, instead of as part of the core application as a single integrated interface. Typically, this approach is used only for visualization of a point on the map representing facility locations and is not a true application of GIS capability to drill down into layers of information. Furthermore, this approach does not generally support bidirectional transfer of information between the IWMS and the GIS.
5.3.3 Fully Integrated GIS/IWMS
A fully integrated GIS/IWMS solution provides geographic information within native application windows so users do not recognize that they are interacting with a GIS. Rather, they simply have access to location data and a geography-based user interface (a map) that seamlessly ties together tabular and location data to provide a comprehensive view. There are many levels at which the map interface supports traditional workflows, such as maintenance management, space management, asset management and others, to take advantage of the landscape-level context provided by the GIS.
5.4 Market Organization
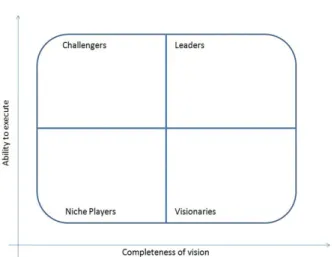
While functionality within IWMS applications varies widely among vendors, it is helpful to frame this discussion with an understanding of Gartner, Inc’s Magic Quadrant for Integrated Workplace Management Systems (2008) (Figure 5) within which Gartner cited four broad categories of functionality provided by IWMS applications: construction project management, real estate and portfolio management, facility and space management, and maintenance management. Since 2008, the IWMS market has started to place substantial emphasis on sustainability. We will therefore include environmental sustainability and management as a fifth category in our discussion. Gartner cites the phenomena discussed in Sections 5.3 to 5.5 as driving growth, competition and functionality within the IWMS market. GIS technology has a great deal to offer each of the five general categories of functionality, as well as
Geographic Information Systems (GIS) for Facility Management
15
the market drivers identified by Gartner. The extension of the IWMS interface from a tabular, flat, single floor perspective into a graphically rich, multidimensional and
geographically distributed model has implications on usability, reach and general usefulness for the IWMS platform that directly addresses the majority of the market drivers identified by Gartner for the IWMS market. Each of these areas of functionality can specifically be enhanced through GIS integration.
5.4.1 Project Management
Within the Magic Quadrant, Gartner calls project management “construction project management.” For the purposes of this discussion, the more generic term “project management” will be used to avoid any confusion of terminology. While construction project management is obviously a topic worthy of in-depth consideration, and GIS can add value to construction project management when multiple projects are being managed
simultaneously at multiple sites, this paper is focused more on the type of project management that occurs throughout the facility life cycle after construction is complete and the owner or manager has taken control of the property. This makes sense because approximately 80 percent of the total cost of ownership of any facility lies in operations and maintenance, which is post construction.
GIS adds value to the CAFM/IWMS portfolio when businesses are undertaking comprehensive management of the facility life cycle. GIS can add value in the process from site selection to decommissioning, including renovation, scenarios and studies, moves, acquisitions, disposals and
other applications. GIS provides a permanent repository of building data, originating in CAD and BIM files developed during construction, which can be vital for efficient management of the hundreds and thousands of projects that take place each year across the asset portfolio. GIS is unique because it has the ability to consume spatial data from a multitude of sources, including CAD/BIM data, and integrate it with the IWMS application for efficient, highly productive and cost-effective workflows.
One example of how GIS can be used for project management is a retailer with a rapid construction or renovation program with multiple, geographically dispersed facilities. GIS can provide value in determining which regions can logistically support the variety of workflows that are critical to maximizing revenue through streamlined and efficient construction, while maintaining quality standards and minimizing the risks associated with materials and other resource logistics, thereby determining which regions are suitable for expansion. Three other common uses of GIS for project management include:
• Analysis and planning for impact of
construction, materials warehousing and traffic interruptions
• Efficient resource allocation and materials sourcing
• Regional, national and global logistics management
5.4.2 Real Estate and Portfolio Management As with the examples above, real estate and portfolio management for a geographically distributed portfolio presents unique challenges that can be addressed, at least in part, by the application of GIS technologies. An excellent example of this is the integration of sophisticated site selection workflows utilizing demographic data, like gender, income level and spending patterns, as well as infrastructure analysis, to determine consumer and/or employee drive times or competitor locations relative to proposed locations. GIS for real estate and portfolio
management can be used at the campus, regional or global portfolio level, or for site selection. This GIS query, analysis and reporting capability is an excellent resource for managing cannibalization and analyzing competitive footprint.
Another of the unique ways to understand what geographically distributed means is in the vertical
Geographic Information Systems (GIS) for Facility Management
16
plane. Traditionally, maps and GIS are thought of as horizontally distributed landscapes. Yet, for multistory buildings included in real estate portfolios today, the GIS capability of managing and organizing multilocation information for analysis and decision making in a combined interface of 2D, 3D and 4D interaction provides a unique understanding and empowers effective management for maximizing portfolio value.
CoreNet Global, a professional association for corporate real estate and workplace professionals, service providers and economic developers, has a community of practice focused on strategy and portfolio planning. In spring 2010, this group conducted a survey of the 80 members of the community about what technologies they use for portfolio planning. Twenty-two percent indicated that they utilized GIS. This outcome was higher than the technology subcommittee, the group who created the survey, expected. While 22 percent may not be a very large number, many of the organizations represented on the committee are global organizations with complex, dispersed real estate portfolios, and the members of the committee tend to be progressive adopters of new and highly effective technologies. This group of industry trendsetters indicates that GIS is becoming a core component of their facility management strategies.
5.4.3 Facility and Space Management
Facility and space management application user interfaces have traditionally been conceived as containing single floors represented as a flat, two-dimensional floor plate from which information is derived and on which various business processes or workflows are applied. This floor plate
perspective of facility management made sense: • When the only technology that IWMS
applications could draw base building geometry data from was CAD applications • Within a technology framework that could
not support the visualization of, or the manipulation of, more than a single floor in a single building at a time
For workflows that span multiple buildings, campuses, regions or beyond, the single floor plate view with associated tables of data is inadequate for the purpose of understanding, analyzing and managing these distributed geographic views, also called extents in GIS parlance.
Space and occupancy management, space optimization and rationalization, departmental grouping and/or distribution are all business processes that are best served by a visual interface that spans the landscape. In a campus environment, the ability to see the distribution of departmental staff in three dimensions across multiple buildings can greatly enhance a manager’s ability to organize resources for the greatest productivity. In city- or regionwide corporate environments, where there is a requirement for facility consolidation, the ability to thoroughly analyze the attributes of various locations can be a competitive advantage. A competitive advantage can result by ensuring that the new location best serves the needs of customers, employees and suppliers. In addition, GIS or IWMS/GIS can be used as a facility and space management tool for space optimization, facility rationalization and move management. 5.4.4 Maintenance Management
The value of GIS for maximizing efficiency, productivity and cost savings has long been proven in the areas of delivery, routing and logistics for services and transportation across a variety of industries. Both within and among buildings the same efficiencies can be achieved in the area of maintenance management with an integrated IWMS/GIS solution. The IWMS can track and notify maintenance staff about weekly, monthly or annual schedules. The GIS tracks the location of the items to be maintained and helps staff combine work orders from different schedules with identical or proximal locations. This can help to drastically reduce the time and resources expended to complete maintenance and work orders. In addition, GIS routing analysis and recommendation reduce both the time and resources wasted in transit by optimizing travel routes between and within structures for more efficient, cost-effective work order completion. Additionally, GIS can be used for real-time coordination and dispatch of resources for
maintenance and repair responses that fall outside of regular schedules. This real-time capability becomes even more valuable when deployed in emergency scenarios that require rapid sharing and dissemination of location-based information. To summarize, GIS or IWMS/GIS can be used for routing, visualization of multicalendar workflows and real-time dispatch based on proximity of resources, as well as other functions, to improve maintenance management efficiency.
Geographic Information Systems (GIS) for Facility Management
17
5.4.5 Environmental Sustainability and Management
Sustainability is generally understood as the measurement, management and reduction of energy consumption and carbon emissions/ carbon footprint for reducing environmental impact and operating expenses. The influences driving interest in these reduction efforts lie in ever-increasing energy costs and phenomena, such as global warming and growing public awareness of environmental issues, that increasingly motivate many consumers to favor companies and
institutions with positive environmental records. In the past few years, some IWMS platforms have developed specific sustainability and management functionality in response to these trends. GIS adds value to these tools, especially when:
• Sustainability interests span multiple buildings and across portfolios
• Visualization and visualization analysis can be used to display sustainability metrics, especially when 3D modeling can be used Building automation systems (BAS) and energy management systems (EMS) can be effective tools to address sustainability issues. They are also one of the more complicated facility management systems as they combine an extremely broad array of data, including energy usage and cost; mechanical, electrical and lighting systems operation, including efficiency and device monitoring for operation, maintenance, energy consumption and failure; occupancy complaint monitoring; and lighting controls both inside and outside of buildings; and usually including an e-mail and/or phone notification system. This complex array of data types and sources can result in a dizzying amount of information that needs to be assimilated and managed in order to be an effective system. In this scenario, GIS can provide a platform for real-time visual access to information from an intuitively comprehensible view of the building, campus plan or regional portfolio map. GIS also supports a variety of integration points to other systems, such as triggering a work order in the enterprise asset management (EAM) system and monitoring weather patterns or emergency services networks for information that may affect building systems operations.
The U.S. Green Building Council (USGBC) Leadership in Energy and Environmental Design (LEED) certifications have recently grown to
include LEED for Neighborhood Development (LEED-ND), which attempts to set standards for sustainable, environmentally responsible development of new and in-fill parcels ranging in size from less than 2 to more than 12,000 acres. An IWMS may be fully capable of managing sustainability programming on a single building basis, but a GIS integrated with an IWMS may be needed to effectively visualize and manage the volume and variety of data types that result when sustainability programming spans multiple buildings and sites. An integrated GIS/IWMS allows information about building interiors and the landscape-level environment to be combined. Additionally, the visualization capabilities of the GIS can be harnessed to illustrate an institution’s environmental sustainability activity as part of an effective public relations and marketing program to attract new customers, clients, students and other interested parties.
In summary, GIS or GIS/IWMS can be used to help achieve sustainability goals because they provide a means for:
• Campus- and portfoliowide query, analysis and reporting on environmental issues for combined building interior and landscape-level environments
• Optimization of energy performance by identifying performance outliers through integration with BAS and EMS
• Conservation and protection of traditional environmental resources, such as water, open space and flora, as part of comprehensive environmental programming, including combined building and campuswide energy consumption
• Reduction of impact of materials and operations on building sites and the environment
5.5 Market Drivers
Gartner also defines eight IWMS market drivers that can be positively impacted by GIS:
• Facility real estate consolidation and portfolio rationalization
• Globalization
• Life cycle management approaches • Enhancement of user experience
• Business continuity and disaster recovery • Compliance with US government legislation • The future of GIS and IWMS
Geographic Information Systems (GIS) for Facility Management
18
5.5.1 Facility Real Estate Consolidation and Portfolio Rationalization
The use of GIS can help answer questions about how to best consolidate property portfolios. Some of the risks involved in large-scale facility consolidation lie in the potential disconnect between the seemingly simple numerical analysis of multiple sites and the thorough understanding of the applicability of a site for a given function. GIS can answer questions about drive times for employees and suppliers; proximity to infrastructure, such as power, water and/or transportation; and demographics related to qualified workforce and/or customer base. 5.5.2 Globalization: Requiring a Worldwide Portfolio View
Landscape-level intuitive presentation of
information is a core feature of GIS. In a business climate with complex, globally distributed
facility portfolios it is no longer adequate, or even possible, to manage, analyze and report on facility yield and productivity without taking into consideration the ramifications of location. Intuitive, visual interaction with demographics, population concentrations, and growth/decline trends, all of which are core GIS data, support appropriate distribution of facilities to meet supply chain and sales models better than tabular representation of complex numerical models. 5.5.3 Life Cycle Approach to Facility and Real Estate Management
The life cycle approach to facility and real estate management includes planning, project management, leasing and operations. The life cycle approach to facility and real estate management is the primary influence behind the other market drivers discussed within this section. A life cycle management approach is a growing area of concern, especially in difficult economic climates where organizations are planning to keep existing buildings longer, rather than undertake new capital expansion projects. Site selection; construction project logistics management; space and occupancy analysis; accurate lease representations; and facility maintenance, redevelopment and decommissioning all have associated geographic (location) interests. Facility and real estate management is more efficient, more easily understood and managed, and more cost effective when managed within a comprehensive technology that compares and contrasts complex data about the environment or
landscape where the facility exists.
5.5.4 Requirements to Enhance the User Experience
The experience of using an IWMS application can be enhanced by increasing usability and accessibility. One of the cornerstones of GIS is the ability to organize and visually present information in an intuitive format that provides users with the ability to efficiently access the data that is important to them, and then to easily, iteratively query, analyze and report on an infinite number of combinations. Whether simply locating a building, room or asset, or performing complex analysis of resource allocation, the visual map afforded by the GIS is a vastly improved way of interacting with and understanding information as compared with traditional tabular and two-dimensional interfaces.
5.5.5 Business Continuity and Disaster
Recovery
Business continuity and disaster recovery require the identification of backup sites, employee locations and critical infrastructure in the event of local or regional business interruption. In many ways, business continuity and disaster recovery for business are quite similar to many of the concerns of public safety professionals. In both cases, the requirement is for rapid or immediate access to information about people, places and things to ensure that the emergency response team can operate safely and effectively in the face of events often out of their control. A first order of business in both situations is to determine where things are and how to best allocate and relocate resources to and from the affected locations. GIS is a primary tool of public safety professionals because a GIS can be used to prepare “what if” scenarios, providing a snapshot of all of the information needed to effectively manage a situation when it occurs, along with the ability to rapidly present new combinations of information as needs arise.
5.5.6 Compliance With US Government Legislation
Section 404 of the Sarbanes-Oxley Act of 2002 mandates adequate and effective internal control and procedures for financial reporting. The Act requires a comprehensive audit and inventory of assets that must include location data for verification and validation of asset condition and accounting. While it is not always necessary
Geographic Information Systems (GIS) for Facility Management
19
to visually interact with asset-level data (i.e., visually mapping the location of assets), having the ability to exactly locate assets during audits or fraud investigations is of critical importance. The geodatabase, which is the core, underlying component powering the GIS, is the only way to effectively store and manage this location data. This is an excellent example of a purely geolocation data management aspect of GIS that does not necessarily require a visualization platform.
5.5.7 GIS and the Future of the IWMS Sector The application vendors who address all of the categories listed above most comprehensively are generally the most successful in the market. Additionally, they are located in the top, right quadrant within the Gartner Magic Quadrant. Many of the IWMS vendors, including most of those clustered in the upper right quadrant, have begun to address GIS integration. Furthermore, Gartner appears to be starting to think about GIS integration as an important value-added functionality in the IWMS market. The next time the Gartner Magic Quadrant study is released it may be quite different. It will be very interesting to see if and how Gartner describes GIS and how it might rate each vendor in their approach in the new Magic Quadrant. It is anticipated it will be released during the 2010 calendar year.
When the 2008 Magic Quadrant was published it does not appear that either Gartner of any of the IWMS vendors were thinking about GIS integration and functionality as a differentiating and competitively advantageous product
component. (Note: All statements about the future of the Magic Quadrant are analysis of the market by the authors, and should not be assumed to be representative of any other individual’s or organization’s opinion or perspective, especially that of Gartner, Inc. or its analysts).
5.5.8 Other Enterprise Integrations With GIS While integrated workplace management systems (IWMS) strive to combine all major facility functions into a single platform, there are many organizations that must maintain multiple facility-related applications. Reasons for this could include, but are not limited to, that they are considered best-in-class or because they are legacy systems. Legacy systems could be too disruptive or expensive to migrate. As with IWMS, other enterprise applications are concerned with
the management and storage of information about resources that have a location component. In this scenario, GIS can help unify multiple facility systems when all of the functions covered by this variety of applications cannot be consolidated into a single IWMS solution. The GIS can be effectively integrated with other applications to maintain location data and to support enterprise business processes, allowing a broader variety of information and phenomena to be accounted for than in any one application alone.
There are multiple applications that can be integrated with GIS through an enterprise approach:
• Building automation systems (BAS) and energy management systems (EMS) • Customer relationship management (CRM) • Enterprise asset management (EAM)/
computerized maintenance management systems (CMMS)
• Enterprise resource planning (ERP) • Supply chain management (SCM)
Building automation systems (BAS) are control systems that consist of devices used to monitor, control and manage mechanical and electrical systems within a building (ASHRAE 2010). Some integrated BAS include lighting; heating, ventilating and air conditioning (HVAC); and security and fire alarm. Many commercial buildings today have BAS. Most BAS include dynamic graphics of systems, equipment, valves, meters and sensors, as well as static graphics of floor plans of areas serviced. In most cases, the BAS graphics are not integrated with enterprise facility management systems. Thus, the data from a BAS is often inaccessible to other applications. Additionally, there is not a direct, dynamic link between floor plan graphics within the BAS and electronic CAD or BIM files. (It should be noted that linking BIM files with BAS is a very new application that is still in development.)
It is possible that GIS could serve as a common platform for visualization, centralization of data and analysis for disparate BAS systems with IWMS. The common denominator would be the location of spaces and buildings.
In addition to providing control of systems and equipment, BAS can be used to trend operations and energy consumption data. Future applications of GIS could be integrated with BAS to help