Analysis of dental caries using
generalized linear and count
regression models
Profesor dr. S. B. Javali M. Phil
USM-KLE International Medical School, Karnataka, India
Profesor dr. Parameshwar V. Pandit
[email protected] Bangalore University
Abstract
Generalized linear models (GLM) are generalization of linear regression models, which allow fi tting regression models to response data in all the sciences especially medical and dental sciences that follow a general exponential family. These are fl exible and widely used class of such models that can accommodate response variables. Count data are frequently characterized by overdispersion and excess zeros. Zero-infl ated count models provide a parsimonious yet powerful way to model this type of situation. Such models assume that the data are a mixture of two separate data generation processes: one generates only zeros, and the other is either a Poisson or a negative binomial data-generating process. Zero infl ated count regression models such as the zero-infl ated Poisson (ZIP), zero-infl ated negative binomial (ZINB) regression models have been used to handle dental caries count data with many zeros. We present an evaluation framework to the suitability of applying the GLM, Poisson, NB, ZIP and ZINB to dental caries data set where the count data may exhibit evidence of many zeros and over-dispersion. Estimation of the model parameters using the method of maximum likelihood is provided. Based on the Vuong test statistic and the goodness of fi t measure for dental caries data, the NB and ZINB regression models perform better than other count regression models.
Key words: GLM, Poisson, Negative Binomial, ZIP and ZINB regression models, over-dispersion, zero-infl ation, DMFT Index data.
Introduction
Distinguishing characteristic studies of epidemiology of dental caries data set invariably use the DMFT index (decayed (D), missing due to caries (M)
and fi lled (F)) permanent teeth (Klein et al 1938) to measures the degree of caries experience of a subject or population. It is the sum of simple count of the number of Decayed Teeth (DT), Missing Teeth (MT) due to caries and Filled Teeth (FT), which represents the cumulative severity of dental caries experience. In such studies, the mean DMFT has been commonly quoted for the total sample and used as a measure to compare the caries experience between subgroups. This comprised of data measuring subjects with caries (DMFT>0) and subjects without caries (DMFT=0), counts of DMFT or discrete population densities.
In dental epidemiology, one often wishes to explore the relationship between the expected response of an individual and a number of factors that are likely to infl uence the response simultaneously. The studies related to such relationships fall into criteria of linear regression and logistic regression models, which describes both quantitative and qualitative factors that are present. Moreover, these can be studied together as a special case of a unifi ed theory. In these cases, where the response can be assumed to be approximately normally distributed, the mean response itself is modelled to depend linearly on the infl uences of the factors resulting in the unifi ed theory of Linear Models. The ideas of the theory of Linear Models can be extended to the case where the response has distribution which belongs to the regular exponential family. In this case an appropriate link function of the mean response is modelled linearly on the infl uences of the factors resulting in the theory of Generalized Linear Models. The earlier studies reported in the literature, suggested that DMFT index data usually fulfi lled the normality assumption. Hence, multiple linear regression (MLR) models were commonly used to estimate the infl uence of covariates. In a vast majority of the studies, the caries data are analyzed by using traditional multiple linear regression techniques which assume that dental caries indices follow normality assumption (Dummer et al.1990, Angellio et al. 1990, Venobbergen et al. 2001, Javali et al. 2001, 2003, 2004; Javali and Pandit, 2007).
It has been observed that the worldwide prevalence of dental caries, especially in the developed and developing countries (Downer, 1998) has declined rapidly during the last 20 years. Thus, the data of DMFT index has become highly positively skewed (Spencer, 1997) due to effect of high proportion of zeros. Various investigators have proposed some techniques to transform data making the normality assumption more approximate either untransformed or in any transformed state. However, numerous models have been described by various authors to describe the nature of distribution of DMFT index data. Grainger and Ried (1954) suggested that the negative binomial distribution is the better and satisfactory model for dental caries; Turlot et al. (1984) proposed a model based on a Poisson distribution; Pandit and Javali (2007) used GLM’s with different built in link functions and Fabien et al. (1999) initiated the generalized linear models with Poisson distribution to compare the caries indices.
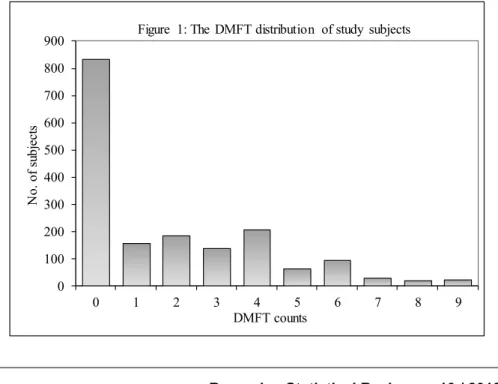
The tendency of DMFT index data contains an excess zeros (Figure 1), it does not perfectly fi t the some standard distributions (e.g. Normal, Poisson, Binomial, Negative Binomial etc.) and referred to as zero infl ated (Heilbron, 1994, Tu, 2002) because of number of extra zeros caused by the real effect on caries distribution of interest and it is a special case of overdispersion (McCullagh and Nelder, 1989; Hinde and Demetrio, 1998; Poortema, 1999). It creates problem while making a sound statistical inference by violating the basic assumptions implicit in the utilization of the standard distributions and misinterpretations of the variance-mean relationship of the error structure (Berry and Welsh, 2002). In overcoming the problem of overdispersion, several researchers Lawless (1987), Famoye (1993), and Lawsey et al. (2007) employed NB and GP regression models instead of Poisson regression model; Pandit and Javali (2007) suggested both GLM’s and ZI models for modelling dental caries count data. Over dispersion has the tendency to increase the proportion of zeros and whenever there are many zeros relative to Poisson assumption, NB and Generalized Poisson (GP) regression models tend to improve the fi t (ΪIknur and Felix, 2007). If there are many zero counts in the distribution of DMFT data set, two states may be assumed to better refl ect the situation. One of the states is the zero state (zero DMFT count) and others state is the non-zero state (non-zero DMFT count or counts greater than zero). The probability of the zero state and the mean number of the event counts in the non-zero state may depend on the covariates.
In recent years, there has been considerable interest in using the applications of ZI model to fi t count data in order to allow for the presence of many zeros and over dispersion in a discipline like Medicine (Campbell et al. 1991, Ghahramani et al. 2001, Chaung 2002) and countable number of studies were found with zero infl ated models in public health scenario by Yip (1991), Johnson et al. (1992), Fong and Yip (1993), BÖhning et al. (1999) and Lewsey & Thomson (2004). In this article, the Generalized Linear models, Poisson, Negative Binomial, ZIP and ZINB regression models used to model DMFT count data set and results of these models were compared.
Study area, Population, Sampling procedure and Clinical
examination
The present study was carried out in Dharwad, Karnataka, India, which is one of the famous educational centers in North Karnataka, South India. Systematic random samples of 1760 permanent dentition aged between 18-40 years were selected. The mean age of the study subjects was 34.26±7.28. The dental caries examinations were conducted by two well qualifi ed dentists with standardized and widely accepted procedure recommended by the WHO
report on oral health (WHO, 1990). Before actual study, a pilot study was conducted on a convenient sample of 100 individuals for assessment of inter examiner reliability and it was found to be 0.9865. Besides the data on DMFT index, the data are also collected on various characteristics (i.e. Age (in years), Socio Economic Status, Food habits, Frequency of sweet consumption, Frequency of brushing, Methods of brushing, Rinsing habit, Smoking habit, Chewing habit and Alcohol habit).
Count Regression Models and Parameter Estimation
As can be seen in Figure 1, the distribution of DMFT index markedly skewed with the majority of the subjects having a low score and a minority with high scores. About 52.50% of subjects presented without any sign of caries experience. Hence, we are more away from the traditional multiple linear models, but these characteristics fi t the various generalized linear models. We initiated the generalized linear model for dichotomized (DMFT=0 and DMFT≠0) as a response on a set of covariates.
The random variable Y with observations yi (i=1,…,n), where yi>0, and repressors xi and the Poisson regression model is given by
!
)
(
i y i iy
e
y
Y
P
i
i
where yi=0,1,… andln
i
x
i. In Poisson model, the mean of the distribution is equal to the variance i.e. E(Yi)Var(Yi)i. The details of the Poisson regression model are given in Frome et al. (1973) and Frome (1983). The Poisson regression model is usually restrictive for count data, leading to alternative model like the NB regression model. One way this restriction manifests itself is that in many applications a Poisson density predicts the probability of a zero count to be considerably less than is actually observed in the data. This is termed excess zeros problem, as there are more zeros in the data than the Poisson predicts. More obvious way that the Poisson is defi cient is that for a count data, the variance usually exceeds the mean, a feature called over-dispersion. If there is signifi cant over-dispersion in the distribution of the count, the estimates from the Poisson regression model will be consistent, but ineffi cient. The standard errors in the Poisson regression model will be biased downward. This situation could lead the investigator to make incorrect statistical inferences about the signifi cance of the covariates. The NB regression model provides an alternative to the Poisson regression model. The NB regression model has been used to deal with only overdispersion (Lawless, 1987). Therefore, a statistical test of overdispersion is highly popular after fi tting a Poisson regression model.The standard form of the NB distribution used in regression applications specifi es that li = li(xi). The standard form includes the dispersion parameter
α and the conditional variance function, which is quadratic in the mean. The NB regression model with the mean E(Yi) = li and variance Var(Yi)=li(1+αli) is given by Lawless (1987) as ,..., 1 , 0 , 1 1 1 ) ( ! ) ( ) , , ( 1 1 1 ¸¸ ¹ · ¨¨ © § ¸¸ ¹ · ¨¨ © § * * i i y i i i i i i y y y y P i DO DO DO D D D O
where Γ(·) denotes the gamma function and the dispersion parameter α is unknown. In the limit as α goes to 0,
P
(
i,
,
y
i)
yields the Poisson regression model. When α > 0, there is overdispersion.Sometimes there are many zeros in the count dependent variable than are predicted by the Poisson regression model, resulting in an overall poor fi t of the model to the data. Zero-infl ated count (ZIP and ZINB) regression models address this problem of excess zeros. For count data with more zeros than expected, several models have been proposed, for example the hurdle model (Mullahy, 1986), the ZIP regression model (Lambert, 1992), the two-part model (Heilbron, 1994), the semi-parametric model (Gurmu, 1997). Details of these models are also given in Ridout et al. (1998). The ZINB regression model has been proposed by Heilbron (1994) and Ridout et al. (2001).
If Yi are independent random variables having a zero-infl ated count distribution, the zeros are assumed to arise in two ways corresponding to distinct underlying states. The fi rst state occurs with probability pi and produces only zeros, while the second state occurs with probability (1- pi) and leads to the Poisson, NB count with mean li. In general, the zeros from the
fi rst state are called zeros and those from the second state are called non-zeros. Consider discrete nonnegative random variable Yi with a zero-infl ated count distribution, where pi and li denote respectively the proportion of zeros and the mean in the Poisson and NB distribution. The distribution of Yi is given as
0 ), ( ) 1 ( 0 ), 0 ( ) 1 ( ) P(Yi ! i i i i i i i i i y if y Y P p y if Y P p p y
The overall probability of zero count is a combination of probabilities of zeros from each state, weighted by the probability of being in that state, i.e.
p
i
(
1
p
i)
P
(
Y
i
0
)
, whereP
(
Y
i
0
)
is a Poisson or NB probability with zero event that occurs by chance. On the other hand, the probability of positive counts is given byp
i
(
1
p
i)
P
(
Y
i
y
i)
, whereP
(
Y
i
y
i)
is thePoisson or NB probability with positive counts. Therefore, combining these probabilities of zeros from each state, called zero infl ated count regression models. The Probability functions; mean and variance of the ZIP and ZINB regression models are explained and given by ΪIknur Ö. and Felix F (2007).
In the count regression model, the response variable had a nonnegative integers follows a Poisson or NB distribution. Parameters in the count regression models are estimated by ML method starts from the construction of log-likelihood functions (L). The parameter estimates in Poisson NB and Zero Infl ated regression models by using method of ML explained by Frome (1983) and Famoye (1993). We used the STATA (2006) count outcomes “zip and zinb” to obtain the ML estimates of the parameters.
The goodness of fi t of the count regression models for model selection can be based on the log-likelihood chi-square statistic. We use this to measure the goodness of fi t of the regression models. The regression model with the smallest value of the statistic, among the regression models considered, is usually taken as the best model for fi tting the data. The NB regression model reduce to the Poisson regression model when α = 0. To assess the signifi cance of the dispersion parameter, we test the hypothesis H0: α = 0 against H1: α ¹ 0. Whenever H0 is rejected, it is recommended to use the NB regression model in place of the Poisson regression model. The Vuong test is available for testing the validity of the ZIP model against the alternative or standard model (Vuong, 1989). More precisely, the Vuong statistic for testing the Zero Infl ated models against the standard models. Choose a critical value from the standard normal distribution that corresponds to the desired level of signifi cance. If Vuong statistic i.e. v is greater than 1.96, then the ZIP (ZINB) model is accepted. If Vuong statistic i.e. v is smaller than -1.96, then the Poisson (NB) model is accepted. A statistical signifi cance was set at 5% level of signifi cance (p<0.05)
Comparisons of Models
In this section, the DMFT count data set is analyzed. To understand how the different regression count models fi t to the DMFT counts. The results of comparisons interms of parameter estimates are carried out for generalized linear model, Poisson, NB, ZIP and ZINB regression models are presented in Table 1.
First, we consider the GLM for the dichotomous DMFT counts. Based on the Log likelihood chi-square (Table 1), the GLM model does not provide an adequate fi t to the DMFT count data. Secondly, the Poisson and Negative Binomial models fi tted to the data, the negative binomial model displays
smallest LL chi-square and provides an adequate better fi t compared to GLM and Poisson model to the DMFT count data set. The observed proportion of zeros is 52.50% for the data, but Poisson model predicts a proportion of zeros as 29.94%, which is an under estimation of the observed proportion of zeros. In such a situation, it would be appropriate to estimate the ZIP and ZINB regression models. We apply the Vuong test to checkout the ZI regression models statistically preferred over the Poisson and NB regression models. To test for zero infl ation, the value of the Vuong statistic of ZIP model over standard Poisson model is calculated as 19.7900. This value is signifi cant at 5% level of signifi cance when compared to the Z0.05 =1.9600. It means that, the Vuong statistic provides evidence that many zeros are observed for the Poisson distribution. Although ZIP model appear to offer substantial improvement in fi t and does better in predicting the zeros over standard Poisson model. However, the ZINB regression model is a signifi cant improvement in fi t over NB regression model. The value of the Vuong statistic is calculated as 11.5000. This value is signifi cant at 0.05 level when compared to the Z0.05 =1.9600. Although the ZINB regression model appear to offer substantial improvement in fi t and does better in predicting the zeros over standard NB model (Table 1). The ZIP and ZINB regression coeffi cients are also quite similar in magnitude, but different from GLM, Poisson and NB regression coeffi cients; the standard errors for the ZIP and ZINB regression coeffi cients tend to be smaller than those obtained from GLM, Poisson and NB regression coeffi cients.
The LL chi-square for the GLM, Poisson, NB, ZIP and ZINB regression models are, respectively, 828.1681, 615.3800, 172.3200, 224.8600 and 188.8400, which also indicate that modeling overdispersed data using NB and ZINB regression models are better than the GLM, Poisson and ZIP regression models.
Further, there is a signifi cant negative impact of socio economic status, frequency of brushing, rinsing habit on DMFT counts in GLM, Poisson and NB regression models. It means that, these covariates are supporting to increase the zero DMFT counts. But, the positive and signifi cant infl uence of frequency of sweet consumption and alcohol habit was observed on DMFT counts in the same models. It means that, these covariates are decreases the zero DMFT counts. When zero infl ation, the covariates like age (in years), frequency of sweet consumption, alcohol habit have negative and signifi cant relationship with DMFT counts. However, the covariates such as socio economic statuses, frequency of brushing and rinsing habit have signifi cant and positive relationship with DMFT counts in the ZIP and ZINB regression models. But the covariate like methods of brushing had a signifi cant and positive relationship with DMFT counts in Poisson and NB regression models.
Conclusions and Discussions
While mislead the results of single model fi t to the data summarizes can sometimes or single model fi t summarizes can sometimes be misleading. Indeed for the dental caries as an application presented in this article. Hence, the application used in this paper involves the estimation of GLM, Poisson, NB, ZIP and ZINB regression models to predict the dental caries. Since count data frequently exhibit overdispersion in addition to possible zero infl ation, an obvious methodology is to use a model that can accommodate over dispersion and zero-infl ation. Unlike the seeming excess of zeroes, given the covariates, wrong conclusions can be reached and different models (ZIP, ZINB) should be considered in terms of both zero infl ation and overdispersion situation alternatives to the standard models (Poisson and NB). The ZINB model is a competitor to the ZIP regression model when there is both overdispersion and zero infl ation. For this reason, we apply the ZINB regression model for modeling overdispersed DMFT data with many zeros. Although the DMFT data has about 52.50% observed proportion of zeros, our results in section showed that the GLM, Poisson and ZIP regression models are not appropriate for fi tting it. However, the NB and ZINB models provide a better fi t. Thus, overdispersion in the DMFT counts can be a result of unobserved heterogeneity. Based on the fi ndings shown, the NB and ZINB regression models seem to perform better than the GLM, Poisson and ZIP regression models.
0 100 200 300 400 500 600 700 800 900 0 1 2 3 4 5 6 7 8 9 N o. of s ubj ec ts DMFT counts
Results of fi tting GLM, Poisson, NB, ZIP and ZINB regression models Table 1 Variables Generalized Linear
regression
Poisson
Regression RegressionNB RegressionZIP RegressionZINB Constant (0.5569)-8.4372 (0.3385)*-1.0789 (0.5410)*-1.0879 (0.8384)-0.2814 (0.5250)-0.2184 Age (in years) (0.0022)0.0036 (0.0011)*0.0072 (0.0022)0.0072 (0.0036)*-0.0072 (0.0022)*-0.0044 Socio Economic Status (0.0246)*-0.0833 (0.0131)*-0.0630 (0.0252)*-0.0471 (0.0418)*0.2230 (0.0259)*0.1409 Food habits (0.0559)0.0393 (0.0293)*0.1453 (0.0570)*0.1628 (0.0867)-0.0429 (0.0542)-0.0236 Frequency of sweet consumption (0.0241)*0.0925 (0.0131)*0.0779 (0.0277)*0.1221 (0.0457)*-0.2491 (0.0276)*-0.1502 Frequency of brushing (0.0876)*-0.1934 (0.0471)*-0.3183 (0.0907)*-0.3534 (0.1294)*0.3638 (0.0812)*0.2294 Methods of brushing (0.0600)-0.0515 (0.0300)*-0.1243 (0.0655)*-0.1141 (0.0918)0.0790 (0.0569)0.0493 Rinsing habit (0.0229)*-0.0625 (0.0118)*-0.1548 (0.0248)*-0.1603 (0.0381)*0.1345 (0.0235)*0.0811 Smoking habit (0.0818)0.0649 (0.0453)*0.3172 (0.0864)*0.3375 (0.1365)-0.0427 (0.0850)-0.0232 Chewing habit (0.1558)0.0853 (0.0984)*0.3347 (0.1558)0.2298 (0.2295)-0.0692 ( 0.1444)-0.0426 Alcohol habit (0.1548)*0.3448 (0.0973)*0.8981 (0.1540)*0.8675 (0.2310)*-0.5087 (0.1452)*-0.3110 Estimated dispersion parameter - - (0.0872)1.3638 (0.0170)*0.0216 Log likelihood -1487.8138 -3697.7482 -3128.1390 -2909.0390 -2908.4030 Log likelihood chi-square 828.1681 615.3800 172.3200 224.8600 188.8400 Vuong statistic - - - 19.7900 11.5000
*Signifi cant at 0.05% level. Standard errors of estimates are presented in parenthesis.
Selevtive bibliography
- Klein H, Palmer CE.andKnutson JW.(1938), Studies on dental caries: I Public Health Report 53, P. 751 765
- Venobbergen J, Martens L, Lesaffre E, Bogaerts K, Decleack D. (2001), Assessing risk indicators for dental caries in primary dentition. Community Dent Oral Epidemiol 29, p.424-34.
- Javali SB, Tippeswamy V, and Prasad KVV and Jithendra A. (2003), Importance of risk factors in dental caries experience and dental plaque. Journal of Pierre Fauchard Academy 17(2), p.51-54.
- Javali SB. and Pandit PV. (2007), Use of the Generalized Linear Models in Data Related to Dental Caries Index, Indian Journal of Dental research 18(4), p. 163-167.
- Downer MC. (1998), The changing pattern of dental disease over 50 years. British Dental Journal 185, p. 36-41.
- Spencer AJ (1997), Skeweddistributions-new outcome measure. Community Dent Oral Epidemiol 25. p. 52-59.
- Heilbron, D.C. (1994), Zero-altered and other regression models for count data with added zeros. Biom. J. 36, p. 531–547.
- Tu W. (2002), Zero infl ated data. In: Encyclopedia of environmetrics (eds El-Shaarawi A. H. and Piegorsch W. W.). John Wiley and sons, Chichester.
- Mccullagh P, Nelder JA. (1989), Generalized linear models, 2nd Eds. Chapman and
Hall, London.
- Hinde J. and Demetrio CGB. (1998), Overdispersion: Models and estimation: Computational statistics and Data Analysis 27, p.151-170.
- Barry SC & Welsh AH, (2002), Generalized additive modelling and zero infl ated count data. Ecol. Model, 157, p. 179–188.
- Lewsey JD. and Thomson WM. (2004), Utility of the Zero Infl ated Poisson and Zero Infl ated Negative Binomial models: a case study of cross sectional and longitudinal DMF data examining the effect of Socio-economic status, Comm. Dent; Oral Epidemiol. 32; p. 183-189. - ΪIknur Ö. and Felix F. (2007), Count Regression models with an Application to Zoological Data containing Structural Zeros. Journal of Data Science 5, p. 491-502.
- Ghahramani, M., Dean, CB. & Spinelli, JJ. (2001), Simultaneous modelling of operative mortality and long-term survival after coronary artery bypass surgery. Stat. Med., 20, p. 1931–1945.
- Chaung YB. (2002), Zero infl ated models for regression analysis of count data: a study of growth and development, Stat Med 21, p. 1461-1469
- Johnson, NL. Kotz S. and Kemp AW. (1992), Univariate discrete distributions, 2nd
edition, Wiley, New York.
- Fong DYT and Yip P. (1993), An EM algorithm for a mixture model count data. Statist. Probab. Lett. 17, p. 53-60.
- Bohning D, Dietz E, SchlattmanP, Mendonca L, Kirchner U (1999), The zero infl ated Poisson model and the decayed, missing and fi lled teeth index in dental epidemiology. Journal of Royal Statistical Society, Series A, 162; p. 195-209.
- WHO (1997),Oral health surveys. Basic Methods. WHO Geneva.
- Frome EL. (1983), The analysis of rates using Poisson regression models. Biometrics 39, p. 665-674.
- Lambert D. (1992), Zero-infl ated Poisson regression with application to defects in manufacturing. Technometrics 34, p. 1-14.
- Heilbron, DC. (1994): Zero-altered and other regression models for count data with added zeros. Biometrical Journal 36, 531-547.
- Gurmu S. (1997), Semi-parametric estimation of hurdle regression models with an application to Medicaid utilization. Journal of Applied Econometrics 12, p. 225-242.
- Ridout, M. Hinde, J. and Dometrio, CGB. (2001), A score test for testing a zero infl ated Poisson regression model against zero-infl ated negative binomial alternatives. Biometrics 57, p. 219-223.
- Vuong, QH. (1989), Likelihood Ratio Tests for Model Selection and Non-nested Hypotheses, Econometrica, 57(2), p.307-333.