Aspect-Based Sentiment Analysis Approach with
CNN
Budi M Mulyo & Dwi H Widyantoro
School of Electrical Engineering and InformaticsInstitut Teknologi Bandung Bandung, Indonesia
[email protected], [email protected] Abstract—Lots of research has been done on the domain of
Sentiment Analysis, for example, research that conducted by Bing Liu's (2012) [1]. Other research conducted in a SemEval competition, the domain of sentiment analysis research has been developed further up to the aspect or commonly called Aspect Based Sentiment Analysis (ABSA) [2]. The domain problem of Aspect Based Sentiment Analysis (ABSA) from SemEval is quite diverse, all of those problems arise mostly from the real data provided. Some existing problems include Implicit, Multi-label, Out Of Vocabulary (OOV), Expression extraction, and the detection of aspects and polarities. This research only focuses on classification aspect and classification of sentiment. This study uses an existing method of Convolution Neural Network (CNN) method, which was introduced again by Alex K. The study by Alex K reduces the error rate by 15%, compared in the previous year the decrease was only 5%. This research would like to propose CNN methods that have been optimized, and use Threshold (CNN-T) to select the best data in training data. This method can produce more than one aspect using one data test. The average result of this experiment using CNN-T got better F-Measure compared to CNN and 3 classic Machine Learning method, i.e. SVM, Naive Bayes, and KNN. The overall F1 score of CNN-T is 0.71, which is greater than the other comparable methods.
Keywords—Aspect Classification; Sentiment Classification; Deep Learning; Multi-label; Multi-Class; Convolutional Neural Network
I. INTRODUCTION
The development of Machine Learning technology is growing rapidly. This development still promises better results, for example Deep Learning. Deep Learning is a concept that relies on features taken from the data. In 2012, Alex K managed to prove that Deep Learning can produce stunning results [3]. Deep Learning in his research uses Convolutional Neural Network (CNN). With those stunning results, many researchers (Google, Stanford, et al) who want to experiment further.
From the SemEval research team in 2014 only two research teams used the Deep Learning method, and the results of the two teams were not good enough [4]. In 2012, Deep Learning represented by ConvNet in 2012 produced a better model but with a different problem domain. The results of ConvNet [3] give the reduction of error results quite drastically. This result compared to previous years, the difference reach 15%. The
developments in 2012 and 2014 should be better, but this is not as expected. Other studies say that this is a matter of improper feature selection that has decreased performance from the previous year [4].
The problem of Aspect Based Sentiment Analysis (ABSA) from SemEval is quite diverse, all of those problems arise mostly from the real data provided. Some existing problems include Implicit, Multi-label, Out Of Vocabulary (OOV), Expression extraction, and the detection of aspects and polarities. The dataset provided is quite implicit because data is taken from real world data with a professional annotator. Multi-labels also become a problem because the dataset in 1 sentence has several different classifications [12]. These different classification problems require separate handling to be solved. The next problem is OOV, this problem is about how the given model can handle the test data which is not in the data during training. In the ABSA competition issue, one of the tasks assigned is Expression extraction. But extraction problem is not explained in this study because the dataset is quite implicit. Aspect and Polarity classification is a major problem in this ABSA competition, this problem is how to conduct training model to classify aspects and polarities.
The classification commonly used for aspects and sentiments is each test data only produces one aspect or sentiment of output. Even though the fact that the sentence can contain several aspects or sentiments. This is the problem that we want to solve with the proposed method. This study also aims to produce a better F-Measure than existing methods, namely CNN and classic Machine Learning.
II. RELATED WORKS
A lot of research on sentiment analysis has been done, as in Bing Liu's research (2012) [1]. Research outside of SemEval competition to solve the ABSA problem also performed, for example by Taylor (2013) and Susanti Gojali(2016).
Research conducted by Taylor's based on the research by Liu which both use the extraction rule method [14]. The data obtained comes from the scrapping result from TripAdvisor, which contains the dataset Restaurant and Hotel. The results of this study indicate that product reviews contained on the website can be extracted using the Aspect-Based Opinion Mining method. But in the explicit aspect extraction process, it only results in 35% aspect extraction of the whole.
Another study conducted by Susanti said that the sentiment of analysis carried out on documents and sentences did not represent the wishes of the reviewers [15]. Processing at the document level and sentence has not conveyed the polarity of the aspects to be conveyed. This research comes from the construction of extraction rules from grammar, or usually called rule-based. If the dataset has bigger size will be more difficult to extract the aspect, because not all syntax for aspect and sentiment model could be extracted. For example, if there is a word “no” in front, opinion in behind the word, and the length of the sentence is 10, then this method can’t catch this negative value. To improve the results, the deeper rule-making can improve the extraction. But it takes a manual process to capture the aspects that exist in grammar. This manual process requires the of understanding one by one every sentence and lot harder. Their research based on rule-based for extraction, that needs to do a fairly complex manual process which also conducted by other researchers [13], [14], [15], [18], and [19]. Their research also raised ABSA issues, such as Aspect Extraction, Subjectivity Classification and Sentiment.
Recent studies have begun to implement CNN methods into Sentiment Analysis [10], [11]. Research from Kim who conducted several experiments, states that CNN can produce better results than other methods [10]. One of the advantages discussed in his research is that the vector words that have been trained can improve the quality of the model results. Their process also carried out experiments in domain sentiment analysis and question classification.
The most recent result of a successful Sentiment Analysis research is the Recursive Neural Tensor Network (RNTN), which focusing to overcome the problem of negative polarity sentences [9].The accuracy of predicting fine-grained sentiment labels for all phrases reaches 80.7%, an improvement of 9.7% over the bag of features baselines. This process produce good results, it also because supported by a training model of a Sentiment Treebank. This Sentiment Treebank has a label for each parse tree, which is used for in-depth analysis of the composition effects in sentences. But this study does not use RNTN because of the unstructured dataset.
The results of the CNN-T model are also compared to the classic Machine Learning method, to find out whether the results of this model are better than the existing methods. The methods to be used in classic machine learning are SVM, KNN, and Naive Bayes. SVM uses hyperplane to split between dimensions to select the appropriate class. KNN uses proximity to points to decide class selection. And Naive Bayes uses the co-occurrence and probability functions to find out the appropriate classes.
III. ARCHITECTURE MODEL
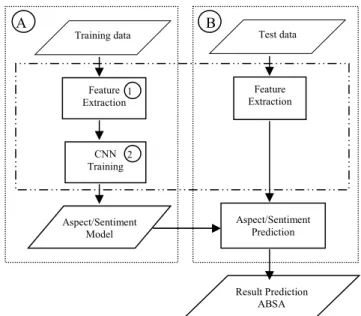
The architecture used has two main processes, namely Modeling and Prediction. Modelling is the architecture that constructs model Aspect and model Sentiment. Different prediction processes were performed on the aspect model and sentiment model. Prediction on aspects is how the aspect model classifies each aspect of the sentence, while the prediction in the sentiment model aims to classify sentence polarity. Fig. 1 illustrates more clearly about the architecture used, from the
input data test and training process, up to the prediction. Area A, is a data training process, Area B is a Prediction process. In this illustration also illustrated that in the middle of the process, there is a process for feature extraction with dashed lines.
The proposed model uses basis of the developed CNN method. This CNN-T model (the proposed model) is a model that collects the output of the CNN training process by taking trade-offs from the correct data and incorrect data. Output the training data is collected according to the label, then selects the best trade-off threshold that separates the correct data and incorrect data. In this way, it could generate more than one class output for one input.
Fig. 1. The Architecture used for handling ABSA problem. A. Modelling
The main problem with ABSA is to classify aspect and sentiment, so that trained model has two models to tackle this problem, namely aspect model and sentiment model. Both models are trained with the same data but each uses a different algorithm. The modeling process consists of two processes, namely Feature Extraction and Convolutional Neural Network (CNN). Feature Extraction is processing to get a feature that exists in the sentences. And CNN reprocesses these representations, to get richer features to fit with labels. The main function in modelling process is to get the optimal representation from sentences in each attribute.
This modeling process includes separating sentences with labels in their respective attributes. Attributes for each dataset is differ depending on the respective domain. If dataset training and dataset test have the different aspect, then this process cannot produce a correct result. The class attribute cannot produce the correct results because there is a possibility that class attributes are not represented during training.
This modelling process consists of two main processes, namely Feature Extraction and Training data with CNN. Feature Extraction is a process to extract training data into the process of construction data in the form of word vector. The
Feature Extraction Aspect/Sentiment Model Aspect/Sentiment Prediction Result Prediction ABSA Training data Feature Extraction CNN Training Test data A B 1 2
word vector representation for Word Embedding is not constructed from training data. Construction Embedding words require a larger collection of data so that the representation process with existing training data is not enough [4], [6]. The next process is CNN Training which performs reprocessing of representation to take the feature from more varied features.
1) Feature Extraction.
Feature Extraction is a process of converting sentences into vectors that represent them. This extraction feature uses Word Embedding as a library which helps representation of sentences. Word Embedding used is Glove from data train on Wikipedia and Twitter domains. The Glove is a library to represent every word with a collection of vectors. Each word in the architecture produces a representation value of 100 vectors, and for each sentence, it will be assumed consist of 100 words for each sentence. If there is a word that is less than 100, it will be padding filled with zero. So every representation of each sentence, yields for outputs that have dimensions of 100 * 100.
2) CNN Training.
The next process is CNN Training, namely Processing Text Representation with the CNN method. As explained earlier, Input data representation of sentences is received by CNN in the form of vector representation. The initial process for training data is split vector representation of each vector with their respective labels. CNN training also needs to be optimized with hyperparameters that must be trained several times to produce optimal parameters.
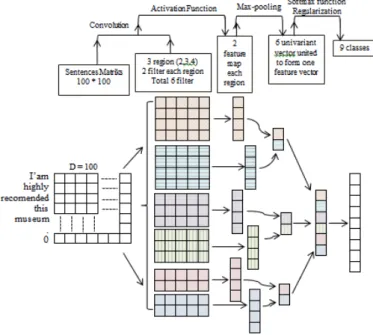
The Architecture used in this research based on the CNN algorithm as shown in Fig. 2 [10]. This architecture uses 100 * 100 vector representations as inputs, and the output is (1) generates multi-class outputs for aspect modeling or (2) generates binary classes for sentiment modeling. In this illustration, convolution uses two layers for filters and each layer has 3 regions and 2 filters, while in the real architecture uses the optimal values for each model (aspect / sentiment).
Fig. 2. CNN for the classification of sentences.
Each convolution has its own activation, but all layers in convolution process use the same activation. The activation used in the layers is ReLU which produces the same value as the input, except if the input value is less than 0 then the output is 0. Then the next process is max-pooling which produces a smaller vector. After the process, all the results are combined and represented in the 1 vector. Next process is final activation to generate a representation of each class attribute. The activation used are between softmax or sigmoid, depending on the model that wants to construct. This illustration uses 9 aspect attributes, thus the results output consists of 9 values. Another option can generate one value which is the largest value of all 9 attributes.
The initial process performed for each dataset is almost identical, that process isinitializing the attributes for each dataset. Then the next process is the extraction of attributes from the label that has been initialized. Next process enters the training data CNN and performs several times the experiment to produce the optimal hyperparameter [10]. Hyperparameter in question are Filter, Filter Size, Max Pool Size, Drop Out, Epoch, and other parameters. The final activation used is (1) softmax for multi-label classification or (2) Sigmoid for binary classification. Activation produces values in their respective attributes or classified in a class. If generating one value, the closest from its class (binary) of the attributes of will be selected.
The output of this architecture is (1) class name / attribute name or (2) collection of values for a number of attributes. For model CNN-T the output used is the multi-class value. A number of output attributes represent attributes in data training, and class names / attribute names are classification outputs that are automatically selected by the system. All output data from a “set of values for a number of attributes” if combined can visualize the exact results according to the label or not, and choose a better threshold to classify the class (Fig. 4).
The basic process of training this architecture is the Convolution. Equation 1 can simplify the concept of convolution. Convolution is a mathematical process of two functions, which produces a new function that modifies one of these functions. Implementation of Convolution as dull matrix multiplication algorithm asin the equation 1.
The symbol (f) and symbol (g) of the formula are functions, functions (g) which are the inputs and function (f) as filters. With symbol (t) that explains how many times the process is done. Symbol (∞), is an input symbol that can be started from any value that has a positive value up to negative. The last result is the multiplication of function (f) and function (g).
Softmax is an activation that is suitable for the aspect model, which has multi-label attributes. This aspect model can generate an output value of a number of attributes, or class name / attribute name from the largest attribute value.
The results sentiment model has two attributes, positive and negative attributes. These two attributes are very different from (1)
the aspect model. For the aspect model, it has a multi-class attribute. The output of the sentiment model yields only one value, a value ranging from 0 and a maximum value of 1. Sigmoid activation that produces two maximum values, a value of 0 and a value of 1 are two distinct classes. If the value is close to 0, it can be said that the value goes to class 0 and vice versa for class 1. The Threshold from default system for selecting a class is 0.5. If using CNN-T, the threshold value used depends on the exact data in the original training model and the label results.
B. Prediction
The last process is prediction and get the distribution results for each aspect then this process uses the threshold to classify. This threshold process is different in the sentiment model and aspect model.
Aspect Classification Model takes the biggest attribute value (CNN model). As for the sentiment model to choose the closeness between classes 0 and 1, the threshold used is 0.5. If it is closer to the number 0 then the selected class is class 0, and vice versa for class 1 (CNN Model).
The proposed models is the CNN-T model, which provides a threshold for classify the output. The threshold used is the intersection of each aspect, between the data being correctly fetched and the data being fetched but incorrect. As well as the sentiment model, takes the threshold value that intercepts between data retrieved correct and incorrect. An example is shown in fig. 4 and a detailed explanation is in the subsection.
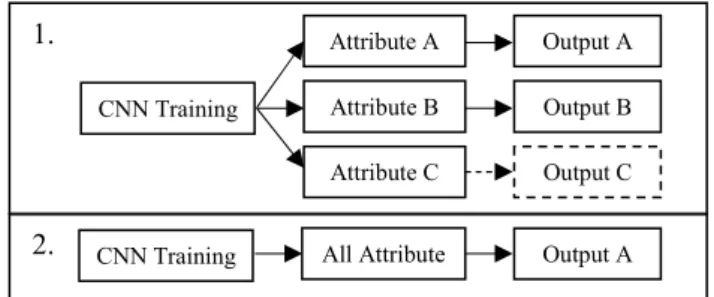
Fig. 3. Illustration of different methods from CNN and CNN-T.
Illustration in Fig 3 part 1 is CNN-T model and second illustration (part 2) is CNN model. CNN training output (CNN-T method) looks for thresholds derived from trade off all data training to classify classes. If it is larger than the threshold then classified to it class. The CNN model classifies data into a class attribute by comparing the value of the attribute generated. Shown in Fig. 3, the illustration1could produce 2 outputs or more, i.e. A and B. If Fig. 3 part 2 Output C has a value lower than the threshold, then this sentence is not classified into that class (class C). The CNN model automatically classifies class attributes with the largest attribute values, so this model cannot classify more than one class.
Because input the for training data is a sentence, then the process for prediction is also used a sentence. This study does not focus on the sentiment of defined aspects. This research focuses on making an optimal model, then compared with other comparison models. In short, models that are generated from
aspect and sentiments can stand on their own, regardless of each other's models.
IV. EXPERIMENT
This experiment shows only the optimal solutions training data. The purpose of this study is not only to produce a good classification, but also to produce a better F1 score than the comparable method. Classic Machine Learning is optimized according to each parameter. The library used is Scikit-learn [16], [17] which also determine optimal parameter value. The next sub-section will explain how the scenario is run and the result of classification report from the experiment.
A. Scenario Experiment
There are three methods of Machine Learning that used in comparison, there are Support Vector Machine (SVM), Naive Bayes (NB), and K-Nearest Neighbors (KNN). The final result of this study is the comparison of each method using F-Measure as the balance value between Precision and Recall. Dataset Test retrieved for domains ABSA from SemEval 2015 which only used English-language datasets. This research used 2 datasets that different each other. First, the dataset that has the dataset training and test. Second, the dataset that only has the test dataset with a distinct domain. The reason for using the SemEval dataset 2015 because of the annotation process is quite difficult. In the annexation dataset SemEval requires 3 annotators. The first annotator is BRAT (Stenetorp et al., 2012), while the second annotator is tasked with validating the results. When the second Annotator disagrees or unsure of the first Annotator, then there will be decision making by a joint discussion with a third annotator.
This study also tried to conduct experiments to optimization by providing a threshold on the value of model aspects and sentiments. Each Threshold is derived from the exchange of classified data retrieved by the system that correct and incorrect. The value taken is the value that optimizes both data, so that correct data is more retrieved by minimizing the wrong data that retrieved.
B. Test Results
Fig. 4 is an example of data visualization that consists of the entire data, true data, and false data to retrieve the best value. The x-axis is the value made by the system, while the y-axis is the number of occurrences of data. The value generated by this system is taken from the training process which gives
Fig. 4. The Threshold of the restaurant features. Attribute A Attribute B Attribute C Output A Output B Output C All Attribute Output A CNN Training
CNN Training
2. 1.
output values between 0 and 1. The green line is the correct data distribution while orange line is the wrong data distribution. Blue line is the overall data, where the data in the visualization has been interpolated by the visualization application. So the data distribution has a value below 0 and a value above 1 that is impossible on the data.
From Visualization (Fig. 4) explain how this data distributed, whether this distribution produces better results or not. Fig. 4 is a visualization representation of how the distribution of data represents for each process. In Figure 4, the data is distributed between classes 0 and 1 in a balanced manner and the intersection of the lines in the middle with small numbers, then this model must provide a better F1 value. Balanced distribution produces better F1 value, because the trade-offs taken will be smaller between the correct data and the wrong data. Fig. 4 is the best balanced visualization, while the remaining visualization is pretty much out of balance.
Test results consist of two main models: Aspect Model and Sentiment Model. The assessment data used for theoptimal model is the training data itself. Although the results of training data are good, the results of the data testing can be different.
Table I in the aspect column, the results from CNN and SVM are almost equally good. CNN is a little better than SVM on this restaurant dataset. While the result of laptop dataset, SVM slightly better 0.03 from CNN-T. Abbreviation description for F1 is for F-Measure.
TABLE I. F1ASPECT AND SENTIMENT
F1 Restaurant Laptop
Aspect Sentiment Aspect Sentiment
SVM 0.64 0.72 0.54 0.77
NB 0.58 0.69 0.49 0.78
KNN 0.56 0.69 0.45 0.75
CNN 0.66 0.72 0.52 0.80
CNN-Ta 0.66 0.77 0.53 0.80
a.CNN-T. (CNN using threshold for each attribute) Bold score is the highest score
Table 1 in the aspect column for restaurant datasets and laptop datasets has a small F1 value, between 0.4 and 0.6. This small F1 value is caused by the learning model with (1) limited data and (2) implicit data.
Threshold results for Aspect Model with Restaurant dataset with Ambience, Drinks, Food, Location, Restaurant, and Service order are as follows: 0.1546, 0.066, 0.342, 0.037, 0.164, and 0.1736 respectively. From the set Threshold, the data distribution is not centralized (correct data and incorrect data). The optimal trade-off from threshold is not guaranteed to get a better result of the test data. As seen from table I the results of CNN-T are still better than CNN.
Threshold results of the CNN-T method for Aspect Model on Laptop dataset are better than CNN model. Thresholds of sequential aspects from Connectivity, Design_Features, General, Miscellaneous, Operation_Performance, Portability,
Price, Quality, and Usability are as follows 0.0429, 0.13, 0.42, 0.0766, 0.15575, 0.029, 0.0753, 0.13075, and 0.138 respectively. Almost the same as the Threshold Dataset Restaurant, the distribution of the existing data is not completely separate close to the values 0 and 1 but is spread over the side to one side.
Table I in the sentiment column, shows the results from the sentiment model of the CNN model better than other models. The CNN-T model produces a better F1 than the overall model for Restaurant dataset and has a big difference with other models.
The results from CNN-T for Restaurant sentiment are better than the CNN results because of the trade-off distribution that managed to take a more appropriate Threshold. The Threshold Sentiment Restaurant chosen for CNN-T is 0.73, this shows that the sentiment distribution of class 0 exists between 0.5-0.7.
The results of restaurant and laptop sentiments are almost similar although the restaurant sentiment dataset has considerable difference Threshold values between CNN and CNN-T. The Threshold used by CNN-T is 0.713, and the Threshold of CNN is 0.5. The threshold for the laptop dataset from cnn shows that class 0 is wider (class 0 from 0 to 0.713), and class 1 is in the position of 0.713-1.
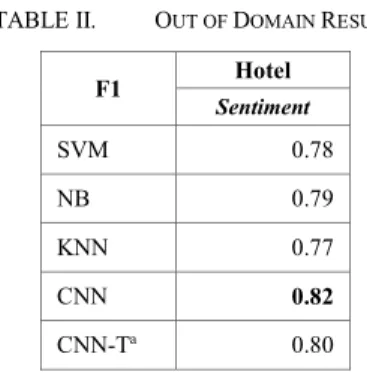
The results of those models are more focused on the one domain, then SemEval competition raises the other problem that is Out of domains. The competition for this out of domain is provided data test without training data, then the goal is to test this domain with a pre-built model. But Out of domain cannot be implemented into aspect models, only for sentiment models. Because of the different aspects, the aspect model can’t be utilized to test the aspect model performance. So the test dataset can only test for the sentiment model. The test dataset for Out Of Domain issues comes from the Hotel test dataset. Training dataset for Out Of Domains comes from restaurant datasets and laptop datasets.
TABLE II. OUT OF DOMAIN RESULT
F1 Hotel Sentiment SVM 0.78 NB 0.79 KNN 0.77 CNN 0.82 CNN-Ta 0.80
a.CNN-T. (CNN using threshold for each attribute) Bold score is the highest score The results in table II (Out of Domain Result) are not different from the results from the table I, where the CNN and CNN-T models still provide better results. The sentiment results in table 1 overall are better than the aspect models. Implicit data sets make it harder to do a good classification. But, for sentiment with features that only consist of two parts, it could give better rate results.
EVALUATION AND DISCUSSION
The CNN-T model can extract more than 1 aspect from 1 sentence, the example will be discussed in this section. One example of the sentence is like in sentence 1.
Gorgeous place ideal for a romantic dinner
Sentence 1 should have the label “Ambience” and “Restaurant”. The comparison model that will be discussed here is the CNN model, because this model has similarities with the CNN-T model. The CNN model managed to extract only the “Restaurant” aspect, so that for each sentence only one aspect was obtained. While the CNN-T model succeeded in extracting the correct aspects of “Ambience” and “Restaurant”. The CNN-T process is successful because the sentence produces values that in both aspects exceed the threshold (explained in section III, predictions).
The CNN-T model has the same basis as CNN, so the lack of data and sentences that have implicit properties can reduce the possibility of producing correct aspect predictions.
Excellent food, although the interior could use some help.
The label that should be in sentence 2 are “Ambience” and “Food”. The CNN model produces only one aspect extraction, namely “Food”, but the CNN-T model produces two models namely “Food” and “Service”. The CNN model is less precise because it only produces one extraction, the CNN-T model is also wrong because it produces correct and incorrect aspects of the two extraction results.
CONCLUSION
The average result of CNN-T from 5 experiments got the best F1 which is 0.71, compared to the other methods, namely CNN (0.7), SVM (0.69), NB (0.67) and KNN (0.64). These results prove the difference between CNN-T is not much different than other compared method. But the CNN-T model has the advantage of being able to extract 1 sentence that has several aspects.
Deep Learning which is represented by CNN and CNN-T gets better results, because the process of capturing the features obtained can take better representation than the classical machine learning method. Deep Learning is very useful for large and complex datasets, with methods that perform calculations in each subsequent layer.
The approach used in Deep Learning provides better results compared to the Classic Machine Learning model. From the entire table I, the CNN-T approach provides fairly good results in general. For a more in-depth assessment of CNN and CNN-T comparisons, the dataset requires greater validation or dataset variation. Although the model of Deep Learning(CNN and CNN-T) is on average only about 0.5 for aspects and 0.8 for sentiment, this result is quite satisfactory with fairly implicit data and little training data.
REFERENCES
[1] B. Liu, “Sentiment Analysis and Opinion Mining,”. Synthesis Lectures on Human Language Technologies, vol. 5, no. 1, pp. 1-167,May 2012. [2] M. Pontiki, D. Galanis, H. Papageorgiou, S. Manandhar, I.
Androutsopoulos, “SemEval-2015 task 12: Aspect based sentiment analysis”, Proceedings of the 9th International Workshop on Semantic Evaluation (SemEval 2015), 2015.
[3] A. Krizhevsky, I. Sutskever, and G. E. Hinton, “Imagenet classification with deep convolutional neural networks,” in Advances in neural information processing systems, 2012, pp. 1097--1105.
[4] B. Wang, M. Liu, “Deep Learning for Aspect-Based Sentiment Analysis”, pp. 1-9, 2015.
[5] R. Collobert, J. Weston, L. Bottou, M. Karlen, K. Kavukcuoglu, and P. Kuksa, “Natural Language Processing (Almost) from Scratch,” J. Mach. Learn. Res., vol. 999888, pp. 2493--2537, 2011.
[6] T. Mikolov, K. Chen, G. Corrado, J. Dean, “Efficient estimation of word representations in vector space”, 2013, [online] Available: https://arxiv.org/pdf/1301.3781v3.pdf.
[7] J. Pennington, R. Socher, C. D. Manning, "Glove: Global vectors for word representation", The 2014 Conference on Empirical Methods in Natural Language Processing (EMNLP), 2014.
[8] C. Manning, M. Surdeanu, J. Bauer, J. Finkel, S. Bethard, and D. McClosky, “The Stanford CoreNLP Natural Language Processing Toolkit,” ACL (System Demonstrations), pp. 55–60, 2014
.
[9] R. Socher, A. Perelygin, J. Wu, J. Chuang, C. D. Manning, A. Ng, and C. Potts, “Recursive deep models for semantic compositionality over a sentiment treebank,” in Proceedings of the 2013 conference on empirical methods in natural language processing, 2013, pp. 1631--1642.
[10] Y. Zhang and B. Wallace, “A sensitivity analysis of (and practitioners’ guide to) convolutional neural networks for sentence classification,”
arXiv preprint arXiv:1510.03820, 2015.
[11] Y. Kim, “Convolutional neural networks for sentence classification,”
arXiv preprint arXiv:1408.5882, 2014.
[12] W. Bi and J. T. Kwok, “Multilabel Classification with Label Correlations and Missing Labels.,” in AAAI, 2014, pp. 1680–1686. [13] T C Chinsha, Shibily Joseph, “Aspect based Opinion Mining from
Restaurant Reviews”, International Journal of Computer Applications, pp. 0975-8887.
[14] E. Marrese-Taylor, J. D. Velásquez, F. Bravo-Marquez, and Y. Matsuo, “Identifying Customer Preferences about Tourism Products Using an Aspect-based Opinion Mining Approach.,” in KES, 2013, vol. 22, pp. 182–191.
[15] S. Gojali, M. L. Khodra, “Aspect Based Sentiment Analysis for Review Rating Prediction”, ICAICTA, 2016.
[16] F. Pedregosa, G. Varoquaux, A. Gramfort, V. Michel, B. Thirion, O. Grisel, M. Blondel, P. Prettenhofer, R. Weiss, V. Dubourg, and others, “Scikit-learn: Machine learning in Python,” Journal of Machine Learning Research, vol. 12, no. Oct, pp. 2825--2830, 2011.
[17] L. Buitinck, G. Louppe, M. Blondel, F. Pedregosa, A. Mueller, O. Grisel, V. Niculae, P. Prettenhofer, A. Gramfort, J. Grobler, R. Layton, J. VanderPlas, A. Joly, B. Holt, and G. Varoquaux, “API design for machine learning software: experiences from the scikit-learn project.,”
CoRR, vol. abs/1309.0238, 2013.
[18] D. Ekawati and M. L. Khodra, “Aspect-based sentiment analysis for Indonesian restaurant reviews”, 2017, International Conference on Advanced Informatics, Concepts, Theory, and Applications (ICAICTA), Denpasar, 2017, pp. 1-6.
[19] Z. Fachrina and D. H. Widyantoro, “Aspect-Sentiment Classification in Opinion Mining using the Combination of Rule-Based and Machine Learning”, 2017, International Conference on Data and Software Engineering (ICoDSE), Palembang, 2017, pp. 1-6.
(1)