Chapman University Digital Commons
Chapman University Digital Commons
Computational and Data Sciences (PhD)Dissertations Dissertations and Theses
Spring 5-2020
Integrated Machine Learning and Bioinformatics Approaches for
Integrated Machine Learning and Bioinformatics Approaches for
Prediction of Cancer-Driving Gene Mutations
Prediction of Cancer-Driving Gene Mutations
Oluyemi Odeyemi
Chapman University
Follow this and additional works at: https://digitalcommons.chapman.edu/cads_dissertations
Part of the Other Computer Sciences Commons Recommended Citation
Recommended Citation
O. Odeyemi, "Integrated machine learning and bioinformatics approaches for prediction of cancer-driving gene mutations," Ph.D. dissertation, Chapman University, Orange, CA, 2020. https://doi.org/10.36837/ chapman.000155
This Dissertation is brought to you for free and open access by the Dissertations and Theses at Chapman University Digital Commons. It has been accepted for inclusion in Computational and Data Sciences (PhD) Dissertations by an authorized administrator of Chapman University Digital Commons. For more information, please contact laughtin@chapman.edu.
Gene Mutations
A Dissertation by
Oluyemi Odeyemi
Chapman University
Orange, California
Schmid College of Science and Technology
Submitted in partial fulfilment of the requirements for the degree of
Doctor of Philosophy in Computational and Data Sciences
May 2020
Committee in charge:
Gennady M. Verkhivker, Ph.D., Committee Chair
Cyril Rakovski, Ph.D.
Divya Sain, Ph.D.
Gennady Verkhivker, Ph.D., Committee Chair
Cyril Rakovski, Ph.D., Committee Member
Divya Sain, Ph.D., Committee Member
Moom Roosan, Ph.D., Committee Member
Integrated Machine Learning and Bioinformatics Approaches for Prediction of Cancer-Driving Gene Mutations
Copyright © 2020
ACKNOWLEDGEMENT
I would like to thank Dr. Gennady Verkhivker, Dr. Cyril Rakovski, Dr. Hesham El-Askary,
Dr. Divya Sain, Dr. John Peach, Ryan Peeler, Sidy Danioko, Steve Agajanian, Kristalee Lio, Ayo Bello and everyone who offered thoughts and advice that were useful in completing this research.
DEDICATION To my family, friends and loved ones.
ABSTRACT
Integrated Machine Learning and Bioinformatics Approaches for Prediction of Cancer-Driving Gene Mutations
by Oluyemi Odeyemi
Cancer arises from the accumulation of somatic mutations and genetic alterations in cell division checkpoints and apoptosis, this often leads to abnormal tumor proliferation. Proper classification of cancer-linked drivermutations will considerably help our understanding of the molecular dynamics of cancer. In this study, we compared several cancer-specific predictive models for prediction of driver mutations in cancer-linked genes that were validated on canonical data sets of functionally validated mutations and applied to a raw cancer genomics data.
By analyzing pathogenicity prediction and conservation scores, we have shown that evolutionary conservation scores play a pivotal role in the classification of cancer drivers and were the most informative features in the driver mutation classification. Through extensive comparative analysis with structure-functional experiments and multicenter mutational calling data from Pan-Cancer Atlas studies, we have demonstrated the robustness of our models and addressed the validity of computational predictions. We evaluated the performance of our models using the standard diagnostic metrics such as sensitivity, specificity, area under the curve and F-measure. To address the interpretability of cancer-specific classification models and obtain novel insights about molecular signatures of driver mutations, we have complemented machine learning predictions with structure-functional analysis of cancer driver mutations in several key tumor suppressor genes and oncogenes. Through the experiments carried out in this study, we found that evolutionary-based features have the strongest signal in the machine learning classification
of driver mutations and provide orthogonal information to the ensembled-based scores that are prominent in the ranking of feature importance.
TABLE OF CONTENTS
1 General Introduction 1
1.1 Genetic Variation 1
1.2 Cancer-Linked Driver Mutation 3
1.3 Functional Prediction and Conservation Scores 4
1.4 Machine Learning 5
1.5 Dissertation Organization 6
1.6 Reference 8
2 Machine Learning Classification and Structure-Functional Analysis of Cancer Mutations Reveal Unique Dynamic and Network Signatures of Driver Sites in Oncogenes and Tumor
Suppressor Genes 12
2.1 Abstract 12
2.2 Introduction 13
2.3 Methods 17
2.3.1 Data Source and Dataset 17
2.3.2 Machine Learning: Random Forest and Logistic Regression Classifiers 20 2.3.3 Mutational Predictor Scores: Feature Selection and Feature Importance Analysis 23
2.4 Results and Discussion 25
2.4.1 ML Classification of Cancer Driver Mutations on Canonical Data Sets: Ensemble-Based and Conservation Features Consistently Outperform Structural Scores 25 2.4.2 Model Evaluation: Random Forest (RF) and Logistic Regression (Logit) 30
2.5 References 33
3 Integration of Random Forest Classifiers and Deep Convolutional Neural Networks for
Classification and Biomolecular Modeling of Cancer Driver Mutations 43
3.1 Abstract 43
3.2 Introduction 44
3.3 Materials and Methods 48
3.3.1 Data Source 48
3.3.2 Dataset and Feature Selection 48
3.4 Results 57 3.4.1 Deep Learning Classification of Cancer Driver Mutations from Nucleotide
Information 57
3.4.2 Incorporation of CNN Predictions with Ensemble-Based Predictors in Cancer
Driver Mutations Models 61
3.5 References 64
4 Machine Learning Based Classification of Survival and Cox PH Model Analysis of Selected
Unresectable Cancers 73
4.1 Abstract 73
4.2 Introduction 74
4.3 Methods 80
4.3.1 Survival Status Dataset 80
4.3.2 Proposed Models 81
4.3.2.1 Ensemble Classifiers 81
4.3.2.2 Cox Proportional Hazard Model 82
4.4 Results and Discussion 82
4.4.1 Comparative Analysis of Ensemble Classification of Cancer Survival Status 85 4.4.2 Informative Features and Feature Importance of Survival Status Classification
Models 89
4.4.3 Survival Analysis 93
4.5 References 99
5 Machine Learning Reclassification of Variants of Uncertain Significance 108
5.1 Abstract 108
5.2 Introduction 109
5.3 Methods 112
5.3.1 Genomic Variation Dataset 112
5.3.2 Clinical Significance Predictors: Feature Selection and Feature Importance
Analysis 114
5.3.3 Proposed Models: Extreme Gradient Boosting (xgboost) 119
5.4.1 Machine learning classification of cancer linked genes on variant datasets: Prediction scores, Mutation type and Sequence sample features outperform biological
response predictors 120
5.4.2 Examination of Intercorrelation pairwise relationship among the prediction scores, mutation type, sequence sample features and biological response feature sets. 121 5.4.3 Comparative Analysis of Machine Learning Reclassification of Clinical
Implication of Variants of Uncertain Significance 123
5.5 Reference 126
LIST OF TABLES
Table 2-1. Some of the studied genes from Cbioportal database categorized by cancer subtypes 19 Table 3-1. The parameters of displayed CNN architectures in classification of cancer driver
mutations. 55
Table 3-2. Statistics and comparative performance metrics of various ML classification of cancer
driver mutations models for the top eight predictors. 63
Table 4-1. Total number of patients and samples of selected cancer types and MSK_IMPACT
combined cancer type 80
Table 4-2. Model evaluation result of the ensemble classifiers and deep neural network survival
status of selected unresectable cancer types 89
Table 4-3. Cox-Proportional hazards results showing the effect size for pediatric acute
lymphoblastic leukemia 97
Table 4-4. Cox-proportional hazards results showing the effect size of pediatric neuroblastoma. 98 Table 5-1. List of oncogenes and tumor suppressors used for data collection and aggregation 118 Table 5-2. The classification of genetic variants, based on the ACMG guidelines 119 Table 5-3. Comparative evaluation of classifiers for VUS clinical implication reclassification 124
LIST OF FIGURES
Figure 2-1 Bar plot showing the distribution of cancer-linked driver mutation in glioblastoma
multiforme and ovarian carcinoma 18
Figure 2-2. Bar plot showing the distribution of studied cancer genes and mutations from
Cbioportal database 18
Figure 2-3. Feature importance analysis of the RF and logit machine learning models on the
canonical cancer-specific data set of functionally validated mutations. 26
Figure 2-4. Pairwise Spearman’s rank correlation coefficients between different prediction scores. The heat map of pairwise Spearman’s rank correlation coefficients is shown for top
ranking features in the RF model (A) and logit model respectively (B). 30
Figure 2-5. ROC plots of sensitivity (TPR) as a function of 1 – specificity, where specificity is
TNR 32
Figure 3-1. The schematic workflow diagram of the CNN approach employed in this study. To determine the optimal architecture, we performed a grid search over a total of 72 different neural
network architectures.. 50
Figure 3-2. Preprocessing of the nucleotide information for CNN machine learning of cancer
driver mutations.. 53
Figure 3-3. The average accuracy of CNN model using exclusively nucleotide information. (A) Average accuracy across all 3-folds on an epoch by epoch basis on the training set with the sliding window size = 10. (B) Average accuracy across all 3-folds on an epoch by epoch basis on
the validation set with the sliding window size = 10. 58
Figure 3-4. (A) Feature importance of 32 functional and sequence conservation features with DL score feature produced by CNN model excluded. (B) Feature importance of 33 features with the DL score included in the RF classification. The feature importance values are shown in blue filled bars and annotated. Feature importance is measured using the information value and
weight of evidence criteria. 60
Figure 3-5. (A) Feature importance ranking based on RF classification with only 8 most informative features. (B) Feature importance ranking based on RF classification with only top three predictors that included ensemble-based RadialSVM, LR scores, and DL score produced by
CNN model. 61
Figure 3-6. The AUC/ROC plots of sensitivity (TPR) versus specificity (TNR).. 62 Figure 4-1. Bar plot showing the percentage bar graph of survival status (living v deceased) of acute lymphoid leukemia (ALL), colorectal adenocarcinoma (COAD), glioblastoma (GLIO),
neuroblastoma (P-NB) and MSK-IMPACT cancer studies 83
Figure 4-2. Summary statistics of age at diagnosis of acute lymphoid leukemia(pediatric),
colorectal adenocarcinoma, glioblastoma and neuroblastoma(pediatric) 84
Figure 4-3. Multicollinearity dependence test for some of the clinical (sex, age, race, tumor type, overall survival in months) and genomic (fraction genome altered, aneuploidy score, mutation
Figure 4-4. ROC/AUC model evaluation for survival status classification (ALL, GLIO, COAD, P-NB and MSK-IMPACT). The ROC plot of three classifiers – xgboost, GBM and D-NN for
ALL.. 88
Figure 4-5. Top 10 most informative features contributing to classification of survival status of
ALL, GLIO, COAD, P-NB and MSK-IMPACT models.. 90
Figure 4-6. Summary statistics of age at diagnosis of ALL and P-NB with median ages of 3 and
8 respectively. 94
Figure 4-7. Distribution of ethnicity and race of pediatric acute lymphoma leukemia (ALL) and pediatric neuroblastoma (P-NB). The risk of ALL and neuroblastoma is slightly higher in white
and Hispanic white children than in other races. 95
Figure 5-1. Exploratory data analysis of the clinical implication of cancer-linked variations and cancer gene types. (A) Summary distribution of clinical significance of genetic variants. (B) Statistical distribution of cancer related genes- tumor suppressors and oncogenes 114 Figure 5-2. Feature importance analysis of xgboost ML model on cancer-linked dataset of genomic variation showing the most informative features in VUS reclassification. 122 Figure 5-3.Pearson’s pairwise correlation coefficients between the prediction scores, mutation
type, sequence sample and biological response features sets. 123
Figure 5-4. ROC/AUC plot for binary reclassification of VUS. Xgboost outperform SVM and
1
General Introduction
1.1 Genetic Variation
Cancer is driven by changes at the cellular and molecular levels. Cancer development and proliferation are associated with the accumulation of mutations. Notably, quite a few of identified mutations are responsible for cellular variations leading to cancer. Most variations are neutral and benign (passenger) in nature while a small fraction of the mutations drive the cancer development process. Genetic variation describes the mutation in the genome’s DNA sequence. Genetic variation is responsible for the distinct traits’ humans exhibit. It is the result of subtle differences in the DNA. Variation occurs in germ and somatic cells. The only variation that arises in germ cells can be inherited from one individual to another and so affect the dynamics of the population, consequently leading to evolutionary changes. Mutation is the primary source of genetic variation, however sexual reproduction and recombination contribute significantly to genetic variation. A mutation is an alteration in the genome sequence. New mutations occur when there are errors during DNA replication that are not corrected by DNA repair enzymes. Mutation can be neutral, beneficial or damaging to an organism. Most somatic mutations are salient but can occasionally interfere with major cellular functions. Accumulation of genetic alteration can result in tumor development in oncogenes, tumor-suppressor genes and stability genes (Vogelstein and Kinzler 2004; Vogelstein et al., 2013; Feinberg et al. 2006). Early somatic mutation can lead to developmental disorders whereas incessant accumulation of mutation can cause cancer. Human cells innately have several safety protocols to protect themselves against the lethal effects of mutation inducing cancers. Therefore, it is the defective genes that result in cancer proliferation (Yeang et al., 2008; Li et al., 2016).
Genetic variations are generally divided into three main classes namely, single base-pair
substitution, insertion or deletion(indel) and structural variation. Single base-pair substitution is a type of mutation in which a single nucleotide base is deleted or inserted from a DNA sequence such as in transition (interchange of purine or pyrimidine nucleic acids) and transversion
(interchange of a purine and pyrimidine nucleic acids). Single nucleotide polymorphisms (SNPs) result from the substitution of a single base-pair. (SNPs) are the most occurring type of genetic variation in people. A SNP represents a difference in a single DNA base, and they are found approximately in 1 out of every 300 bases. An example of SNPs would be a substitution of a thymine nucleic acid with guanine.
Indel variation refers to the insertion and/or deletion of nucleotides in genomic DNA. Indels play a significant role in the identification and detection of human diseases such as cancer. Indels are a common kinase activation system in cancer (Sehn, 2015; Porter et al., 2015; Sanders and Mason 2016). Indels are among the most common types of structural variants. Cumulatively, there are between 1.5 and 2.7 million indel polymorphisms in the human population, with ~ 0.4 million short indels in each individual (McMahon et al., 2017). When an indel occurs within the coding region of the DNA, it is referred to as ‘in-frame” and if the number of DNA lost or gained is divisible by 3, it is referred to as frameshift because the triplet reading code is altered for all subsequent nucleotides. Frameshift indels often lead to premature stop codons and most times have more functional impact than in-frame indels (Sanders and Mason, 2016; Copley, 2010). Yang et al., 2010 found a strong correlation between indels and base substitutions in cancer-related genes and showed that they tend to concentrate at the same locus in the coding sequences with the same samples. Also, they observed that a high proportion of indels are found in somatic variation when compared with meiotic mutations. Yang et al. 2010 also concluded that indels can
often be the driver-mutation in cancer proliferation that they attributed to the major influence of indels on gene function.
Structural variation is the large-scale differences in the genomic DNA. They are the region of DNA with base size larger than 1 kb. This genetic variation includes copy number variants (CNVs) and chromosomal rearrangement events such as duplications, inversions, translocation, deletions, and insertions. Identification of structural variation is crucial to genome interpretation but has been historically challenging due to limitations inherent to available genome technologies. Structural variations are mainly responsible for the evolutionary diversity of human genomes at individual and population levels (Dennis and Eichler, 2016; Kosugi et al., 2019). Pang et al., 2010 and Alkan et al., 2011 observed that the genomic difference between individuals caused by structural variations has been estimated to be more than 3 times higher than those by SNVs. Therefore, structural variations may have higher impacts on gene functions than SNVs and short indels. Consequently, structural variations are affiliated
with human diseases such as cancer (Stankiewicz and Lupski, 2010).
1.2 Cancer-Linked Driver Mutation
Genomic instability is central to cancer development (McFarland et al., 2017; Burrell et al., 2013). Genomic instability is responsible for driver and passenger mutations. Driver
mutations are responsible for driving carcinogenic processes. Whereas, passenger mutations have no proliferative impact on cellular systems. Studies have shown that from sequenced cancers passenger mutation accounts for over 90% of all genomic variation. The role of passenger mutations is not clearly understood, with some studies arguing that passengers are misclassified ‘mini-drivers’ or effectively neutral and potentially harmful to cancer (Castro-Giner et al.,2015
and McFarland et al., 2013). McFarland et al., 2017 observed that accumulated passenger mutations can be moderately harmful to cancer cells. They further observed that although passenger mutations exhibit individually weak effects on cancer progression, their collective impact is in line with a skewed high number of driver mutations, leading to strife between passengers and drivers. Consequently, passenger’s damaging effects are most evident in higher mutation rates (McFarland et al., 2017).
The identification of driver mutations in cancer remains a challenging task. There are several computational strategies aimed at detecting driver genes and ranking mutations for their carcinogenicity prospect (Torkamani et al., 2009). Consequently, several driver genes are not tagged as disease-related (Brown et al., 2019).
Presently, the reoccurrence of a mutation in patients remains one of the top reliable markers of mutation driver status. Nonetheless, some mutations are more likely to occur than others due to differences in background mutations rates arising from different types of DNA replication and repair systems (Brown et al., 2019). From the study of Brown et al., 2019, they showed that mutations not yet observed in a tumor had relatively low mutability, thus indicating that background mutability might limit the occurrence of mutation. Also, they concluded that mutability of driver mutations is often lower than that of passenger mutation and consequently adjusting mutation recurrence frequency by mutability significantly improved prediction of driver mutation.
1.3 Functional Prediction and Conservation Scores
Many algorithms have been designed to predict the molecular impact of amino acid substitutions on protein function and measure the conservation of nucleotide positions. These
algorithms map functional predictions and annotations for human splice site variants and non-synonymous single-nucleotide variants thereby providing key supporting evidence to clinicians when interpreting variants per the American College Medical Genetics (ACMG) guidelines. The most common functional prediction algorithms are MetaSVM, MetaLR, CADD, PolyPhen2, VEST3, PROVEAN, MutationTaster, MutationAssessor, FATHMM, and SIFT while the most popular conservation score metrics are PhyloP, LRT and GERP2.
1.4 Machine Learning
Machine learning (ML) is a branch of artificial intelligence based on the concept that systems can learn from data through pattern recognition. In recent years, machine learning has been used to develop predictive models for a more robust understanding of biological systems. A typical machine learning task consists of the following: 1) Exploratory data analysis, 2) Data preprocessing, 3) Model training, 4) Feature optimization and model parameterization and 5) Final predictions (Kandoi, 2019). Exploratory data analysis (EDA) and data preprocessing are pivotal to any ML task. These steps involve data cleaning steps- handling missing values, removal of redundant features, feature extraction, identification of predictors and target
variables. The accuracy of a machine learning model is dependent on its predictors’ capability of distinguishing one class from another.
ML is broadly classified into supervised (classification and regression) and unsupervised learning. Classification tasks have a categorical target variable, for example, gram-positive vs gram-negative microorganisms while regression has continuous target variables such as a colony-forming unit of Staphylococcus aureus. Unsupervised learning involves tasks without pre-defined target variables such as dimension reduction and clustering.
Some popular algorithms used for classification, regression, and unsupervised learning tasks include ensemble tree-based algorithms, support vector machines, generalized linear regression, general linear regression, k-means and self-organizing maps (Kandoi, 2019). Machine learning plays a cardinal role in computational biology and bioinformatics. Drug target identification, protein structure prediction, microbial morphology, gene function predictions are some of the common applications of ML (Pierre and Soren, 2003; Yang 2010; Mitra 2019).
In this study we used machine learning models to: (i) identify and characterize cancer driving mutations (SNVs) using functional, evolutionary-conservation and ensemble-score predictors, (ii) reclassify genomic variants of unknown significance associated with cancer development and (iii) classify survival status of unresectable cancers based on clinical and genomic features
1.5 Dissertation Organization
This dissertation is divided into six chapters. A summary of each chapter is given below.
Chapter 1 provides a background introduction to this dissertation.
Chapter 2 includes a published article motivating the need to study structure-functional analysis of cancer-driving mutation in oncogenes and tumor suppressor genes. By examining sequence, structure and ensembled-based features we were able to show that evolutionary conservation scores play a critical role in the classification of cancer drivers thereby providing the strongest signal in machine learning prediction. The article has been published under the title, “Machine Learning Classification and Structure-Functional Analysis of Cancer Mutations Reveal Unique Dynamic and Network Signatures of Driver Sites in Oncogenes and Tumor Suppressor Genes”
Information and modeling 2018 Oct 22;58(10):2131-2150. doi: 10.1021/acs.jcim.8b00414. Epub 2018 Oct 3.
Chapter 3 includes parts of an article “Integration of Random Forest Classifiers and Deep Convolutional Neural Networks for Classification and Biomolecular Modeling of Cancer Driver Mutations”by Steve Agajanian, Odeyemi Oluyemi, and Gennady Verkhivker published in Frontiers in Molecular Biosciences 2019; 6: 44. By analyzing raw nucleotide sequences for cancer driver mutation classification, we integrated various ensemble-based approaches with deep convolutional neural networks to predict cancer driver mutation in genomic datasets.
Chapter 4 includes a manuscript currently under preparation or submission to a peer-reviewed paper. In the paper titled “Machine Learning-Based Overall Survival Status Classification and Cox PH Model Analysis of Selected Unresectable Cancers”, by examining genomic features such as iAMP21, TCF-HLF, ETV6-RUNX1, MLL Rearranged molecular subtypes, gene expression type, fraction of genome altered and clinical features such as age at diagnosis, cell of tumor origin (T-cell & B-cell), we build an ensemble-based predictive model to classify overall survival status of unresectable cancers namely acute lymphoid leukemia, colorectal
adenocarcinoma, glioblastoma, and pediatric neuroblastoma. Also, we used the same features for the Cox PH survival analysis model.
Chapter 5 includes a manuscript currently under preparation for submission to a peer-reviewed journal. We built a machine learning model to reclassify variants of unknown significance (VUS) based on established clinical values. The manuscript is titled, “Machine Learning
Reclassification of Variants of Uncertain Significance”.
Chapter 6 includes the general conclusions of this dissertation and the contribution of this study to cancer therapy research
1.6 Reference
Alkan, C., Coe, B. P., & Eichler, E. E. (2011). Genome structural variation discovery and genotyping. Nature Reviews Genetics, 12(5), 363–376. doi: 10.1038/nrg2958
Brown, A. L., Li, M., Goncearenco, A., & Panchenko , A. R. (n.d.). Finding driver mutations in cancer: Elucidating the role of background mutational processes. PLOS Computational
Biology, 15(4). doi: https://doi.org/10.1371/journal.pcbi.1006981
Burrell, R. A., Mcgranahan, N., Bartek, J., & Swanton, C. (2013). The causes and consequences of genetic heterogeneity in cancer evolution. Nature, 501(7467), 338–345. doi:
10.1038/nature12625
Castro-Giner, F., Ratcliffe, P., & Tomlinson, I. (2015). The mini-driver model of polygenic cancer evolution. Nature Reviews Cancer, 15(11), 680–685. doi: 10.1038/nrc3999
Copley, S. D. (2010). Evolution and the Enzyme. Comprehensive Natural Products II Chemistry and Biology, 8, 9–46. doi: https://doi.org/10.1016/B978-008045382-8.00670-5
Dennis, M. Y., & Eichler, E. E. (2016). Human adaptation and evolution by segmental duplication. Current Opinion in Genetics & Development, 41, 44–52. doi:
10.1016/j.gde.2016.08.001
Kandoi, G., Machine learning tools for mRNA isoform function prediction (2019). Graduate Theses and Dissertations. 17479. https://lib.dr.iastate.edu/etd/17479
Kosugi, S., Momozawa, Y., Liu, X., Terao, C., Kubo, M., & Kamatani, Y. (2019). Comprehensive evaluation of structural variation detection algorithms for whole genome sequencing. Genome Biology, 20(1). doi: 10.1186/s13059-019-1720-5
Li, H. T., Zhang, J., Xia, J., & Zheng, C. H. (2016). Identification of driver pathways in cancer based on combinatorial patterns of somatic gene mutations. Neoplasma, 63(01), 57–63. doi: 10.4149/neo_2016_007
Mcfarland, C. D., Korolev, K. S., Kryukov, G. V., Sunyaev, S. R., & Mirny, L. A. (2013). Impact of deleterious passenger mutations on cancer progression. Proceedings of the National Academy of Sciences, 110(8), 2910–2915. doi: 10.1073/pnas.1213968110
Mcfarland, C. D., Yaglom, J. A., Wojtkowiak, J. W., Scott, J. G., Morse, D. L., Sherman, M. Y., & Mirny, L. A. (2017). The Damaging Effect of Passenger Mutations on Cancer
Progression. Cancer Research, 77(18), 4763–4772. doi: 10.1158/0008-5472.can-15-3283-t Mcmahon, K., Paciorkowski, A. R., Walters-Sen, L. C., Milunsky, J. M., Bassuk, A., Darbro, B.,
… Gropman, A. (2017). Neurogenetics in the Genome Era.Swaimans Pediatric Neurology, 257–
267. doi: 10.1016/b978-0-323-37101-8.00034-5
Mitra, S. (2019). Introduction to machine learning and bioinformatics. Boca Raton, FL: CRC Press/Taylor & Francis Group.
Pang, A. W., Macdonald, J. R., Pinto, D., Wei, J., Rafiq, M. A., Conrad, D. F., … Scherer, S. W.
(2010). Towards a comprehensive structural variation map of an individual human genome. Genome Biology, 11(5). doi: 10.1186/gb-2010-11-5-r52
Pierre, B., & Soren, B. (2003). Bioinformatics The Machine Learning Approach. New Delhi: Affiliated East-West Press P. Ltd.
Porter, J., Berkhahn, J., & Zhang, L. (2015). A Comparative Analysis of Read Mapping and Indel Calling Pipelines for Next-Generation Sequencing Data. Emerging Trends in
Computational Biology, Bioinformatics, and Systems Biology, 521–535. doi: 10.1016/b978-0-12-802508-6.00029-6
Sanders, S. J., & Mason, C. E. (2016). The Newly Emerging View of the Genome. Genomics, Circuits, and Pathways in Clinical Neuropsychiatry, 3–26. doi: 10.1016/b978-0-12-800105-9.00001-9
Sanders, S. J., & Mason, C. E. (2016). The Newly Emerging View of the Genome. Genomics, Circuits, and Pathways in Clinical Neuropsychiatry, 3–26. doi: 10.1016/b978-0-12-800105-9.00001-9
Sehn, J. K. (2015). Insertions and Deletions (Indels). Clinical Genomics, 129–150. doi: 10.1016/b978-0-12-404748-8.00009-5
Stankiewicz, P., & Lupski, J. R. (2010). Structural Variation in the Human Genome and its Role in Disease. Annual Review of Medicine, 61(1), 437–455. doi: 10.1146/annurev-med-100708-204735
Torkamani, A., Verkhivker, G., & Schork, N. J. (2009). Cancer driver mutations in protein kinase genes. Cancer Letters, 281(2), 117–127. doi: 10.1016/j.canlet.2008.11.008
Vogelstein, B., Papadopoulos, N., Velculescu, V. E., Zhou, S., Diaz, L. A., & Kinzler, K. W. (2013). Cancer Genome Landscapes. Science, 339(6127), 1546–1558. doi:
10.1126/science.1235122
Vogelstein, B., & Kinzler, K. W. (2004). Cancer genes and the pathways they control. Nature Medicine, 10(8), 789–799. doi: 10.1038/nm1087
Yang, H., Zhong, Y., Peng, C., Chen, J.-Q., & Tian, D. (2010). Important role of indels in somatic mutations of human cancer genes. BMC Medical Genetics, 11(1). doi: 10.1186/1471-2350-11-128
Yang, Z. R. (2010). Machine learning approaches to bioinformatics. Singapore: World Scientific.
Yeang, C.-H., Mccormick, F., & Levine, A. (2008). Combinatorial patterns of somatic gene mutations in cancer. The FASEB Journal, 22(8), 2605–2622. doi: 10.1096/fj.08-10898
2 Machine Learning Classification and Structure-Functional Analysis of Cancer Mutations Reveal Unique Dynamic and Network Signatures of Driver Sites in Oncogenes and Tumor Suppressor Genes
Steve Agajanian, Yemi Odeyemi, Nathaniel Bischoff, Simrath Ratra and Gennady Verkhivker Author’s Contribution
YO contributed to the design of the study and interpretation of the results. YO wrote part of codes for the data preprocessing and data analysis. All the authors read and approved the final manuscript.
2.1 Abstract
Background: Cancer arises from the accumulation of somatic mutations and genetic alterations in cell division checkpoints and apoptosis, this often leads to abnormal tumor proliferation. Proper classification of cancer-linked drivermutations will considerably help our understanding of the molecular dynamics of cancer.
Methods: In this study, we compared two cancer-specific predictive models- logistic regression and random forest for prediction of driver mutations in cancer-linked genes that were validated on canonical data sets of functionally validated mutations and applied to a raw cancer genomics data.
Results: By analyzing pathogenicity prediction and conservation scores, we have shown that evolutionary conservation scores play a pivotal role in the classification of cancer drivers and were the most informative features in the driver mutation classification. Through extensive
comparative analysis with structure-functional experiments and multicenter mutational calling data from Pan-Cancer Atlas studies, we have demonstrated the robustness of our models and addressed the validity of computational predictions. We evaluated the performance of our
models using the standard diagnostic metrics such as sensitivity, specificity, area under the curve and F-measure. To address the interpretability of cancer-specific classification models and obtain novel insights about molecular signatures of driver mutations, we have complemented machine learning predictions with structure-functional analysis of cancer driver mutations in several key tumor suppressor genes and oncogenes.
Conclusion: Through the experiments carried out in this study, we found that evolutionary-based features have the strongest signal in the machine learning classification of driver mutations and provide orthogonal information to the ensembled-based scores that are prominent in the ranking of feature importance.
2.2 Introduction
Cancer arises from a gradual buildup of somatic mutations and genetic alterations that undermine cell division checkpoints and apoptosis, this often leads to abnormal tumor
proliferation (Iranzo et al.,2018; Reddy et al., 2017; Li and Thirumala, 2016). The primary objective of cancer research is the discovery and characterization of functional effects of variants that contribute to tumor development. Several DNA sequencing programs have prompted interest in cancer studies, consequently yielding vital information needed for understanding genomic basis for tumor development. Somatic variations have been extensively characterized through deep-sequencing analyses of genome-wide association studies (GWAS) and the coding exomes of various cancer types, showing that there are ~140 genes whose intragenic mutations contribute
to cancer, with a relatively small fraction of recurrent somatic variants providing a proliferative edge to cancer cells and often being detected based on mutational frequency in omics studies.
A large percentage of the somatic mutations are passengers that occur randomly as a result of mutagenesis, without a known functional impact and biological effect. By analyzing the
variations driving cancer development in more than 7000 tumors, molecular evolution-informed studies have shown that an insignificant fraction of mutated genes is required to transform a single normal cell into a cancer cell across diverse cancer types. Novel methods have also focused on the discovery of presumed drivers in the genome’s non-coding regions. Albeit major driver mutations can substantially promote tumor proliferation, some passengers can be
singularly weak and yet concertedly lethal, indicating that disease progression is often difficult to justify based on a classical binary passenger-driver model. Cancer-linked variations that are inconsequential to tumor proliferation and are present at low frequency in cancer cohorts can form a set of “mini-drivers”, showing that mutational motifs in cancer genomes are highly heterogeneous and can span a continuum of phenotypic impacts. Recent NGS breakthroughs have led to the inauguration of interdisciplinary cancer genomic projects and key data portals, such as The Catalogue of Somatic Mutations in Cancer (COSMIC) database, The Cancer Genome Atlas (TCGA) (Weinstein et al., 2013) and the International Cancer Genome Consortium (ICGC) cancer genome projects(Hudson et al., 2010; Zhang et al., 2011). The COSMIC database includes data from full exome sequencing of 1020 cancer cell lines. TCGA data include information about 40 cancer projects from >20 000 genes, ~3.1 million mutations (Jensen et al., 2017) and 33 cancer types. The ICGC data portal includes 86 cancer projects of 22 cancer primary sites with 81 782 588 annotated simple somatic mutations. (Klonowska et al., 2016; Hinkson et al.,2017). The cBio Cancer Genomics Portal provides access to cancer
genomics data sets from >5000 tumor samples, 215 cancer studies, and 981 genes (Cerami et al., 2012; Gao et al., 2013). Oncogenomics advancement has provided large complex data needed for data-centric analyses of genetic variations in various cancer types (Nakagawa and Fujita 2018).
In recent times, many bioinformatics tools that compute the structural impact of a given SNV have been developed for predictions of presumed cancer-linked drivers and functional annotation of somatic mutations (Cheng et al., 2016; Ding et al., 2014; Raphael et al., 2014). Computational features for analyzing mutations in the protein-coding regions(Sim et al.,2012; Adzhubei et al., 2010; Chun et al., 2009; Reva et al., 2011; Schwarz et al., 2010; Gonzalez-Perez and Lopez-Bigas, 2011; Choi et al., 2012; Shihab et al., 2013) and several sequence-based scores(Davydov et al., 2010; Garber et al., 2009)were efficiently used for prediction of cancer driver mutations in the noncoding regions. Combined annotation-dependent depletion (CADD) and genome-wide annotation of variants (GWAVA) (Kircher et al., 2014; Ritchie et al., 2014) methods were developed for characterization and classification of the noncoding variants by combining various genomic annotations into integrated score measures with the aid of support vector machine classifiers. Cancer driver annotation (CanDrA) (Mao et al.,2013) and cancer-specific high-throughput annotation of somatic mutations (CHASM) (Carter et al.,2009) are cancer-specific ML approaches that utilized evolutionary, functional and genetic features of somatic mutations computed by various prediction algorithms. Cancer-related analysis of variants toolkit (CRAVAT), which is a web-based CHASM application, is now often used for prioritization of genes and variants important for specific cancer tissue types (Douville et al., 2013).
In the effort to consolidate a comprehensive functional annotation for SNVs discovered in exome sequencing studies, a database of human nonsynonymous SNVs (dbNSFP) was
developed as a one-stop resource for analysis of disease-causing mutations (Liu et al., 2011; 2013; 2016). Based on detailed comparisons and machine learning-based integration of 18 scoring methods for prediction of nonsynonymous SNVs, the two ensemble scores RadialSVM and LR were designed, showing superior performance over their 10 component scores (Dong et al., 2015). The latest database dbWGFP of functional predictions for SNVs collected
approximately 8.6 billion possible human whole-genome SNVs, with capabilities to impute a total of 48 functional prediction scores for each SNV, including 32 functional prediction scores by 13 approaches, 15 conservation features from 4 different tools including ensemble-based predictors MSRV, RadialSVM, and LR scores(Wu et al., 2016).
ML studies indicated that the incorporation of both sequence and structure-based scores can provide important information for classification of cancer genes and driver mutations, but the underlying molecular reasons for a weak consensus between functional features remains poorly understood and hidden in the feature selection process. Modern deep learning methods can leverage large data sets for finding hidden patterns and making robust predictions in cancer genomics, and drug discovery applications (Angermueller et al., 2016; Zhang et al., 2017; Min et al., 2016; Jing et al., 2018; Zhou and Troyanskava,2015; Yuan et al., 2016). However, it is often overlooked that the performance and interpretability of machine learning models are equally important for predictions and understanding of cancer mutation signatures.
In this study, we compared two ML models, logistic regression (logit) and random forest (RF) classifiers by considering various cancer-specific golden sets of functionally known cancer mutations(Carter et al., 2009; Martelotto et al., 2014) and using a set of diverse functional prediction and conservation scores that included computations of 48 functional scores using dbWGFP server (Wu et al., 2016). By evaluating a diverse spectrum of functional features, we
show that conservation-derived and ensemble-based scores were the most informative predictors in the ML classification of cancer-linked driver mutation. We used logit and RF models to predict and analyze driver mutations in Cbioportal cancer genomics data set (Cerami et al., 2012; Gao et al., 2013) by considering 145 601 mutations covering various cancer subtypes and over 300 genes.
2.3 Methods
2.3.1 Data Source and Dataset
We primarily sourced our datasets from Cbioportal, TCGA, and CanDra (from the COSMIC database). We used various well studied benchmarking data sets of functionally validated and manually curated variations for our training and validation sets. The initial set included a total of 3591 SNVs from oncogenes such as HRAS, BRAF, KIT, PIK3CA, KRAS, EGFR, ERRB2, DICER1, ESR1, IDH1, IDH2, MYOD, SF3B1, and tumor suppressor genes such as RUNX1, BRCA1, BRCA2 and TP53 (Martelotto et al., 2014). Due to our goal of classifying mutation as either driver or passenger, we classified neutral and uncertain SNVs as passenger whereas the driver mutations were left intact. The ML model was trained and validated only on missense mutations. The first benchmarking had 3706 mutations, with only 3591 SNVs that included 140 neutral, 849 non-neutral, and 2602 of uncertain function which was assigned as passengers. The second employed data set was taken from the original CanDrA study (Mao et al.,2013) with 1550 SNVs. The CanDrA data set was initially derived by
combining ovarian carcinoma (OVC) and glioblastoma multiforme (GBM) mutational data extracted from TCGA (Weinstein et al., 2013) and COSMIC databases (Forbes et al.,2015). In the GBM sets, 134 SNVs were drivers and 585 SNVs were passenger mutations, while in the OVC datasets, 122 SNVs were driver mutations and 709 were passengers (Figure 2-2). The
CanDra data set (Mao et al., 2013) was integrated with the benchmarking data set (Martelotto et al., 2014) to generate one master training set used to build the ML models. The tree-based random forest and logistic regression classification models were used to predict cancer-linked driver variants from the cBioPortal cancer genomics data set (Cerami et al., 2012; Gao et al., 2013) by considering data from over 200 cancer studies covering 20 primary cancer sites (ovary, thyroid, CNS/brain, prostate, kidney, bowel, lymphoid, stomach, bladder, head/neck, breast, myeloid, uterus, lung, PNS, skin, liver, pancreas, soft tissue, cervix).
Figure 2-1 Bar plot showing the distribution of cancer-linked driver mutation in glioblastoma multiforme and ovarian carcinoma
Figure 2-2. Bar plot showing the distribution of studied cancer genes and mutations from Cbioportal database
Table 2-1 Some of the studied genes from Cbioportal database categorized by cancer subtypes
Protein function Genes
Cell death regulation signaling
NFKB1, NFKB2, CHUK, DIRAS3, FAS, HLA-G, BAD, BCL2, BCL2L1, APAF1, CASP9, CASP8, CASP10, CASP3, CASP7, CASP6, GSK3B, ARL11, WWOX
Telomere Maintenance TERC, TERT
RTK Signaling
EGFR, ERBB2, ERBB3, ERBB4, PDGFA, PDGFRB, KIT, FGF1, IGF1, IGF1R, VEGFA, VEGFB, KDR
P13K-AKT-mTOR signaling
PIK3CA, PIK3R1, PIK3R2, PTEN, PDPK1, AKT1, AKT2, FOXO1, FOXO3, MTOR, RICTOR, TSC1, TSC2, RHEB, AKT1s1, RPTOR
Ras-Raf-MEK-Erk/JNK signaling
KRAS, HRAS, BRAF, RA1, MAP3K1, MAP3K2, MAP3K3, MAP3K4, MAP3K5, MAP2K1, MAP2K2, MAP2K3, MAP2K4, MAPK1, MAPK3, DAB2, RAB25
Regulation of ribosomal protein synthesis
RPS6KA1, RPS6KA2, RPS6KB1, RPS6KB2, EIF5A2, EIF4E, EIF4EBP1, RPS6, HIFIA
Angiogenesis VEGFA, VEGFB, KDR, CXCL8, CXCR1, CXCR2
Folate transport SLC19A1, FOLR1, FOLR2, FOLR3, IZUMO1R
Invasion and metastasis genes
MMP1, MMP2, MMP3, MMP7, MMP9, MMP10, MMP11, MMP12, MMP13, MMP14, MMP15, MMP16, MMP19, MMP28, ITGB3, ITGB3, PTK2, CDH1, SPARC, WFDC2
A total of 80,081 unique missense mutations from 378 cancer genes was considered (after excluding 65 520 duplicate mutations in patients with multiple samples from a total of 145 601 mutations Figure 2-2). glioblastoma/TP53 pathway genes; glioblastoma/RTK/Ras/PI3K/AKT signaling genes; glioblastoma/RB pathway genes; Genes implicated in multiple cancer types and associated with the following major functions: cell cycle control genes; DNA damage response genes; growth/proliferation signaling genes; RTK signaling genes; p53 signaling genes; notch signaling genes survival/cell death regulation signaling genes; telomere maintenance genes; Ras-Raf-MEK-Erk/JNK signaling genes; PI3K-AKT-mTOR signaling genes; regulation of ribosomal protein synthesis and cell growth genes; angiogenesis genes; folate transport genes; invasion and metastasis genes. A total of 56,634 unique missense mutations were finally analyzed and
classified by our RF and logit models (Table 2-1).
2.3.2 Machine Learning: Random Forest and Logistic Regression Classifiers
Several factors were considered in the choice of our classifiers for our models such as easy interpretation, speed (run time) and statistical importance. Afterward, we used and compared the performance of logistic regression (logit) and random forest (RF). Logistic
regression (logit) is an ML classifier that is used to predict the probability of a categorical binary outcome. In logit, the dependent variable is a dichotomous(binary) in nature that contains data coded as 0 or 1. It answer questions such as how does the probability of obesity (yes/ no) change for every additional can of soda drank per day? Logit models the log odds of an event. Logistic regression models are based on specific statistical assumptions such as the target variable takes the form of a binomial distribution, the absence of outliers in the data and no multicollinearity among the predictors.
𝐿𝑜𝑔 (1 − 𝑌) = 𝑏ₒ + 𝑏₁𝑋₁ + 𝑏₂𝑋₂ + ⋯ + 𝑏ₙ𝑋ₙ (2.1)𝑌
Where (1−𝑌𝑌 ) is the log likelihood of the target variable, 𝑏ₒ is the y-intercept, 𝑏ₙ𝑋ₙ are the slope coefficient and the predictors.
RF is a tree-based ensemble classifier where each tree is exposed to a random subset of features and a random subset of samples drawn with replacement. In this model, the number of trees, the number of features seen by each tree, and the maximum depth of each tree can be tuned to fit the data. A data point to be classified is passed to every tree in the forest, and the predicted class is the winner of a collective vote by all trees. Because of the bootstrapped nature of all the trees in the forest, random forest classifiers are typically robust to noise and can accurately fit nonlinear relationships present in data. In the framework of this approach, we used Bayesian optimization to optimize the hyper-parameters of the model with 100 iterations in our
optimization run. By changing values for the hyper-parameters, we monitored how this affects the F-score which is the harmonic mean of the precision and recall, to obtain the final set of hyper-parameters. We provided accuracy to the optimizer as the average of 10-fold cross-validation run across three different random seeds. The final set of hyper-parameters chosen by Bayesian optimization were maximum depth = 200, maximum features = 32, number of
estimators = 70. The number of estimators determines the number of trees in the forest, maximum depth determines the maximum depth that each tree can grow to, and maximum features determine the number of features randomly selected at each node when choosing the best tree split. The depth of the random forest model and measurements of information Gini impurity implemented in scikit-learn (Pedregosa et al., 2011) were employed and refined to achieve the best results and avoid overfitting problem (Biau, 2012)
𝐺𝑖𝑛𝑖 𝑖𝑚𝑝𝑢𝑟𝑖𝑡𝑦 = ∑
𝑐 𝑖=1
𝑓𝑖(1 − 𝑓𝑖) (2.2)
Where 𝑓𝑖 is the frequency label of i at a node and c is the number of unique labels. The model training and tuning was done using scikit-learn free software machine learning library for the Python programming language (pedregosa et al., 2011). In addition, we also explored logistic regression classification model that allows for fast training and prediction phases of the model without tuning requirement and need for feature rescaling (Palazon-Bru et al., 2017).
For the model diagnostic, accuracy, recall, precision, and F1 metrics were used to evaluate the performance of each classifier. These parameters are defined as follows:
𝐴𝑐𝑐𝑢𝑟𝑎𝑐𝑦 =𝑇𝑃 + 𝑇𝑁 𝑎𝑙𝑙 ; 𝑃𝑟𝑒𝑐𝑖𝑠𝑖𝑜𝑛 =𝑇𝑃 + 𝐹𝑃 (2.3)𝑇𝑃
𝑅𝑒𝑐𝑎𝑙𝑙 =𝑇𝑃 + 𝐹𝑁 ; 𝐹1 = 2 𝑇𝑃 𝑃𝑟𝑒𝑐𝑖𝑠𝑖𝑜𝑛 × 𝑅𝑒𝑐𝑎𝑙𝑙 𝑃𝑟𝑒𝑐𝑖𝑠𝑖𝑜𝑛 + 𝑅𝑒𝑐𝑎𝑙𝑙 (2.4)
The true positive (TP) and true negative (TN) are defined as the number of mutations that are classified correctly as driver and passenger mutations, respectively. Likewise, false positive (FP) and false negative (FN) are defined as the number of mutations that are misclassified into the other mutational classes. An F score is a measure of precision and recall and is often used in binary classification problems. Precision is defined as the number of positive samples the model predicts correctly (true positives) divided by the true positives plus the false positives. Recall is defined as true positives divided by true positives plus false negatives. The positive predictive value (PPV) and negative predictive value (NPV) were assessed for various components of the model. PPV is defined as the proportion of mutations predicted to be driver mutations that were experimentally validated as drivers:
𝑃𝑜𝑠𝑖𝑡𝑖𝑣𝑒 𝑃𝑟𝑒𝑑𝑖𝑐𝑡𝑖𝑣𝑒 𝑉𝑎𝑙𝑢𝑒 (𝑃𝑃𝑉) =𝑇𝑃 + 𝐹𝑃 (2.5) 𝑇𝑃
NPV is the proportion of mutations predicted to be passengers that were experimentally validated as neutral:
𝑁𝑒𝑔𝑎𝑡𝑖𝑣𝑒 𝑃𝑟𝑒𝑑𝑖𝑐𝑡𝑖𝑣𝑒 𝑣𝑎𝑙𝑢𝑒 =𝑇𝑁 + 𝐹𝑁 (2.6)𝑇𝑁
The model performance was evaluated using receiver operating characteristic area under the curve. The receiver operating curve (ROC) is a graph where sensitivity is plotted as a
function of 1 – specificity. The sensitivity or true positive rate (TPR) is defined as the percentage of non-neutral mutations that are correctly identified as driver mutations:
𝑆𝑒𝑛𝑠𝑖𝑡𝑖𝑣𝑖𝑡𝑦(𝑇𝑃𝑅) = 𝑇𝑃 + 𝐹𝑁 (2.7)𝑇𝑃
The specificity or true negative rate (TNR) is defined as the percentage of mutations that are correctly identified as passengers:
𝑆𝑝𝑒𝑐𝑖𝑓𝑖𝑐𝑖𝑡𝑦(𝑇𝑁𝑅) = 𝑇𝑁 + 𝐹𝑃 (2.8)𝑇𝑁
The area under the ROC is denoted AUC. A reliable and valid AUC estimate can be interpreted as the probability that the classifier will assign a higher score to a randomly chosen positive example than to a randomly chosen negative example. The AUC effectively measures
discrimination of true positive rate versus false positive rate, providing means to evaluate the ability of the model to correctly classify drivers and passenger mutations.
2.3.3 Mutational Predictor Scores: Feature Selection and Feature Importance Analysis The first set of selected features were acquired from dbWGFP web server of functional predictions for human whole-genome single nucleotide variants that provided 32 functional prediction scores and 15 evolutionary features (Wu et al., 2016).
Function prediction scores are scores that predict the probability of a SNV to cause a damaging change in protein function whereas evolutionary scores are scores providing different
conservation metrics of a given nucleotide site across multiple species. Some of the score features such as RadialSVM, SIFT, PolyPhen, LRT, MSRV, Mutation Assessor ,
MutationTaster, FATHMM, LR ( Dong et al., 2015 ; Sim et al., 2012 ; Adzhubei et al., 2010 ; Chun and Fay, 2009 ;Wu et al., 2016 ; Reva et al., 2011 ; Schwarz et al., 2010 ; Shihab et al., 2013) can be applied only to SNVs in the protein coding regions, whereas other scores such as Gerp++, SiPhy, PhyloP, Grantham, CADD and GWAVA (Davydov et al., 2010 ; Garber et al., 2009 ; Grantham, 1974 ; Kircher et al., 2014 ; Ritchie et al. , 2014) can evaluate SNVs spreading over the whole genome. The ensemble-based scores RadialSVM and LR are integrated features that used support vector machine (SVM) and LR machine learning approaches to combine
information from 10 individual component scores (SIFT, PolyPhen-2 HDIV, PolyPhen-2 HVAR, Gerp++, MutationTaster, Mutation Assessor, FATHMM, LRT, SiPhy, PhyloP), as well as the maximum frequency observed in the 1000 genomes populations (Dong et al., 2015).
In the final dataset, we imputed 48 feature scores for each SNV (Wu et al., 2016) and the resulting data set was divided into training and test sets: 80-20% ratio respectively. Our resulting dataset was preprocessed to handle missing values, skewness, distribution disparity etc.
The training data was subjected to stepAIC feature selection, where features are dropped in a step by step manner based on each feature statistical significance hierarchy, and the model trained on the resulting features. After the feature selection resulting in a final data set of 32 features.
2.4 Results and Discussion
2.4.1 ML Classification of Cancer Driver Mutations on Canonical Data Sets: Ensemble-Based and Conservation Features Consistently Outperform Structural Scores
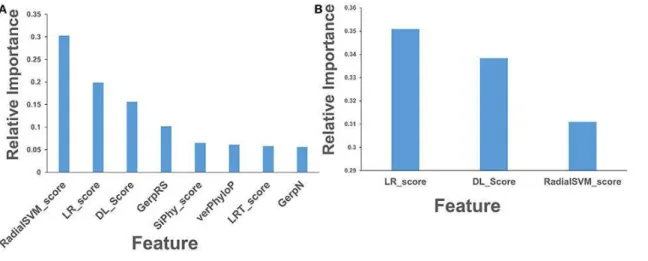
Logit and RF models were trained by examining a combination of two canonical cancer-specific sets of functionally validated mutations (Carter et al., 2009; Martelotto et al., 2014) and using a group of various predictors that included functional scores obtained from dbWGFP server (Table 2-2). In this analysis, we compared the performance of both classifiers and focused on identifying statistical significant predictors that drive cancer predictions in both models (Figure 2-3). In accordance with prior studies, the ensemble-based scores LR and RadialSVM dominated the feature importance distribution in both models, significantly outweighing the importance of other predictors (Figure 2-3A, B). In the RF model, the LR and RadialSVM scores were the top ranked predictors with the information value scores of 0.27 and 0.23 respectively, followed by a group of sequence-based evolutionary conservation predictors (Mutation Assessor, Gerp++, GerpRS, SiPhy, and PhyloP) that also showed significant feature importance (Figure 2-3A)
Figure 2-3. Feature importance analysis of the RF and logit machine learning models on the canonical cancer-specific data set of functionally validated mutations. Feature importance of a final data set of 32 features in machine learning predictions using RF model (A, B) and logit model (C,D). Feature importance is measured using the information value and weight of
evidence criteria. (A) Feature importance analysis of the RF model including all 32 features. (B) Feature importance analysis of the RF model after excluding two top ensemble-based features LR and RadialSVM. The feature importance values are shown in blue filled bars and annotated. (C) Feature importance analysis of the LR model including all 32 features. (D) Feature
importance analysis of the LR model after excluding two top ensemble-based features LR and RadialSVM. The feature importance values are shown in red filled bars and annotated. The information value (IV) metric typically indicates that attributes with less than 0.02 score have no predictive power, while those that fall between 0.02 and 0.1 are considered to have weak
predictive power, the features with importance values in the range 0.1–0.2 indicate medium predictive power, and the features with importance exceeding 0.2 often indicate strong predictive power.
Interestingly, the ensemble features RadialSVM and LR integrate information from components that individually also indicate a substantial information value (GERP++,
MutationTaster, Mutation Assessor, FATHMM, LRT, SiPhy, and PhyloP). LR and RadialSVM features were initially developed to differentiate non-pathogenic polymorphisms from
pathogenic (mutant) missense variants (Dong et al., 2015). The major rationale behind
consideration of ensemble-based scores alongside with individual components they include was therefore to evaluate transferability and performance of various predictors for passenger/driver classification. In this analysis, we compared the two ensemble-based scores, both with each other and with all other features. The variable importance analysis confirmed that the ensemble based LR and RadialSVM dwarfs’ other features in both models. Despite these scores reversed rank in the logit model, they remained the top two features with the information scores of 0.332 and 0.441 for LR and RadialSVM scores respectively (Figure 2-3B). Another significant observation of feature importance analysis was that the ensemble predictors not only eclipse their own component scores but also demonstrated greater importance than all the other predictors.
To evaluate the models ability to recap the predictions in the absence of two ensemble-based metrics, we repeated our experiments by excluding the ensemble-ensemble-based metrics and ranked the importance of the remaining mutational scores based on their statistical significance (Figure 2-3,C,D). The top ranked features were commensurable to functional scores based on evolutionary conservation patterns, such as Mutation Assessor, which was derived to evaluate sequence homology of protein families and subfamilies within and between species using combinatorial entropy formalism (Reva et al., 2011). Other highly ranked individual features included GerpN neutral evolution score and Gerp element scores (Davydov et al., 2010) that
estimate amino acid substitution deficits to identify constrained elements in multiple alignments. Also, a similar feature importance ranking was observed in the RF-based application of a
different ensemble learner REVEL (rare exome variant ensemble learner) developed for predicting pathogenicity of missense variants, (Ioannidis et al., 2016) where the ensemble-derived predictors along with Gerp++ and Mutation Assessor individual scores also showed the highest feature importance. Another significant observation of our analysis was that a group of evolutionary-based features (GerpRS, GerpN, Gerp++, Mutation Assessor) can be adequately potent not only for prediction of pathogenic missense SNVs but also in cancer-specific passenger/driver classification of somatic mutations.
In the logit model, MSRV, SinBAD_HVAR, and SinBAD_HGMD scores were the top-ranking scores. MSRV, an integrated feature obtained from a set of 24 physicochemical
properties and several conservation scores to compute disease-causing nonsynonymous SNV mutations (Jiang et al., 2007). SinBaD scores is also an integrated feature that were initially developed by a logistic regression model with ninety binary features derived from multiple sequence alignment designed for evaluation of mutational effects in protein coding and promoter regions (Lehmann and Chen et al., 2013). Another highly ranked feature was likelihood ratio test (LRT) score that adopted the log-likelihood ratio of the conserved relative to the neutral model to predict functional significance of mutations (Chun and Fay 2009). Noteworthily, some of the top- ranking features such as SiPhy, PhyloP, and Grantham were initially developed to provide prediction scores for variants spreading over the whole genome. Concurrently, functional scores that estimate the impact of mutational variants on the protein coding regions (MutationTaster, LRT, SIFT, PolyPhen2_HVAR) contributed less significantly to the feature performance (Figure2-3 C,D). Some of the population-based scores that differentiates pathogenic missense
mutants from the typical polymorphisms (SIFT, PolyPhen2) were not as important in our classification models than cancer-specific features, such as FATHMM designed to distinguish somatic drivers (Figure 2-3 C, D).
Conversely, we assessed for multicollinearity among each feature of the integrated scores so as to identify dominant individual components and leverage the complementary of different prediction algorithms for model performance augmentation. The importance measure for an individual feature can reflect correlations with other features as well as its intrinsic predictive ability because importance may be shared among correlated features. Collinearity indicates a linear relationship in a model. When features are highly correlated, they cannot independently predict the value of the response variable. In statistical terms, they reduce the significance of the features. To assess for possible redundancies in our model, we computed and analyzed
Spearman’s rank pairwise correlations between different prediction scores (Figure 2-4). From our analysis, RadialSVM and LR are highly correlated with one of its original component scores, Mutation Assessor, and moderately correlated with other top performing sequence-based features (PhyloP, PhCons, GerpN, GerpRS, and GerpS). These independent features recorded high
correlation with cancer pathogenicity and can provide classification of cancer driver variations. In our logit model, we observed a significant correlation between RadialSVM and other ensemble-based SinBAD_HVAR,SinBAD_HGMD and MSRV scores (Figure 2-4 B).
Synchronously, the ensemble scores were only moderately correlated with other top performing sequence-based features - LRT, PhyloP, PhCons, SiPhy, PhyloP, GerpN, GerpRS, and GerpS. Furthermore, we observed that GerpRS, GerpN, Mutation Assessor and LRT were weakly correlated with each other and have a fairly low correlation with other scores in the RF model Figure 2-4 A). Hence, no pairwise high collinearity was observed in the RF model. Our results
are consistent with the evaluation of functional and conservation scores in prediction of disease-causing SNVs and application of radial SVM machine learning models to predict patterns of cancer driver mutations (Dong et al., 2016)
Figure 2-4. Pairwise Spearman’s rank correlation coefficients between different prediction scores. The heat map of pairwise Spearman’s rank correlation coefficients is shown for top ranking features in the RF model (A) and logit model respectively (B). The high-ranking features include ensemble based LR and RadialSVM scores.
Hence, these evolutionary-based features may provide orthogonal information to the ensemble scores, leading to the superior feature importance of LR and RadialSVM features.
2.4.2 Model Evaluation: Random Forest (RF) and Logistic Regression (Logit)
For the model diagnostics, we compared the predictive performance of logit and RF models as well the contribution of individual features using area under the curve (AUC) from the receiver operating characteristic (ROC) plots, in which true positive rate TPR (sensitivity) is plotted as a
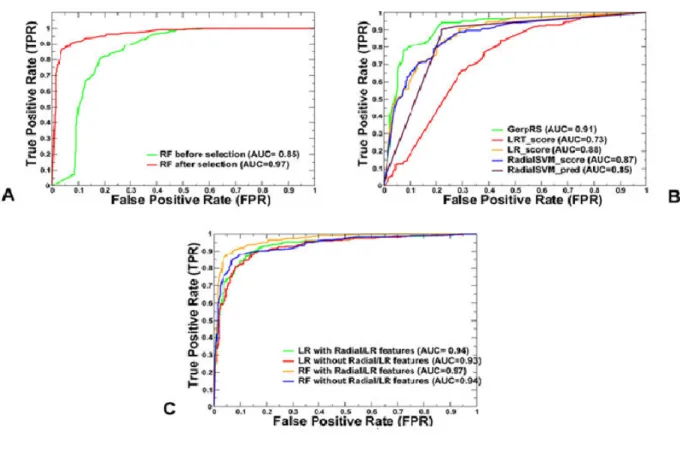
function of 1 – true negative rate TNR (specificity) (Figure 2-5). The plots showed the improved performance of the RF model after the feature selection process was complete (AUC = 0.97) as compared to the original AUC = 0.85 for the initial set of features (Figure 2-5A). By analyzing the contribution of each features to the performance of RF model, we observed that GerpRS achieved as high performance in the testing data set (AUC = 0.91) as the ensemble-based LR score (AUC = 0.88) and RadialSVM score (AUC = 0.87) (Figure 2-5 B). These observations further supported our conclusions that evolutionary conservation scores can often outperform other features, including ensemble based LR and RadialSVM scores. A comparative AUC analysis in the presence and absence of top ensemble scores showed only an insignificant effect on performance of both models (Figure 2-5 C).Interestingly, we observed strong and similar performance in logit and RF models (AUC > 0.9) on the testing set when the top two ensemble features were excluded. These findings showed that ensemble-based scores and functional features based on evolutionary conservation metrics and statistical descriptors of substitution patterns can dominate feature importance ranking. Despite differences in the prediction scores, the obtained highly important features reflected a common fundamental signature, namely that mutations of evolutionarily conserved residues in functional regions are likely to be harmful and can often signify the emergence of cancer driver mutations. In simpler terms, the probabilistic evaluation of deleterious mutations that underlies most of the dominant features appeared to be also sufficient for robust classification of driver mutations in the canonical cancer data.
Figure 2-5. ROC plots of sensitivity (TPR) as a function of 1 – specificity, where specificity is TNR. (A) ROC curves for overall performance of the RF model before and after feature
selection. (B) ROC curves for top 5 prediction scores in the RF model. The ensemble-based LR (AUC = 0.88) and RadialSVM scores (AUC = 0.85) are top performing features in the RF model. A higher AUC score indicates better performance. (C) Comparison of ROC curves for RF and LR models with all selected features and without the top two ensemble scores LR and RadialSVM. These plots illustrated a comparative performance of machine learning models for top prediction scores.
These findings indicated that ensemble-based scores and functional features based on evolutionary conservation measures and statistical descriptors of substitution patterns can dominate feature importance ranking. Despite differences in the prediction scores, the obtained highly important features reflected a common fundamental signature, namely that mutations of evolutionarily conserved residues in functional regions are likely to be deleterious and can often
signify the emergence of cancer driver mutations. In other words, the probabilistic evaluation of deleterious mutations that underlies most of the dominant features appeared to be also sufficient for robust classification of driver mutations in the canonical cancer data sets.
2.5 References
Adzhubei, I. A.; Schmidt, S.; Peshkin, L.; Ramensky, V. E.; Gerasimova, A.; Bork, P.; Kondrashov, A. S.; Sunyaev, S. R. A Method and Server for Predicting Damaging Missense Mutations. Nat. Methods 2010, 7, 248– 249, DOI: 10.1038/nmeth0410-248
Angermueller, C.; Parnamaa, T.; Parts, L.; Stegle, O. Deep Learning for Computational Biology. Mol. Syst. Biol. 2016, 12, 878, DOI: 10.15252/msb.20156651
Bailey, M. H.; Tokheim, C.; Porta-Pardo, E.; Sengupta, S.; Bertrand, D.; Weerasinghe, A.; Colaprico, A.; Wendl, M. C.; Kim, J.; Reardon, B.; Ng, P. K.; Jeong, K. J.; Cao, S.; Wang, Z.; Gao, J.; Gao, Q.; Wang, F.; Liu, E. M.; Mularoni, L.; Rubio-Perez, C.; Nagarajan, N.; Cortes-Ciriano, I.; Zhou, D. C.; Liang, W. W.; Hess, J. M.; Yellapantula, V. D.; Tamborero, D.;
Gonzalez-Perez, A.; Suphavilai, C.; Ko, J. Y.; Khurana, E.; Park, P. J.; Van Allen, E. M.; Liang, H.; Lawrence, M. S.; Godzik, A.; Lopez-Bigas, N.; Stuart, J.; Wheeler, D.; Getz, G.; Chen, K.; Lazar, A. J.; Mills, G. B.; Karchin, R.; Ding, L.Comprehensive Characterization of Cancer Driver Genes and Mutations. Cell 2018, 173, 371, DOI: 10.1016/j.cell.2018.02.060 Biau, G. Analysis of a Random Forest Model. J. Mach. Learn. Res. 2012, 13, 1063– 1095 Carter, H.; Chen, S.; Isik, L.; Tyekucheva, S.; Velculescu, V. E.; Kinzler, K. W.; Vogelstein, B.; Karchin, R. Cancer-Specific High-Throughput Annotation of Somatic Mutations: Computational Prediction of Driver Missense Mutations. Cancer Res. 2009, 69, 6660– 6667, DOI:
Cerami, E.; Gao, J.; Dogrusoz, U.; Gross, B. E.; Sumer, S. O.; Aksoy, B. A.; Jacobsen, A.; Byrne, C. J.; Heuer, M. L.; Larsson, E.; Antipin, Y.; Reva, B.; Goldberg, A. P.; Sander, C.; Schultz, N. The cBio Cancer Genomics Portal: An Open Platform for Exploring
Multidimensional Cancer Genomics Data. Cancer Discovery 2012, 2, 401– 404, DOI: 10.1158/2159-8290.CD-12-0095
Cheng, F.; Zhao, J.; Zhao, Z. Advances in Computational Approaches for Prioritizing Driver Mutations and Significantly Mutated Genes in Cancer Genomes. Briefings Bioinf. 2016, 17, 642– 656, DOI: 10.1093/bib/bbv068
Choi, Y.; Sims, G. E.; Murphy, S.; Miller, J. R.; Chan, A. P. Predicting the Functional Effect of Amino Acid Substitutions and Indels. PLoS One 2012, 7, e46688, DOI:
10.1371/journal.pone.0046688
Chun, S.; Fay, J. C. Identification of Deleterious Mutations within Three Human Genomes. Genome Res. 2009, 19, 1553– 1561, DOI: 10.1101/gr.092619.109
Davydov, E. V.; Goode, D. L.; Sirota, M.; Cooper, G. M.; Sidow, A.; Batzoglou, S. Identifying a High Fraction of the Human Genome to be under Selective Constraint Using GERP++. PLoS Comput. Biol. 2010, 6, e1001025, DOI: 10.1371/journal.pcbi.1001025
Ding, L.; Wendl, M. C.; McMichael, J. F.; Raphael, B. J. Expanding the Computational Toolbox for Mining Cancer Genomes. Nat. Rev. Genet. 2014, 15, 556– 570, DOI: 10.1038/nrg3767 Ding, L.; Bailey, M. H.; Porta-Pardo, E.; Thorsson, V.; Colaprico, A.; Bertrand, D.; Gibbs, D. L.; Weerasinghe, A.; Huang, K. L.; Tokheim, C.; Cortes-Ciriano, I.; Jayasinghe, R.; Chen, F.; Yu, L.; Sun, S.; Olsen, C.; Kim, J.; Taylor, A. M.; Cherniack, A. D.; Akbani, R.; Suphavilai, C.; Nagarajan, N.; Stuart, J. M.; Mills, G. B.; Wyczalkowski, M. A.; Vincent, B. G.; Hutter, C. M.; Zenklusen, J. C.; Hoadley, K. A.; Wendl, M. C.; Shmulevich, L.; Lazar, A. J.; Wheeler, D. A.;