A Novel Technique for Fingerprint Classification
based on Fuzzy C-Means and Naive Bayes Classifier
G.
Vitello,
F.
Sorbello,
G.I.M.
Migliore
DepartmentofComputerChemical, Management, Engineering, MechanicUniversity of Palermo, Italy {giuseppe.vitello, filippo.sorbello}@unipa.it
V. Conti
Faculty of Engineering and Architecture University of Enna Kore, Italy
vincenzo.conti@unikore.it
S. Vitabile
Department of Biopathology, Medical and Forensic Biotechnologies University of Palermo, Italy salvatore.vitabile@unipa.it
Abstract — Fingerprint classification is a key issue in automatic fingerprint identification systems. One of the main goals is to reduce the item search time within the fingerprint database without affecting the accuracy rate. In this paper, a novel technique, based on topological information, for efficient fingerprint classification is described. The proposed system is composed of two independent modules: the former module, based on Fuzzy C-Means, extracts the best set of training images; the latter module, based on Fuzzy C-Means and Naive Bayes classifier, assigns a class to each processed fingerprint using only directional image information. The proposed approach does not require any image enhancement phase. Experimental trials, conducted on a subset of the free downloadable PolyU database, show a classification rate of 91% over a 100 images test database using only 12 training examples.
Keywords: Fingerprint Classification, Directional Images, Fuzzy C-Means, Naive Bayes Classifier.
I. INTRODUCTION
Fingerprints are composed by ridges and valleys which form unique geometric pattern in the skin. They are characterized by ridge lines which often run parallel and form end points and bifurcations. These points are called minutiae and they are categorized as fingerprint micro features [1]. In fingerprints, generally, there are other characteristics, called macro features, described by regions with irregular ridge line flows. These macro features are called Delta and Core [2]. The core point is the center of a circular edge pattern on a fingerprint image, and the delta point is the center of a triangular edge pattern.
In real-time fingerprint recognition systems it is required high response speed and, for intrinsic security reasons, a low false acceptance rate. The identification process performed in a database divided in classes is faster, since the number of necessary comparisons can be reduced by searching the fingerprint only in the same class of the database. Many fingerprint classification approaches are reported in literature based on macro features [2][3], structural information [4], neural networks [5][6][7], stochastic model [8][9], fuzzy-neural techniques [10], etc. Unfortunately, macro features are not always present in fingerprint images due to image acquisitions not correctly performed, such as in partial fingerprint
[11]. In this case, may be useful the approach proposed in [12] using pseudo-singularity points.
In this paper, the authors propose the implementation of a novel technique, based on Fuzzy C-Means and Naive Bayes classifier, for efficient training and test phases in fingerprint classification systems. The proposed system classifies fingerprint images into four classes, using only directional image information [2]. With more details, it is composed of two independent modules: Training Dataset Selection Module and Fingerprint Classification Module. The former module performs the training phase, while the latter module classifies a fingerprint image in one of the following NIST standard classes [13][14]: Left Loop, Right Loop, Tented Arch and Whorl. Using the proposed approach no image enhancement processing is necessary and only a little set of images with good quality, for each class, is used as training dataset. Experimental trials have been conducted on a subset, composed of about 250 images, of the free downloadable PolyU database [15].
The paper is structured as follow. Section II reports the main literature works on fingerprint image classification. Section III describes the proposed system. Section IV outlines the experimental results. Finally, conclusions are reported in section V.
II. RELATEDWORKS
Many classification approaches have been proposed in literature and many researchers are still working in this field. Some of these works are briefly reported.
Ballan et al. in [2] first reduce image distortion and contrast, before computing the fingerprint directional image. Then, they extract the singular points from it and finally classify the fingerprint using topological and numerical considerations about these points.
Maio and Maltoni in [4] propose a new structural approach to fingerprints classification. It computes a relational graph, summarizing the macro-structure of the fingerprint, from the segmentation of the directional image. The obtained graph is compared with model graphs in order to classify the fingerprint.
In [8] Jung and Lee use a probabilistic approach (Markov model) based on the fingerprint ridge characteristics of each class, while Senior in [16] describes a novel method of classification based on
hidden Markov models and decision trees to recognize the ridge structure, without needing to detect singular points.
Pattichis et al. in [17] focus their work primarily on the image and feature enhancement and on finding improved classifiers, and less on the development of novel fingerprint representations. Using an AM–FM (Amplitude Modulated-Frequency Modulated) representation for each fingerprint, they obtain significant gains in classification performance.
III. THEPROPOSEDSYSTEM
The goal of the proposed work is the implementation of a novel technique, based on Fuzzy C-Means and Naive Bayes classifier, for efficient training and test phases in fingerprint classification. The proposed system is based on the application of a processing technique to increase and enhance the information from Fuzzy C-Means to Naive Bayes. With more details, it is composed of two independent modules: Training Dataset Selection Module and Fingerprint Classification Module. The former module extracts the best set of training images; the latter module, using only directional image information [2], classifies a fingerprint image in one of the following NIST standard classes [13][14]: Left Loop, Right Loop, Tented Arch and Whorl. With the proposed approach, no fingerprint image enhancement processing is required. In addition, unlike literature approaches which use a lot of training data (for example, in [6] the authors use 30 images per class, while in [8] the authors use 50% of the whole database), the proposed classification module only needs 3 directional images per class.
A. Modules Description
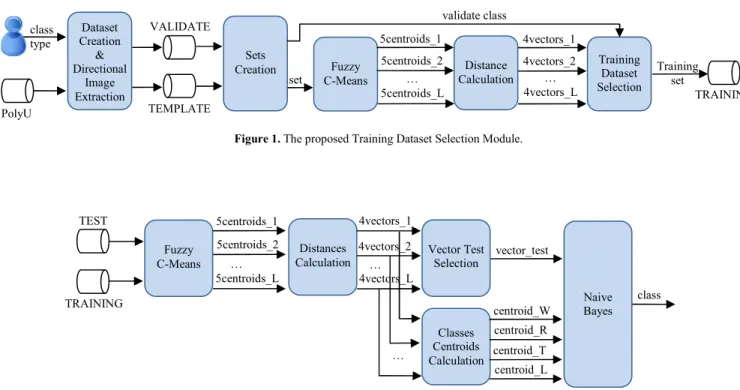
¾ Training Dataset Selection Module
Figure 1 depicts the proposed module for the training dataset selection.
1. DATASET CREATION TASK
First, a database subset of X images, randomly chosen, is processed by an algorithm evaluating the images quality. After an exhaustive analysis of the literature methods for fingerprint image quality evaluation, a mixed algorithm, inspired by works proposed in [18][19], has been implemented. Only images of good quality are selected and their directional information is extracted. Then, directional images are randomly divided into two databases, VALIDATE (75%) and TEMPLATE (25%). Finally, directional images of both databases are hand classified into the four NIST classes, with the constraint that each class should contain at least L images.
2. DIRECTIONAL IMAGE EXTRACTION TASK
The directional image represents the local orientation of ridges in the original gray-scale image [2].
It is computed in three steps:
1. extraction of the direction for each pixel;
2. processing of the previous step output assembling the pixels in 8x8 blocks;
3. computing of the predominant direction for each block (in every 8x8 pixel block, the direction with greater frequency is attributed to the considered block).
The direction
ܦሺ݅ǡ ݆ሻ
of the pointሺ݅ǡ ݆ሻ
is defined through the following equation (1):ܦሺ݅ǡ ݆ሻ ൌ ݉݅݊ ൣܥ൫݅ௗǡ݆ௗ൯ െ ܥሺ݅ǡ ݆ሻ൧
ௗୀଵ
(1)
where
ܥሺ݅ǡ ݆ሻ
andܥ൫݅
ௗǡ݆
ௗ൯
indicate the grey level ofሺ݅ǡ ݆ሻ
and (݅
ௗǡ݆
ௗ) points, respectively, while q is the number of selected pixels in this calculation along a considered direction. In this work, 8 directions have been chosen (from 0° to 180°), while a number of q=16 pixels along the direction (eight in a direction and eight in the opposite direction) have been considered. However, the noise can affect the calculation of predominant directions inside noisy zones of the image. Then, this direction could be different from the predominant directions of neighbor zones. Therefore, a smoothing algorithm is applied. This is achieved by calculating the directional histogram, comparing directions of areas of 3x3 blocks. The final direction of the central block of the considered area is replaced by the higher frequency direction of the neighboring blocks.3. SETS CREATION TASK
Inordertoextractthebestsetoftrainingdirectionalimages, the proposed task performs the following steps:
1. it creates K collections of L Template images per class, randomly selected;
2. for each collection, randomly combining the 4*L
images, it forms N different sets. Each set is made up of L groups, and each group contains 4 Template images, one per class.
3. it adds the same Validate image to all groups of the same set;
4. it repeats step 3 with M different Validate images, randomlyselected, creating M different version of the same set.
4. FUZZY C-MEANS TASK
It processes one set version per time and calculates 5 centroids (the cluster centers, each consisting of 5 elements) per group: the centroid of the Validate image and the centroids of the 4 Template images.
5. DISTANCES CALCULATION TASK
It calculates the distances, element by element, between the centroid of the Validate image and the centroids of the 4 Template images belonging to the same group. By comparing such distances with a threshold it creates 4 binary vectors (each consisting of 5 elements), for each group.
6. TRAINING DATASET SELECTION TASK
For each set, it processes the 4*M*L binary vectors (4*L
binary vectors for each version of the same set) and, through the analysis of the K*N sets, it identifies the one (made up of L groups, each containing 4 directional images, one per class) that best represent the training dataset.
¾ Fingerprint Classification Module
Figure 2 depicts the proposed fingerprint classification module, based on Fuzzy C-Means and Naive Bayes classifier. It performs the tasks following described.
1. FUZZY C-MEANS TASK
It processes the Test image and the 4*L Training images (4 images per group) and it calculates 5*L centroids: the
centroid of the Test image and the centroids of the 4 Training images, for each group.
2. DISTANCES CALCULATION TASK
For each group, it calculates the distances, element by element, between the centroid of the Test image and the centroids of the 4 Training images. By comparing such distances with a threshold it creates 4 binary vectors (each consisting of 5 elements), for each group.
3. VECTOR TEST SELECTION TASK
It analyzes the 4*L binary vectors and identifies the one that best represent the Test image.
4. CLASSES CENTROIDS CALCULATION TASK
Reorganizing the 4*L binary vectors, so that each group is made up of the L vectors of the same NIST class, it calculates 4 centroids (centroid_W, centroid_R, centroid_L and centroid_T), one for each class.
5. NAIVE BAYES TASK
It performs the classification of the Test image, according to literature approach, on the basis of the 5 vectors (each consisting of 5 elements) selected in tasks described in subsections 3 and 4.
Figure 1. The proposed Training Dataset Selection Module.
Figure 2. The proposed Fingerprint Classification Module. Vector Test Selection vector_test Classes Centroids Calculation Naive Bayes class centroid_W centroid_R centroid_L … Fuzzy C-Means Distances Calculation 5centroids_1 5centroids_2 … 5centroids_L … 4vectors_L 4vectors_2 4vectors_1 centroid_T TEST TRAINING VALIDATE PolyU class type set Dataset Creation & Directional Image Extraction TEMPLATE Sets Creation Fuzzy C-Means 5centroids_1 5centroids_2 … 5centroids_L Distance Calculation Training Dataset Selection Training set 4vectors_1 4vectors_2 … 4vectors_L validate class TRAINING
B. Tasks Implementation Guidelines
In what follows, tasks implementation guidelines are reported.
1. SETS CREATION TASK
In order to obtain a low execution time, some parameters have been fixed as follows:
• K = 50 collections have been generated;
• N = 100 different sets have been built for each collection;
• M = 100 different Test images have been used; • L has been experimentally fixed to 3, thus creating
3 groups per set, since experimental trials with
L=1, 2 and 4 shown worst classification rates.
2. FUZZY C-MEANS TASK
Fuzzy C-Means (FCM) is one of the most famous clustering algorithms, where the letter C refers to the number of used clusters. With this method, each data can have partial membership in multiple clusters, with the constraint that the sum of all the membership values must be 1.
FCM is an iterative algorithm and its purpose is to find cluster centers to minimize an objective function. In the proposed work, the cluster centers are the centroids of the directional images.
The objective function is described by the formula (2):
ܬிெ ൌ ݑԡݔെݒԡଶ ே ୀଵ ୀଵ (2) with ቐ Ͳ ݑ ͳ σ ݑൌ ͳ ୀଵ Ͳ ൏ σேୀଵݑ൏ ܰ where:
• C is equal to 5 (one for each NIST class and one for the image to be classified);
• ݑ indicates the membership value of the kth object to the ith cluster;
• ݔ is the kth element of the input (the directional image to be classified);
• ݒ is the ith centroid of the cluster; • ԡǤ ԡ represents the Euclidean distance;
• p = [1, ) is a constant that determines the
fuzziness degree of the classification process. If p
= 1, the only membership degrees of objects to clusters are 0 and 1. Conversely, if p , the objective function J 0. Generally, fuzzy clustering membership is proportional to the
corresponding p value. In the proposed work p
has been experimentally fixed to 6.
The ith centroid of the cluster is calculated by the formula (3): ݒൌσ ሺݑ כݔ ሻ ே ୀଵ σே ݑ ୀଵ (3)
The kth object of the ith cluster ݑ is calculated by the formula (4):
ݑൌ ͳ
σ
ୀଵ ሺௗௗೖೕೖሻଶ ሺିଵሻΤ (4)
with ݀ൌ ԡݔെݒԡଶ
The stop condition is described by the relation (5):
ห ܬிெሾ݅௧݅ݐ݁ݎܽݐ݅݊ሿ െ ܬிெሾሺ݅ െ ͳሻ௧݅ݐ݁ݎܽݐ݅݊ሿ ห ൏ ߳ (5)
where ߳ has been experimentally fixed to 0.1.
Summarizing, the Fuzzy C-Means algorithm performs the following steps [20]:
• it initializes a preliminary fuzzy partition U, with the incoming directional images;
• it uses formula (3) to calculate the centroids and then formula (4) to update the partition U;
• it calculates a function of dissimilarity between the centroids and the data input (i.e. the objective function described by the formula (2)), and then iteratively applies formulas (3) and (4) until the relation (5) is satisfied.
3. DISTANCES CALCULATION TASK
This task calculates the distances, element by element, between centroids. By comparing such distances with a threshold , it creates binary vectors. In this work has been experimentally fixed to 0.1. It represents the minimum value of the error tolerance, acceptable for the proposed system.
4. TRAINING DATASET SELECTION TASK
In order to identify the best set of training directional images, this task, first, elaborates the 4*M*L binary vectors, for each set. Then, it analyzes the K*N sets, for each collection. It selects the set made up of more 1 than 0, considering only the vectors of the same class of the Validate image.
5. TEST SELECTION TASK
For the selection of the binary vector that best represents the directional image to classify, this task chooses the first
among those containing more 1 than 0 values, since its distance from the image to classify is minimal.
6. CLASSES CENTROIDS CALCULATION TASK
First, it reorganizes the 4*L binary vectors, so that each group contains L vectors of the same NIST class. Then, it calculates 4 centroids, one for each class, computing the average of the respective elements.
7. NAIVE BAYES TASK
A Naive Bayes classifier is a simple probabilistic classifier based on the Bayes theorem with strong independence assumptions. It assumes that the domain variables are independent, given the class, and each variable has a finite number of values.
Generally, a Naive Bayes classifier is associated to a Bayesian Network which codifies the independent relations between domain variables. Its graphical structure is a directed, acyclic graph in which nodes represent domain variables [20]. A Bayesian Network encodes the joint probability distribution of a set of n variables, {x1, …,
xn}, as a graph and a set of conditional probability
distributions (CPDs). Prior probabilities are assigned to source nodes, and conditional probabilities are associated with arcs. With more details, for each source node xi, (i.e. a node without any incoming arcs), there is a prior probability function P(xi); for each node xi with one or more direct predecessors yi, there is a conditional probability function P(xi | yi). Each node CPD gives the probability of each state of the considered variable with every possible combination of states of its parents. The key feature of Bayesian Networks is their explicit representation of the conditional independence among events.
Consider a general probability distribution of two variables, p(x1, x2). Using Bayes rule, without loss of generality, it is possible to write:
p(x1, x2) = p(x1 | x2)*p(x2) (6) Similarly, considering another class variable, y, it is possible to write, using Bayes rule:
p(x1, x2 | y) = p(x1 | x2, y)*p(x2 | y) (7) In the above expression, no assumption has been done. Consider now the term p(x1 | x2, y). If knowledge of y is sufficient to determine how x1 will be distributed, any knowledge about the state of x2 is necessary:
p(x1| x2, y) = p(x1,| y) (8) It is possible to generalize the case of two variables to a conditional independence assumption for a set of variables x1, x2, … , xn, conditional on another variable y:
ሺଵǡ ଶǡ ǥ ǡ ୬ȁ ሻ ൌ ෑ ሺ୧ȁሻ
ୀଵ
(9)
Equation (9) is the basis for the Naive Bayesian classifier. Despite their naive design and apparently oversimplified assumptions, Naive Bayes classifiers work fine in many complex real-world situations and they only require a small amount of training data. All model parameters (i.e., prior class probabilities and feature probability distributions) can be approximated with relative frequencies from the training set. These are maximum likelihood estimates of the probabilities. Prior class probabilities may be calculated using two methods:
1. by assuming the same classes probability (i.e.,
priors = 1 / number of classes), or
2. by calculating an estimate for the class probability from the training set (i.e., prior for a given class =
number of samples in the class / total number of samples).
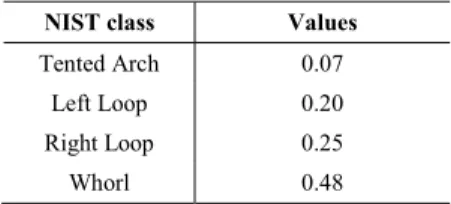
In the proposed work, the prior class probabilities of the NIST classes have been calculated using the second method (Table 1).
Table 1. Prior class probabilities of the four NIST classes.
NIST class Values
Tented Arch 0.07 Left Loop 0.20 Right Loop 0.25
Whorl 0.48
IV. EXPERIMENTALRESULTS
In order to evaluate the performance of the proposed approach, the implemented system has been tested on a free downloadable database. Some interesting database characteristics are reported in subsection IV.1, while the obtained experimental results, in terms of classification rates, are outlined in the subsection IV.2.
1. DATABASE DESCRIPTION
The team working in the Biometrics Research Centre (UGC/CRC) of the Hong Kong Polytechnic University has developed a high resolution fingerprint imaging device and has used it to construct a large-scale high resolution fingerprint database [15]. It contains 1480 fingerprint images of 320x240 pixels, with a resolution around 1,200 dpi of 148 users, 10 acquisitions per user of two fingers (Figure 3). Each image name has been described using three numbers in the following way: first number represents the user, second number represents the finger, and third number represents the different acquisition (image 7.4.2 => second acquisition of the forth finger of the seventh user).
Figure 3. Two example images of the high resolution fingerprint images of the PolyU database.
2. CLASSIFICATION ACCURACY
In this work, a database subset of X=148 images has been extracted from the full database for the training dataset selection. It has been processed by a system evaluating the images quality inspired by works proposed in [18][19]. Only 136 images overcame the quality constraints. Then, the extracted directional images have been divided into two databases: VALIDATE (102 images) and TEMPLATE (34 images), both used by the proposed Training Dataset Selection Module. Finally, directional images of both databases are hand classified into the four NIST classes, with the constraint that each class should contain at least 3 images. A different database (TEST) of 100 images of good quality has been used to test the proposed Fingerprint Classification Module.
Table 2 shows experimental results in terms of classification rate with L=1, 2, 3 and 4.
Table 2. Classification rates of the proposed approach based on Fuzzy C-Means and Naive Bayes classifier with L=1, 2, 3 and 4.
L Classification rate 1 60% 2 82% 3 91% 4 87% TOTAL 91/100
With more details, Table 3 reports the system accuracy in terms of classification rate, also showing the values for each NIST class with L=3.
Table 3. Classification rates of the proposed approach based on Fuzzy C-Means and Naive Bayes classifier with L=3.
NIST class PolyU Percentage %
Tented Arch 6/7 85.71 % Left Loop 18/20 90.00 % Right Loop 22/25 88.00 %
Whorl 45/48 93.75 %
TOTAL 91/100 91.00 %
Finally, Table 4 reports comparisons, in terms of classification rate, between the proposed technique and some of the most relevant literature approaches.
Table 4. The proposed technique compared to the most relevant literature approaches.
System Accuracy Rate Used Database
[5] 80.20% unknown [6] 75.93% FVC2002-DB2B [8] 80.10% FVC2000 DB1 FVC2002 DB1 [10] 92.44% NIST-4 [16] 91.47% NIST-4 The proposed 91.00% PolyU
V. CONCLUSIONS
In this work a novel fingerprints classification method based on fingerprint topological information has been described. The proposed system is the implementation of a novel technique, based on Fuzzy C-Means and Naive Bayes classifier, for efficient training and test phases. It is composed of two independent modules to extract the best training dataset and classify fingerprint images into four classes. It uses only directional image information and no
image enhancement phases have been used. Unlike
literature approaches which use a lot of training data, the proposed system only needs 3 directional images per class. The experimental results show a classification rate of the whole system of 91%, over a database of 100 images.
The proposed technique introduces interesting
characteristics in user authentication for mobile devices and Cloud services, considering the few image information and low computational costs required.
REFERENCES
[1] A. Jain, L. Hong, and R. Bolle, “On-Line Fingerprint Verification”, IEEE Transaction on Pattern Analysis and Machine Intelligence, 1997, Vol. 19, No. 4, pp. 302-314
[2] M. Ballan, F. A. Sakarya and B. L. Evans, “A Fingerprint Classification Technique Using Directional Images”, proc. of the 31st Asilomar Conference on Signal, System and Computer, 1997, Vol. 1, pp. 101-104
[3] A. I. Awad and K. Baba, “Singular Point Detection for Efficient Fingerprint Classification”, International Journal on New Computer Architectures and Their Applications (IJNCAA), 2012, Vol. 2, Issue 1, pp. 1-7, ISSN: 2220-9085 [4] D. Maio and D. Maltoni, “A Structural Approach to Fingerprint
Classification”, proc. of the 13th International Conference on Pattern Recognition (ICPR), 1996, Vol. 3, pp. 578-585 [5] S. R. Patil and S. R. Suralkar, “Fingerprint Classification using
Artificial Neural Network”, International Journal of Emerging Technology and Advanced Engineering, Volume 2, Issue 10, pp. 513-517, 2012, ISSN 2250-2459
[6] V. Conti, C. Militello, S. Vitabile and F. Sorbello, “An Embedded Fingerprints Classification System based on Weightless Neural Networks”, Frontiers in Artificial Intelligence and Applications – IOS Press Editor, Volume 193: New Directions in Neural Networks, 2009, pp. 67-75, ISSN 0922-6389, doi:10.3233/978-1-58603-984-4-67 [7] M. Kamijo, “Classifying Fingerprint Images using Neural
Network: Deriving the Classification State”, proc. of the IEEE International Conference on neural networks, 1993, Vol. 3, pp. 1932-1937
[8] H.-W. Jung and J.-H. Lee, “Fingerprint Classification Using the Stochastic Approach of Ridge Direction Information”, proc. of the IEEE International Conference on Fuzzy Systems, 2009, pp. 169-174, DOI: 10.1109/FUZZY.2009.5277309, ISSN: 1098-7584 [9] S. Qing, L. Xisheng, Y. Hui and Q. Chen, “Naive Bayes
Classifier applied in Droplet Fingerprint Recognition”, proc. of the 3rd Global Congress on Intelligent Systems (GCIS), 2012, pp. 152-155, DOI: 10.1109/GCIS.2012.68, ISBN: 978-1-4673-3072-5
[10] S. M. Mohamed and H. O. Nyongesa, “Automatic Fingerprint Classification System Using Fuzzy Neural Techniques”, proc. of the IEEE International Conference on Fuzzy System, 2002, Vol. 1, pp. 358-362
[11] V. Conti, G. Vitello, F. Sorbello, and S. Vitabile, “An Advanced Technique for User Identification using Partial Fingerprint”, proc. of the 7th International IEEE Conference on Complex, Intelligent and Software Intensive Systems (CISIS), 2013, pp. 236-242, ISBN 978-0-7695-4992-7, DOI 10.1109/CISIS.2013.46
[12] V. Conti, C. Militello, S. Vitabile and F. Sorbello, “Introducing Pseudo-Singularity Points for Efficient Fingerprints Classification and Recognition”, proc. of the 4th IEEE International Conference on Complex, Intelligent and Software Intensive Systems (CISIS), 2010, pp. 368-375, ISBN: 978-0-7695-3967-6, DOI: 10.1109/CISIS.2010.134
[13] D. Maltoni, D. Maio, A. K. Jain and S. Prabhakar, “Handbook of Fingerprint Recognition”, Springer (New York), 2003
[14] National Institute of Standards and Technology: www.nist.gov [15] PolyU (Hong Kong Polytechnic University) database.
http://www.comp.polyu.edu.hk/~biometrics/HRF/HRF.htm [16] A. Senior, “A Combination Fingerprint Classifier”, IEEE
Transaction on Pattern Analysis and Machine Intelligence, 2001, Vol. 23, No. 10, pp. 1165-1174
[17] M. S. Pattichis, G. Panayi, A. C. Bovik, and S.-P. Hsu, “Fingerprint Classification Using an AM–FM Model”, IEEE Transactions on Image Processing, 2001, Vol. 10, No. 6, pp. 951-954
[18] J. Qi, D. Abdurrachim, D. Li, H. Kunieda, “A Hybrid Method for Fingerprint Image Quality Calculation”, proc. of 4th IEEE Workshop on Automatic Identification Advanced Technologies, 2005, pp. 124-129, ISBN: 0-7695-2475-3, DOI: 10.1109/AUTOID.2005.3
[19] F.J. Ani, X.P. Cheng, “Approach for Estimating the Quality of Fingerprint Image based on the Character of Ridge and Valley Lines”, proc. of International IEEE Conference on Wavelet Active Media Technology and Information Processing (ICWAMTIP), 2012, pp. 113-116, ISBN: 978-1-4673-1684-2, DOI: 10.1109/ICWAMTIP.2012.6413452
[20] J.-S. Zhang and Y.-W. Leung, “Improved Possibilistic C-Means Clustering Algorithms”, IEEE Transaction on Fuzzy Systems, 2004, Vol. 12, No. 2, pp. 209–217, ISSN 1063-6706, DOI: 10.1109/TFUZZ.2004.825079