Title page
Title: Predictive validity of Multiple Mini Interview scores for future academic and clinical placement performance in Physiotherapy, Occupational therapy and Speech and language therapy programmes.
*Ms Swati Kale, Lecturer in Physiotherapy
School of Health Sciences, University of East Anglia, Norwich Research Park. NR4 7TJ Dr Meghana M Kamble, Lecturer in Psychology for Speech and Language Therapy, School of Health Sciences, University of East Anglia, Norwich Research Park. NR4 7TJ Professor Nicola Spalding, Professor of Occupational Therapy
School of Health Sciences, University of East Anglia, Norwich Research Park. NR4 7TJ *Corresponding author: Ms Swati Kale, Lecturer in Physiotherapy, School of Health Sciences, University of East Anglia, Norwich Research Park. NR4 7TJ
email:[email protected], Telephone: 00 44 1603 593596, Fax: 00 44 1603 593166
Abstract (198 words)
Background/Aims: Traditional interviews were replaced by Multiple Mini Interviews (MMIs) in the selection process of undergraduate programmes for Physiotherapy,
Occupational Therapy and Speech and Language Therapy in one UK university. The purpose of this secondary data analysis was to determine if MMIs can predict academic and clinical placement performance during the first and second year of study.
Methods: Secondary data analysis was performed using the admissions data of 169 students comprising of Entry Tariff (ET), age and MMI scores, academic and placement achievement in years one and two over a period of two years (2014-16).
Findings: Multiple standard regression analysis revealed that overall MMI was not a significant predictor of academic achievement and clinical placement performance in years one and two for all three professions. Pearson’s correlations indicated age and entry tariff were frequently and significantly correlated with academic achievements for all cohorts.
Conclusion: Limited research exists into the predictive validity of MMIs into the therapy programmes. Our results show that performance in the MMI is not a predictor of academic achievement or clinical placement performance in this specific cohort of students. Entry tariff showed a significant correlation with academic achievement. Additional studies with larger cohorts are recommended.
Conflict of Interest: None
Acknowledgements
Thank you to XX from the Local Support Team (XX) for assistance with collating and anonymising the data, XX (Admissions Officer) for help with the admissions data, XX from the Business Intelligence Unit for extracting the data from various sources and pooling it in Tableau. We would also like to thank XX (Head of Admissions) and XX (Learning and Teaching Manager) for their cooperation and support.
Anonymous manuscript
Predictive validity of Multiple Mini Interview scores for future academic and clinical placement performance in Physiotherapy, Occupational Therapy and Speech and Language Therapy programmes.
Abstract (198 words)
Background/Aims: Traditional interviews were replaced by Multiple Mini Interviews (MMIs) in the selection process of undergraduate programmes for Physiotherapy,
Occupational Therapy and Speech and Language Therapy in one UK university. The purpose of this secondary data analysis was to determine if MMIs can predict academic and clinical placement performance during the first and second year of study.
Methods: Secondary data analysis was performed using the admissions data of 169 students comprising of Entry Tariff (ET), age and MMI scores, academic and placement achievement in years one and two over a period of two years (2014-16).
Findings: Multiple standard regression analysis revealed that overall MMI was not a significant predictor of academic achievement and clinical placement performance in years one and two for all three professions. Pearson’s correlations indicated age and entry tariff were frequently and significantly correlated with academic achievements for all cohorts. Conclusion: Limited research exists into the predictive validity of MMIs into the therapy programmes. Our results show that performance in the MMI is not a predictor of academic achievement or clinical placement performance in this specific cohort of students. Entry tariff showed a significant correlation with academic achievement. Additional studies with larger cohorts are recommended.
Keywords: MMI; Physiotherapy; Predictive validity; Occupational Therapy; Speech and Language Therapy
Key Points:
Limited research exists on the predictive validity of MMI on academic performance in Physiotherapy, Occupational Therapy and Speech and Language Therapy professions.
This study did not show MMI to be a predictor of academic and clinical placement performance but it could be a useful tool in assessing non-cognitive attributes such as inter personal skills, empathy, resilience, compassion and team working that are deemed necessary for professional success on these programmes.
Entry Tariff is known to have a correlation with academic performance. This study showed a correlation between entry tariff and academic performance.
(Word count- 3268 words) Introduction
It is vital that recruitment, selection and retention of suitable students to pre-registration health and social care programmes is rigorous, equitable and meets professional and regulatory requirements. Selection processes should support the ideal applicants to a health care programme and are critical to the academic and professional success of students (HCPC 2018). Hence along with academic ability judged through previous educational attainment, most healthcare programmes also need to ensure that applicants can demonstrate non-
cognitive attributes such as inter personal skills, empathy, resilience and compassion, deemed necessary for academic and professional success (Callwood et al.2018;Gale et
al.2016;Grice.2014). Recruitment processes in the UK also need to ensure values-based recruitment (VBR) as set out by Health Education England which is an approachthat selects students on the basis that their individual values aligns with the values of the National Health Service Constitution (HEE 2016).
Prior to 2013, the XX School at the XX University employed a traditional method of applicant interview for admission to Physiotherapy (PT), Occupational Therapy (OT) and Speech and Language Therapy (SLT) programmes wherein a two-member panel consisting of one academic and one clinician from the relevant profession, interviewed each applicant which was an investment in time and resources. Under the traditional method of interviewing six applicants represented a ratio of 1:2 and 12 hours of interviewer time, whereas MMIs had a ratio of 2:1 (24 applicants to 12 hours of interviewer time). Traditional interviews are considered time consuming and resource intensive (Grice 2014) and susceptible to context specificity and the effect of chance, raising concern over their reliability (O’Brien et al. 2011;
and less by personality and individual characteristics (Eva et al. 2014) and thus lack reliability and validity.
MMIs are increasingly used internationally in a range of health programmes in recognition that they support judgement of non-cognitive attributes (Power and Clues 2015; Husband and Dowell 2013). MMIs can be valuable for selecting health professionals and have been
perceived to be fair and reasonable by both applicants and assessors (Razack et al. 2009). Many healthcare programmes have chosen to replace conventional interviews with MMIs as they are shown to be reliable (Callwood et al. 2014; Grice 2014, Knorr and Hissbach 2014; Perkins et al. 2013; Griffin and Wilson 2012) and help to reduce bias from age, gender, nationality and location of secondary school education (Gale et al 2016). A systematic review of selection in health professions education demonstrated that MMIs are reliable, acceptable and feasible and the best predictor of subsequent academic performance (Pau et al.2013). A survey by Grice (2014) of applicants and interviewers at the University of Texas who experienced MMIs for entry to OT programmes reported MMIs were the favoured method of selection. Applicants rated MMIs a better and fairer experience compared to one to one interviews and satisfaction was rated as high. Interviewers recognised greater efficiency, found them to be effective and comprehensive than one to one interviewing. This concurs with findings that MMI requires less resources including interviewer’s time (Eva et al. 2014). A systematic review by Rees et al (2016) on using MMISs for selection to undergraduate healthcare programmes demonstrate predictive value of MMIs, they conclude that even when candidates are aware of the content, have been coached or have previous experience with MMIs, their performance is not affected positively. This suggests MMIs are more reliable than traditional interviews in the selection process. Research evidence has established that MMIs can be useful in predicting future academic performance of pre-registration
dental students (Alaki et al.2016). Cameron et al (2017) have reported MMI as the only admissions tool to significantly predict academic performance in pre-registration pharmacy programme. Whilst there is evidence of predictive validity of MMIs in medicine (Lee et al. 2016), dental, pharmacy and other health professions more research is advocated (Thomas et al. 2017) to assess their efficacy as a valid selection tool within the pre-registration therapy programmes.
In the XXX, MMIs were introduced in 2013-14 for selection of therapy candidates for 2014 entry and subsequently for 2015 entry to create a more efficient interview process. In order to identify if MMIs are an effective method to select students with the necessary attributes desired by the University, Professional and Statutory Regulatory Bodies (PSRB) and employers of graduates, secondary data analysis was carried out in 2016.
The aim of this study was to evaluate the predictive validity of MMI’s for future academic and clinical performance of first and second year pre-registration students on the OT, PT and SLT programmes. The specific research questions were:
1. Is there a relationship between MMI scores and academic performance in Years one and two for PT, OT and SLT programmes?
2. Is there a relationship between MMI scores and clinical placement performance in Year one and two for PT, OT and SLT programmes?
Method
Secondary data analysis was carried out to investigate the relationship of MMI scores, entry tariff (ET) and age with subsequent clinical placement and academic performance on the programmes. Entry Tariff was calculated by adding points allocated by the Universities and
Colleges Admission Service (UCAS) to qualifications generally studied between the age of 16-18 years in the UK (UCAS,UK).
Participants
Students enrolled on the BSc PT, BSc OT and BSc SLT programmes from September 2014- 15 and September 2015-16 were included (n=169). Students not selected through this
process; if they were selected by the old traditional method of interviewing, were not included. Only first attempt outcomes for academic and placement performance was used. Year one and two academic and clinical placement performance scores for PT, OT and SLT students who were selected via the MMI method for 2014-15 and 2015-16 entry were used. Personnel from the university administration services collated required data on an excel spreadsheet made bespoke for this study, which was then anonymised by a school support employer acting independently. These personnel were not part of the research team. Thus, all data received by the research team was anonymised and not identifiable.
Multiple Mini Interviews
In preparation for MMIs, workshops were held comprising academics, clinicians and service users to determine the attributes to be assessed for each MMI station. Of importance was determining that NHS Constitutional values were met. The NHS is founded on a common set of principles, six values have been identified such as working together for patients, respect and dignity, commitment to quality of care, compassion, improving lives and everyone counts (Health Education England 2019). After workshop consultations and refinement, it was agreed that four MMI stations would make the selection process more efficient of time and resources whilst still enabling the values to be assessed. Each station was equal in duration for ease of administration.
The MMIs consisted of four stations:
1. Station ONE with academic: Knowledge of the profession and relevant experience. 2. Station TWO with clinician: Personal suitability for the profession.
3. Station THREE with academic: Personal suitability for the course
4. Station FOUR with service user: Awareness and understanding of issues surrounding disability by watching a video clip of a person living with a disability.
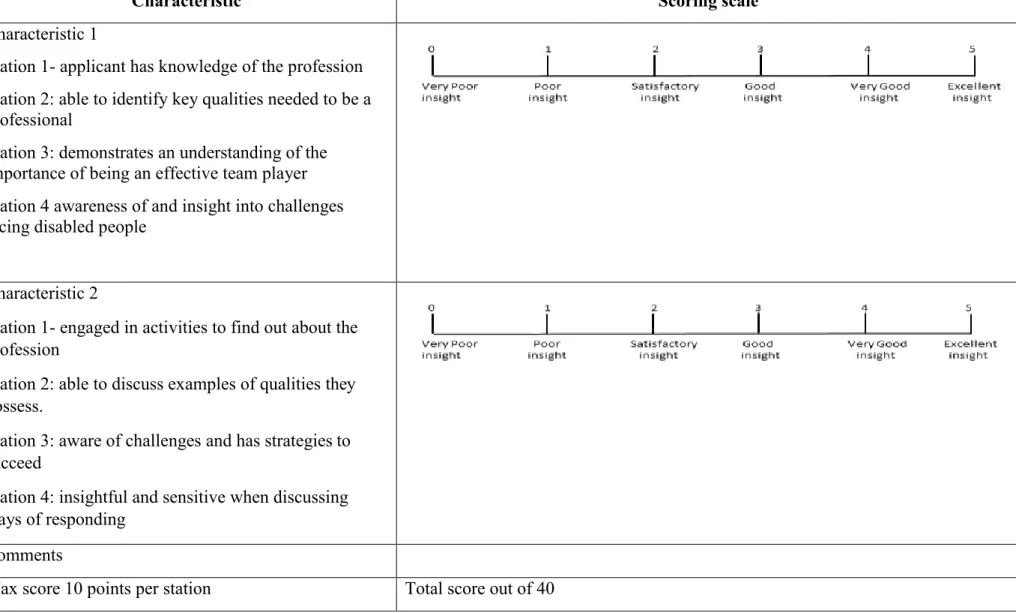
All interviewers attended a training workshop to become familiarised with the stations, interview questions and scoring criteria. Each student was given a thinking time of 1 minute before each station and five minutes with the assessor, as they rotated through the four stations. Each student was marked individually on a five-point rating scale that marked two characteristics, relating to the MMI station area, to provide a total score of 10 for each station (Appendix A). A pre-determined criteria was developed for each station to ensure
consistency in scoring by assessors. Selection was based on the total score obtained by adding the scores at each of the four stations (out of 40). All three professions had the same MMI stations, there were no changes to curriculum during this time.
Predictor Variables
The predictor variables were admission scores and student age. Demographic data included as predictor variable was age on entry. Admission scores were MMI scores and Entry Tariff (ET). Tariff scores were calculated based on the tariff set by the Universities and Colleges Admissions Service (UCAS).
Outcome variables for all three programmes included academic achievement noted as an aggregate percentage of module marks in year one for 2015-16 cohort and year one and two aggregate marks for 2014-15 cohort students. Academic achievement was based on a wide range of assessments within various modules, such as vivas, exams, posters and course work. Therefore, a final aggregate mark attained at the end of the academic year was used as an outcome variable.
Clinical placement performance is assessed on a Pass/Fail basis (no numerical mark).For OT and PT students (2015-16 cohort) it consisted of one placement; for OT and PT (2014-15 cohort) it consisted of three placements (one in year one, two in year two). SLT students had one placement each year.
Data Analysis
Data analyses was conducted using IBM SPSS version 23.0 for Windows (SPSS, Inc., Chicago, IL, USA). Histograms confirmed data were linear and normally distributed. Descriptive statistics using mean, standard deviation (SD) and range was applied to demographic data, admission scores and academic data, including MMI, ET, age and year averages (Table 2). Multiple linear regression modelling, using the standard method, was applied to predictor variables of MMI scores, age and ET for the outcome variable of
academic achievement in both years for all three professions. Standardised coefficients (Beta) were recorded for each predictor variable as well as corresponding p-values. The adjusted R square was recorded as the percentage of variance accounted for each model. Values were considered statistically significant when p was <0.05. Information from Pearson’s
correlations between predictor and outcome variables was also considered across cohorts and professions.
Since placements were assessed on a pass or fail basis which was categorical data, a logistic regression analysis was conducted to predict placement performance using MMI, ET and age as predictors.
Results
Descriptive analysis
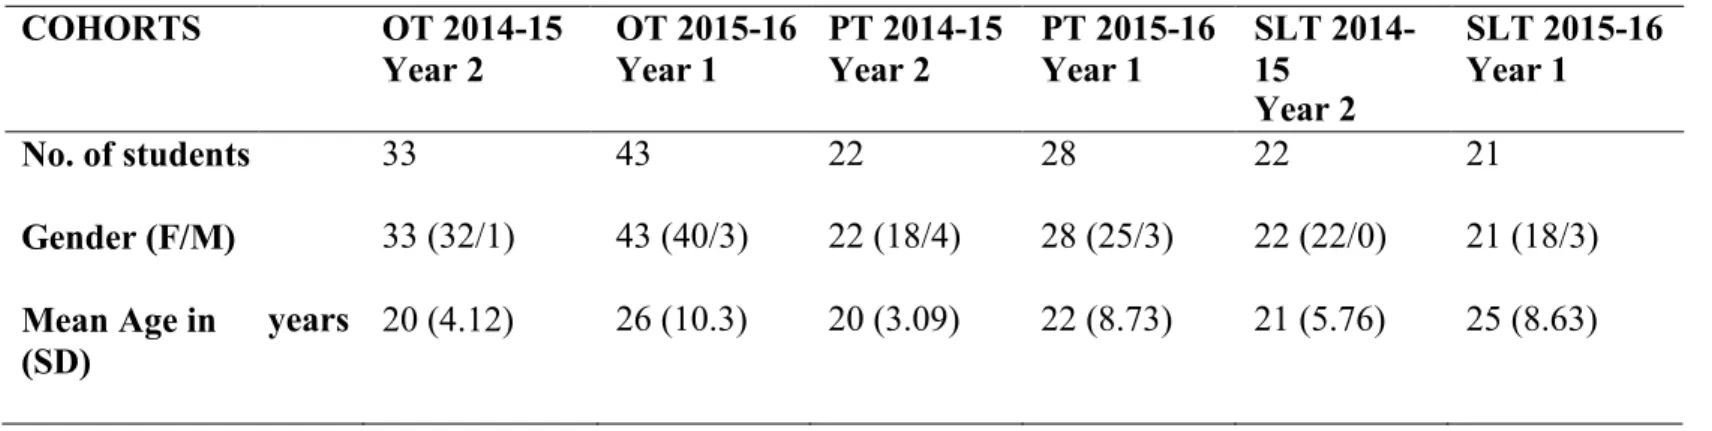
Each profession had two cohorts, with the 2014-15 cohorts having completed two years of study. Average age across the three professions combined was 23 years (range 20-26 years) (Table 1). In all three cohorts there was a dominance of females (92%, n=155) over males (8%, n=14) therefore gender was not considered in the analysis.
(Table 1 here)
Academic achievement and cohorts
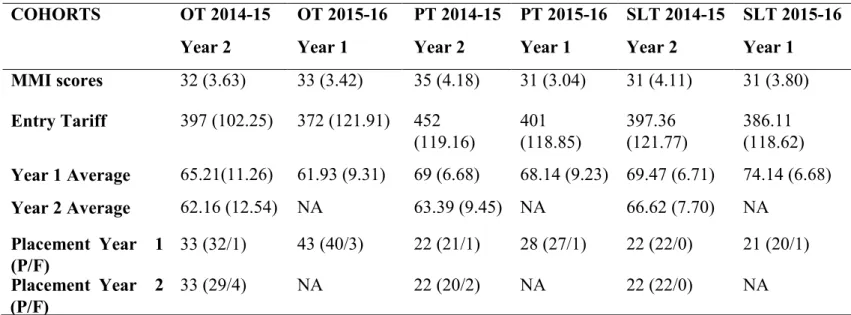
Mean MMI scores for the three professions and both year groups combined, ranged from 31- 33 and ET ranged from 372- 452. End of year academic average for assessments was 61%- 74% for Year one and 62%-66% for Year two (Table 2).
(Table 2 here)
Results from the standard multiple regression indicated that overall, MMI was not a significant predictor of academic achievement in Year one and Year two for all three professions. However, ET was found to be a significant predictor of year one (β=0.37, p<0.05) and year two (β= 0.39, p<0.05) academic achievement for SLT 2014-15 cohort. Age was found to be a significant factor in predicting academic achievement for OT 2014- 15(β= -0.16, p<0.005) SLT 2015-16 cohort (β= -0.05, p<0.05) demonstrating a negative
correlation; it was found to be a significant predictor of academic achievement for PT 2014- 15 (β= 0.13, p<0.05) and SLT 2014-15(β= 0.08, p<0.05) (Table 4).
Pearson’s correlations indicated that age and ET were frequently and significantly correlated with academic achievement for all cohorts. Academic achievement showed a statistically significant and moderate to strong relationship with age (r ranging from 0.37 to 0.61) and weak to moderate relationship with ET (r ranging from 0.25 to 0.44) (Table 3).
However, MMI showed a significant correlation with academic achievement in Year one, r (33) = 0.46, p < 0.005, and Year two, r (33) = 0.48, p < 0.005, for OT 2014-15 cohort only (Table 3).
(Table 3 and Table 4 here)
Clinical placement performance and cohorts
Binary logistic regression was conducted to predict placement performance using MMI, age and ET as predictors. For SLT 2014-15 cohort logistic regression couldn’t be performed as all students had passed (100% pass) and hence there was no variation in the data. MMI and ET did not make a significant contribution to prediction of placement performance for any cohorts. Age was found to be a significant predictor of placement performance in year two for OT 2014-15 cohort (Wald=4.18, p<0.05) (Table 5).
However, data showed a high accuracy of prediction of the model for passing a placement for the remaining cohorts. Pass prediction was 97% for OT 2014-15 for placement one and 88% for placement two. Similarly, pass prediction for PT 2014-15 was 100% for placement one and 96% for placement two. For OT 2015-16 and SLT 2015-16 the predicted pass percentage was 95% and 96% for PT 2015-16 cohort. Since the sample size is small and variability in data is low, it is not possible to draw meaningful conclusions from this analysis.
(Table 5 here) Discussion
This is probably the first known published study determining the predictive value of MMIs for entry into three multiprofessional therapy programmes in a UK university.
MMI and academic performance
Our results showed that MMI scores were not a significant predictor of academic
performance in year one and year two for all three therapy professions except for OT 2014-15 cohort where it was found to be a significant predictor. Our results did not show significant results for all cohorts. This resonates with the results of Gale et al (2016) study which reported MMIs to be a weak predictive factor of academic success in a cohort of nursing students. Traynor et al (2016) used overall module scores during the first year of a nursing course but found no correlation between MMI scores and module results. MMIs were found to be a consistent predictor of success on medical programmes (Lee et al. 2016, Eva et al. 2009; Husbands and Dowell 2013). This may be because medical school MMIs have more stations (8-10 commonly) and longer station duration. This was supported by Lemay et al (2007) who found nine MMI stations were reliable and valid for assessing non-cognitive attributes. This was also recognised in a recent study (Callwood et al. 2018) on predictive validity of MMIs using seven stations. They found MMIs to be a valid measure of predicting end of year one practice outcomes of undergraduate nursing, midwifery and paramedic students, and a valid measure of future performance. Our study had only four stations of five- minute duration, which could influence the results. Further research is necessary with a larger sample size before drawing definitive conclusions. A repeat study with an increased number
of MMI stations to estimate the true effect of the MMI on academic and clinical performance is recommended.
Although retention and student success is a major quality factor in universities, it is likely that there are other factors that can lead to academic success such as previous academic
attainment and relevant experience. This requires further exploration.
ET based on grades achieved at A level was found to be a significant predictor of academic achievement in our study. ET showed significant correlation with academic achievements for all three professions for PT 2014-15 cohort, OT 2014-15 cohort and SLT 2014-15, 2015-16 cohorts. Regression analysis showed ET to be a significant predictor of academic
achievement in year one and year two for SLT 2014-15 cohort. Other studies (Sladek et al. 2016; Mercer and Puddey 2011; Siu and Reiter 2009) examining predictive validity of academic performance, found Grade Point Average (GPA) to be an important predictor across the curriculum. Level of knowledge indicated by previous grades can be an important predictor of success in undergraduate health programmes of health sciences, pharmacy and nursing in New Zealand as demonstrated by Shuruluf et al (2012). Various factors arguably play a role in academic achievement such as motivation, engagement, teaching and learning styles and personal factors, however prior academic background helps with easier
assimilation of knowledge and subject understanding.
Academic performance is one component that can help with selection of applicants that are likely to succeed on a programme. Assessing non-cognitive skills such as professional attributes, personal qualities and understanding of the issues surrounding disability are
deemed equally important in the selection to our therapy programmes. The predictive validity of MMIs in determining non-academic attributes and subsequent success on therapy
Age and academic performance:
Age was seen to be a significant factor in predicting academic success in one cohort for PT, OT and SLT. Negative correlation was observed between age and academic achievement for two out of six cohorts: year two OT (2014-15) and year one SLT (2015-16). A study carried out by Edgar et al. (2014) on first year physiotherapy students found mature age applicants performed better than school leavers in the first year but this trend was reversed later in the course with school leavers showing improved performance compared to mature age students in the third-year units. Different factors contribute to the academic achievement in school leavers and mature students. Mature students are likely to come with more life experience enabling them to use communication skills, assertiveness and team working which may be recognised favourably in clinical placement assessments. However, it was not possible to identify any particular trend from our data.
MMI and clinical placement performance:
Neither MMI nor entry tariff was found to be a predictor of clinical placement performance. We observed one exception for OT 2014-15 cohort where age was found to be predictor of placement two performance. The sample size for each cohort was small and there was less variation in the data. We decided to do a profession-based analysis as each profession has unique modules and placements during each level of study. A very small proportion of students failed placements at first attempt. It is difficult to attribute this to MMI scores or ET due to small sample sizes and less variability in data.
Limitations of the study
During the data collection phase, the 2014-15 cohort had completed two years of study and the 2015-16 cohort completed only one year of study. The period for data collection did not
allow year three data to be collected as changes to the running of the MMIs prevented comparison. A future study with cohorts to completion is recommended.
The literature suggests that station design and having a greater number of stations is
important in ensuring reliability and validity. In the future, consideration should be given to using more than four stations. Repeating this study on larger cohorts will provide more robust results. This study does not consider personal factors such as student’s extenuating
circumstances that may have existed during the study and may have had an impact on academic outcome or placement achievement.
Conclusion
ET and age were shown to have a correlation with academic achievement. This study did not show MMI to be a predictor of academic achievement or clinical placement performance, which could be due to the smaller sample sizes of cohorts and only having four MMI stations. Available research evidence in medicine and nursing suggests that MMIs are more efficient and reliable than traditional interviews. This study needs to be repeated on larger cohorts for more conclusive results and include year three so completion results are included.
This evaluation has highlighted areas that can be developed further to strengthen the current MMI process. The number of stations could be increased, determined by the number of additional specific attributes valued; length of time at each station could be also be increased. This however will result in more time required for the selection process. Future studies should be directed at assessing the reliability of the stations and carrying out predictive validity with larger cohorts.
Ethical Approval: Permission to conduct this evaluation study was granted by the School of XX [name to be supplied later], Research Ethics Committee on 11 March 2016.
Funding: This research did not receive any specific grant from funding agencies in the public,
commercial, or not-for-profit sectors.
Conflict of Interest: None
Acknowledgements
Thank you to XX from the Local Support Team (XX) for assistance with collating and anonymising the data, XX (Admissions Officer) for help with the admissions data, XX from the Business Intelligence Unit for extracting the data from various sources and pooling it in Tableau. We would also like to thank XX (Head of Admissions) and XX (Learning and Teaching Manager) for their cooperation and support.
References
Alaki SM, Yamany IA, Shinawi LA, Hassan MH, Tekian A. 2016. Can Multiple Mini- Interviews Predict Academic Performance of Dental Students? A Two-Year Follow-Up. J Dent Educ. 80(11):1376-1383
Callwood A, Cooke D, Allan H. 2014. Developing and piloting the multiple mini-interview in pre-registration student midwife selection in a UK setting. Nurse Educ Today. 34(12): 1450-54.
Callwood A, Cooke D, Bolger S. Lemanska A, Allan H.2018. The reliability and validity of multiple mini interviews (MMIs) in values based recruitment to nursing, midwifery and paramedic practice programmes: Findings from an evaluation study. Int J of Nurs Stud. 77:138-44.
Cameron AJ, MacKeigan LD, Mitsakakis N, Pugsley JA.2017.Multiple mini interview validity for performance on a pharmacy licensing examination. Med Educ.51(4):379-389 Edgar S, Mercer A, Hamer P.2014. Admission interview scores are associated with clinical performance in an undergraduate physiotherapy course: an observational study.
Physiotherapy. 100:331-35.
Eva KW, Reiter HI, Trinh K, Wasi P, Rosenfeld J, Norman JR. 2009. Predictive validity of the multiple mini-interview for selecting medical trainees. 43:767-75.
Eva KW, Rosenfeld J, Reiter HI, Norman GR.2014. An admissions OSCE: the multiple mini interview. Med Educ. 38: 314-26.
Gale J, Ooms A, Grant R, Paget K, Marks-Maran D. 2016. Student nurse selection and predictability of academic success: the Multiple Mini Interview project. Nurse Educ Today. 40:123-7.
Grice KO.2014. Use of Multiple Mini-Interviews for Occupational Therapy Admissions. J Allied Health. 43(1):57–1.
Griffin B, Wilson I. 2012. Associations between the big five personality factors and multiple mini-interviews. Adv Health Sci Educ Theory Pract. 17(3): 377-88.
HCPC (Health and Care Professions Council), UK. 2018.Standards of education and training [Internet].[cited 12 August 2019.] Available from https://www.hcpc-
uk.org/standards/standards-relevant-to-education-and-training/set/
HEE (Health Education England), UK. 2016 Values based recruitment framework [Internet]. [cited 12 December 2018.] Available from
https://www.hee.nhs.uk/sites/default/files/documents/VBR_Framework%20March%202016. pdf
HEE (Health Education England,NHS), UK.The NHS constitutional values hub [Internet].[cited 12 August 2019.] Available from https://www.hee.nhs.uk/about/our- values/nhs-constitutional-values-hub-0
Husbands A, Dowell J.2013. Predictive validity of the Dundee multiple mini interview. Med Educ. 47(7):717-25.
Knorr M. and Hissbach J.2014. Multiple mini-interviews: same concept, different approaches. Med Educ. 48(12): 1157-75.
Lee JH, Park SB, Park SC, Park ES, Ryu SW, Yang JH, Na SH, Won JY, Chae GB.2016. Multiple mini-interviews as a predictor of academic achievements during the first 2 years of medical school. BMC Res Notes. 9:93.
Lemay JF, Lockyer J, Collin V, Brownell K.2007. Assessment of non-cognitive traits through the admissions multiple mini-interview. Med Educ. 4:573-9.
Mercer A. Puddey IB.2011. Admission selection criteria as predictors ofoutcomes in an undergraduate medical course: A prospective study. Med Teach.33: 997-04.
O'Brien A, Harvey J, Shannon M, Lewic K, Valencia O.2011. A comparison of multiple mini-interviews and structured interviews in a UK setting. Med Teach.33(5): 397-02.
Pau A, Jeevaratnam K, Chen YS, Fall AA, Khoo C, Nadarajah VD.2013. The Multiple Mini- Interview (MMI) for student selection in health profession training – A systematic review. Med Teach. 35:1027-41.
Perkins A, Burton, Dray B,Elcock K.2013.Evaluation of a multiple-mini-interview protocol used as a selection tool for entry to an undergraduate nursing programme. Nurse Educ Today. 33(5): 465-9.
Power A, Clews C.2015. Values-based recruitment and the NHS Constitution: Making sure student midwives meet the brief. Br J Midwifery. 23(11): 818-20.
Razack S, Faremo S, Drolet F, Snell L, Wiseman J, Pickering J.2009. Multiple mini- interviews versus traditional interviews: stakeholder acceptability comparison. Med Educ. 43:993–00.
Rees E, Hawarden A, Dent G, Hays R., Bates J, Hassell A.2016. Evidence regarding the utility of multiple mini-interview (MMI) for selection to undergraduate health programs: A BEME systematic review. BEME Guide No. 37. Med Teach.38(5): 443-55.
Shuruluf B, Li M, McKimm J, Smith M. 2012. Breadth of knowledge vs. grades: What best predicts achievement in the first year of health sciences programmes? J Educ Eval Health Prof. 9: 7.
Siu E, Reiter H. 2009. Overview: what’s worked and what hasn’t as a guide towards predictive admissions tool development. Adv Health Sci Educ Theory Pract. 4:75-755. Sladek R, Bond M, Frost L, Prior R.2016. Predicting success in medical school: a
longitudinal study of common Australian student selection tools. BMC Med Educ.16:187. Thomas A, Young ME, Mazer BL,Lubarsky SE,Razack SI.2017. Reliability and validity of the multiple mini interview (MMI) for admissions to an occupational therapy professional program. British J. Occupational Therapy.80(9) : 558-67.
Traynor M, Galanouli D, Roberts M, Leonard L, Gale T.2016. Identifying applicants suitable to a career in nursing: a value-based approach to undergraduate selection. J Adv Nurs.73 (6): 1443-54.
UCAS: Universities and College Admissions Service UCAS tariff points [Internet]. 2019. United Kingdom; [cited 2019 Aug 12].Available from https://www.ucas.com/.
Table Click here to access/download;Table;Appendix A MMI description.docx
Appendix A: Sample of the MMI rating scale
Characteristic Scoring scale
Characteristic 1
Station 1- applicant has knowledge of the profession Station 2: able to identify key qualities needed to be a professional
Station 3: demonstrates an understanding of the importance of being an effective team player Station 4 awareness of and insight into challenges facing disabled people
Characteristic 2
Station 1- engaged in activities to find out about the profession
Station 2: able to discuss examples of qualities they possess.
Station 3: aware of challenges and has strategies to succeed
Station 4: insightful and sensitive when discussing ways of responding
Comments
Sample questions used in the MMI Station 1:
Knowledge of the profession Tell me what you know about the profession. What activities have you participated in to find out about the profession? (e.g. visits,
shadowing, open days, taster events, college website, personal experience, books or articles) What areas do these professionals work in?
Station 2: Professional suitability for the profession
What qualities are needed when working with clients or families? (e.g., good communication and listening skills, empathy, compassion, rapport, honesty, being patient and respectful). Can you describe a situation when you used any of the qualities you just mentioned? What does it mean to be a health professional?
Station 3:
Personal suitability for the course
Are you an effective team player? Why is this important. (e.g., cooperation, leadership, assertion, ability to listen, effective communication, negotiation skills)
Where might you be challenged on the course in terms of placements, studies or assessments, and what strategies would you use to succeed? (Challenges: e.g. group work, placements etc. Strategies: e.g., time management, prioritise workload, study plan, and seek peer-staff support etc)
Station 4:
Awareness of and insight into disability After they watch the video clip What does this story tell us about the challenges faced by disabled people? How should we respond to their needs?
Table 1 and 2 Click here to access/download;Table;Demographics Table 1 and 2.docx
Table 1: Demographic characteristics of Physiotherapy, Occupational therapy and Speech and Language therapy students in 2014/15 and 2015/16 COHORTS OT 2014-15 Year 2 OT 2015-16 Year 1 PT 2014-15 Year 2 PT 2015-16 Year 1 SLT 2014- 15 Year 2 SLT 2015-16 Year 1 No. of students 33 43 22 28 22 21 Gender (F/M) 33 (32/1) 43 (40/3) 22 (18/4) 28 (25/3) 22 (22/0) 21 (18/3) Mean Age in (SD) years 20 (4.12) 26 (10.3) 20 (3.09) 22 (8.73) 21 (5.76) 25 (8.63)
Table 2: Mean (SD) for MMI scores, Entry tariff, Year 1 and Year 2 average; Pass/Fail for Placement 1 and Placement 2 performances for PT, OT and SLT for year 1 and year 2.
COHORTS OT 2014-15 Year 2 OT 2015-16 Year 1 PT 2014-15 Year 2 PT 2015-16 Year 1 SLT 2014-15 Year 2 SLT 2015-16 Year 1 MMI scores 32 (3.63) 33 (3.42) 35 (4.18) 31 (3.04) 31 (4.11) 31 (3.80) Entry Tariff 397 (102.25) 372 (121.91) 452 401 397.36 386.11 (119.16) (118.85) (121.77) (118.62) Year 1 Average 65.21(11.26) 61.93 (9.31) 69 (6.68) 68.14 (9.23) 69.47 (6.71) 74.14 (6.68) Year 2 Average 62.16 (12.54) NA 63.39 (9.45) NA 66.62 (7.70) NA Placement Year 1 33 (32/1) 43 (40/3) 22 (21/1) 28 (27/1) 22 (22/0) 21 (20/1) (P/F) Placement Year 2 33 (29/4) NA 22 (20/2) NA 22 (22/0) NA (P/F)
Table 3
Table 3: Correlation of admission criteria and academic achievement in year 1 and 2 for OT, PT and SLT cohorts
Academic achievement MMI r Sig Entry Tariff r Sig Age r Sig OT 2014-15 Year 1 0.457 0.004* -0.011 0.476 -0.119 0.254 average (n=33) PT 2014-15 Year 1 average (n=22) SLT 2014-15 Year 1 average (n= 22) OT 2014-15 Year 2 average (n=33) PT 2014-15 Year 2 average (n=22) SLT 2014-15 Year 2 average (n=22) OT 2015-16 Year 1 average (n=43) PT 2015-16 Year 1 average (n=28) SLT 2015-16 Year 1 average (n=21) 0.230 0.152 -0.355 0.053* 0.609 0.001* 0.065 0.387 0.150 0.253 0.315 0.077 0.475 0.003* 0.249 0.082* -0.587 0.001* 0.024 0.457 -0.255 0.126 0.367 0.046* 0.098 0.332 0.438 0.021* -0.002 0.496 0.108 0.246 0.038 0.405 -0.005 0.487 0.053 0.395 0.172 0.191 0.001 0.498 -0.163 0.241 0.352 0.059* -0.555 0.004*
Table 4
Table 4: Multiple regression statistics: Cohorts and Academic year averages
Cohort Year Model statistics Independent variables
R2 Year1 OT 2014-15 OT 2014-15 OT 2015-16 PT 2014-15 average 0.220 Year2 average 0.418 Year1 average 0.014 Year1 average 0.391
F p Predictor Beta Standardised B P
2.720 0.063 Age 0.07 0.024 0.906 Entry Tariff -0.069 -0.106 0.676 MMI score -0.033 -0.048 0.832 6.938 0.001* Age -0.158 -0.503 0.007* Entry Tariff -0.091 -0.059 0.721 MMI score 0.400 0.289 0.071 0.190 0.903 Age 0.005 0.049 0.808 Entry Tariff 0.064 0.066 0.743 MMI score 0.125 0.113 0.487 3.847 0.027 Age 0.126 0.554 0.017* Entry Tariff -0.043 -0.335 0.741 MMI score 0.08 0.123 0.520
PT 2014-15 Year2 average 0.145 1.019 0.407 Age 0.079 1.298 0.211 Entry Tariff -0.069 -0.106 0.676
Year1 MMI score -0.033 -0.048 0.832
PT 2015-16 average 0.047 0.394 0.758 Age Entry Tariff 0.018 0.275 0.160 0.263 0.526 0.302 MMI Score 0.038 0.031 0.880 SLT 2014-15 Year1 average 0.278 2.314 0.110 Age 0.081 0.661 0.022* Entry Tariff 0.365 2.106 0.049*
SLT 2014-15 Year2 MMI Score -0.094 -0.142 0.520
average 0.284 2.382 0.103 Age 0.040 0.379 0.166
Entry Tariff 0.391 0.655 0.017*
SLT 2015-16 Year1 MMI Score -0.013 -0.103 0.919
average 0.314 2.599 0.086 Age -0.050 -0.612 0.044*
Entry Tariff -0.028 -0.040 0.896
MMI Score 0.050 0.070 0.769
Table 5
Table 5: Logistic regression of Cohorts and placement performance Cohort Placement performance OT 2014-15 Year 1 plmt Age B 1.765 S.E. 2.194 Wald 0.647 p 0.421 Entry Tariff -4.024 5.880 0.468 0.494 MMI score 23.181 30.705 0.570 0.450 OT 2014-15 Year 2 plmt Age -0.469 0.230 4.182 0.041* Entry Tariff -0.937 0.858 1.192 0.275 MMI score -0.227 0.797 0.081 0.776 OT 2015-16 Year 1 plmt Age -0.095 0.077 1.546 0.214 Entry Tariff -0.298 0.934 0.102 0.750 MMI score 2.680 1.702 2.479 0.115 PT 2014-15 Year 1 plmt Age -7.951 1666.48 0.00 0.996 Entry Tariff -32.422 5532.415 0.00 0.995 MMI score 32.292 5451.651 0.00 0.995
PT 2014-15 Year 2 plmt Age 0.446 1.827 0.060 0.807 Entry Tariff -1.927 1.348 2.044 0.153 MMI score 1.921 1.424 1.819 0.177 PT 2015-16 Year 1 plmt Age 0.008 0.209 0.001 0.971 Entry Tariff -0.543 1.549 0.123 0.726 MMI score 1.094 1.654 0.437 0.508 SLT 2015-16 Year 1 plmt Age -1.164 799.699 0.00 0.999 Entry Tariff 9.187 10675.640 0.00 0.999 MMI score 18.202 6884.924 0.00 0.998