UNIVERSIDADE NOVA DE LISBOA
FACULDADE DE CIÊNCIAS E TECNOLOGIA
D
EPARTAMENTO DE
E
NGENHARIA
E
LECTROTÉCNICA E DE
C
OMPUTADORES
T
UPLE
-
BASED
M
ORPHISMS FOR
I
NTEROPERABILITY
E
STABLISHMENT OF
F
INANCIAL
I
NFORMATION
M
ODELS
POR:
M
IGUEL
A
LEXANDRE
S
OUSA
F
ERRO DE
B
EÇA
D
ISSERTAÇÃO APRESENTADA NAF
ACULDADE DEC
IÊNCIAS ET
ECNOLOGIA DAU
NIVERSIDADEN
OVA DEL
ISBOA PARA OBTENÇÃO DO GRAU DE MESTRE EME
NGENHARIAE
LECTOTÉCNICA EC
OMPUTADORESO
RIENTADOR
:
P
ROF
.
D
OUTOR
R
ICARDO
J
ARDIM
G
ONÇALVES
C
O
-O
RIENTADOR
:
M
ESTRE
C
ARLOS
A
GOSTINHO
J
URI
:
P
ROF.
D
OUTORJ
OSÉB
ARATAP
ROF.
D
OUTORA
NTÓNIOG
RILOP
ROF.
D
OUTORR
ICARDOJ
ARDIMG
ONÇALVESM
ESTREC
ARLOSA
GOSTINHOi
UNIVERSIDADE NOVA DE LISBOA
FACULDADE DE CIÊNCIAS E TECNOLOGIA
D
EPARTAMENTO DE
E
NGENHARIA
E
LECTROTÉCNICA E DE
C
OMPUTADORES
T
UPLE
-
BASED
M
ORPHISMS FOR
I
NTEROPERABILITY
E
STABLISHMENT OF
F
INANCIAL
I
NFORMATION
M
ODELS
POR:
M
IGUEL
A
LEXANDRE
S
OUSA
F
ERRO DE
B
EÇA
D
ISSERTAÇÃO APRESENTADA NAF
ACULDADE DEC
IÊNCIAS ET
ECNOLOGIA DAU
NIVERSIDADEN
OVA DEL
ISBOA PARA OBTENÇÃO DO GRAU DE MESTRE EME
NGENHARIAE
LECTOTÉCNICA EC
OMPUTADORESO
RIENTADOR
:
P
ROF
.
D
OUTOR
R
ICARDO
J
ARDIM
G
ONÇALVES
C
O
-O
RIENTADOR
:
M
ESTRE
C
ARLOS
A
GOSTINHO
J
URI
:
P
ROF.
D
OUTORJ
OSÉB
ARATAP
ROF.
D
OUTORA
NTÓNIOG
RILOP
ROF.
D
OUTORR
ICARDOJ
ARDIMG
ONÇALVESM
ESTREC
ARLOSA
GOSTINHOiii
AFACULDADE DE CIENCIAS E TECNOLOGIA E A UNIVERSIDADE NOVA DE LISBOA TÉM O DIREITO, PERPÉTUO E SEM LIMITES GEOGRÁFICOS, DE ARQUIVAR E PUBLICAR ESTA DISSERTAÇÃO ATRAVÉS DE EXEMPLARES IMPRESSOS REPRODUZIDOS EM PAPEL OU DE FORMA DIGITAL, OU POR QUALQUER OUTRO MEIO CONHECIDO OU QUE VENHA A SER INVENTADO, E DE A DIVULGAR ATRAVES DE REPOSITÔRIOS CIENTIFICOS E DE ADMITIR A SUA CÔPIA E DISTRIBUIÇAO COM OBJECTIVOS EDUCACIONAIS OU DE INVESTIGACAO, NÃO COMERCIAIS, DESDE QUE SEJA DADO CRÉDITO AO AUTOR E EDITOR.
v
ACKNOWLEDGEMENTS
I would like to express my appreciation to all those who, in some way or another, were involved in the making of this dissertation.
First, I would like to thank Prof. Dr. Ricardo Gonçalves for his assistance as dissertation advisor, as well as, for the encouragement and support which he provided through this journey.
Secondly, I would like to thank my colleagues at GRIS for their support. A special word of thanks to João Sarraipa for his close contributions and encouragement, and also, to Carlos Agostinho for his technical expertise and advice. Finally, I am also grateful to Pedro Maló for his support and for allowing me to coordinate my work at GRIS along with my dissertation.
Last, but not least, I would like to thank my family for all their support and encouragement throughout these long years at school.
vii
A
BSTRACT
The current financial crisis has demonstrated that there is a need for financial accounting data in a format which can be rapidly analyzed and exchanged. The appearance of XBRL in 2000 has helped create a ‘de facto’ standard data format for the exchange of financial information. However, XBRL by itself is not capable of ensuring a common semantic for the exchange of accounting information. Additionally, the existence of different accounting standards in different countries is a hindrance to efficient analysis and evaluation of companies by international analysts or investors. Therefore, there is a need to not only use a more advanced data format, but also for tools which can facilitate the exchange of accounting data, in particular when different accounting standards are used. This dissertation presents a tuple-based semantic and structural mapping for interoperability establishment of financial information models based on the use of ontologies and a ‘Communication Mediator’. It allows the mapping of accounting concepts of different accounting standards to be stored in the ‘Communication Mediator’. The mapping stored contains an ATL code expression, which with the aid of model transformation tools, can be utilized to perform the mapping between two different accounting models.
ix
RESUMO
A presente crise financeira demonstrou que existe a necessidade de haver informação contabilística e financeira num formato em que possa ser rápidamente analisada e partilhada. O surgimento do XBRL em 2000 ajudou a criar uma norma de dados ‘de facto’ para a partilha de informação financeira. Contudo, o XBRL por si só não é capaz de assegurar uma semântica comum para a partilha de informação contabílistica. Adicionalmente, a existência de diferentes normas de contabilidade em diferentes países é um entrave a uma avaliação e análise de companhias eficiente por parte dos analistas e investidores internacionais. Assim, existe a necessidade não só de um formato de dados mais avançado, mas também de ferramentas que facilitem a partilha de dados contabílisticos, em particular, quando se utilizam diferentes normas de contabilidade. Esta dissertação apresenta uma forma de mapeamento semântico e estructural baseado em tuplos para estabelecer interoperabilidade de modelos de informação financeiros, sendo baseado na utilização de ontologias e de uma ontologia de mediação, a ‘Communication Mediator’. A forma de mapeamento apresentada permite que o mapeamento de conceitos contabilísticos pertencetes a normas contabiliísticas diferentes possa ser armazenados no ‘Communication Mediator’. O mapeamento armazenado contém uma expressão com código ATL, que com a ajuda de ferramentas de transformação de modelos, pode ser utilizada para executar o mapeamento entre dois modelos de informação contabilística diferentes.
xi
C
ONTENTS
1. INTRODUCTION ... 19
1.1. GENERAL INTRODUCTION AND MOTIVATION ...1
1.2. PROBLEM DESCRIPTION AND CONTEXT ...3
1.3. RESEARCH METHOD ...4
1.4. RESEARCH PROBLEM AND QUESTIONS ...6
1.5. HYPOTHESIS ...6
1.6. DISSERTATION OUTLINE ...6
2. OVERVIEW OF FINANCIAL REPORT & XBRL AS A FINANCIAL REPORTING STANDARD ...7
2.1. OVERVIEW OF FINANCIAL REPORTING ...7
2.1.1. Introduction to Financial Reporting ...7
2.1.2. How XBRL can assist financial reporting...8
2.1.3. Customizable Data, Continuous Accounting & Auditing ...8
2.2. XBRL AS A FINANCIAL REPORTING DATA STANDARD ... 10
2.2.1. Brief Introduction and historical background ... 10
2.2.2. Technical Specifications of XBRL ... 11
2.2.3. Components of Taxonomy Documents ... 13
2.2.4. Taxonomy Schema ... 13 2.2.5. Taxonomy elements ... 14 2.2.6. Taxonomy Linkbases ... 15 2.2.7. Presentation Linkbase ... 17 2.2.8. Calculation linkbase ... 17 2.2.9. Definition Linkbase ... 19 2.2.10. Reference Linkbase ... 20 2.2.11. Label Linkbase ... 20 2.2.12. Taxonomy extension ... 21 2.2.13. XBRL Instance Document ... 21
2.3. LIMITATIONS OF XBRL AND THE NEED FOR ONTOLOGIES ... 21
3. ONTOLOGIES AND INTEROPERABILITY SEMANTICS ... 25
3.1. SUBJECT-BASED CLASSIFICATION METHODS ... 25
3.2. CONTROLLED VOCABULARIES ... 25
3.3. TAXONOMIES... 25
3.4. THESAURI ... 26
3.5. ONTOLOGIES ... 27
3.6. ONTOLOGY APPLICATIONS ... 27
xii
4. MODEL MORPHISMS (MOMO) ... 29
4.1. SEMANTIC MISMATCHES ... 29
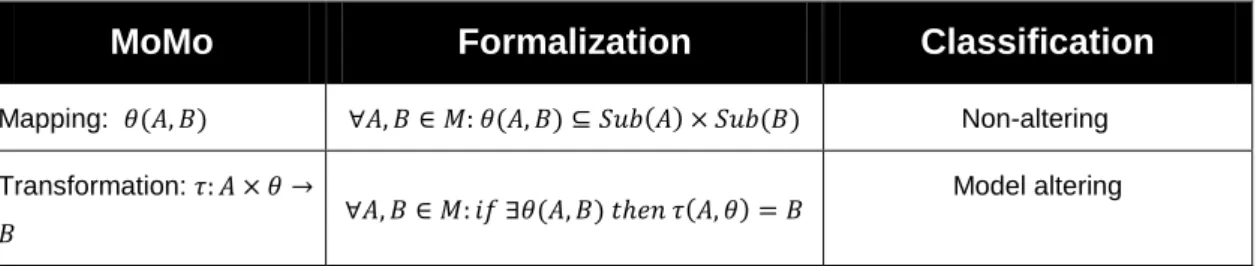
4.2. MOMO FORMALISMS ... 30
4.2.1. Classical Mathematics: Graph & Set Theory ... 31
4.2.2. Mapping as a model: Model Management [36] ... 31
4.2.3. Mapping as a complex tuple: Matching [37] ... 31
4.3. KNOWLEDGE ENRICHED TUPLES FOR MAPPING REPRESENTATIONS ... 32
4.4. COMMUNICATION MEDIATOR ... 33
5. MODEL-DRIVEN ARCHITECTURE ... 35
5.1. META OBJECT FACILITY ... 35
5.2. UNIFIED MODELING LANGUAGE ... 36
5.3. XMLMETADATA INTERCHANGE ... 37
5.4. QUERY/VIEW/TRANSFORMATION ... 37
5.5. ANALYSIS OF MODEL TRANSFORMATION LANGUAGES ... 38
5.5.1. Atlas Transformation Language ... 38
5.5.2. Xtend (openArchitectureWare) ... 39
5.5.3. QVT Implemenations evaluated ... 39
5.6. EVALUATION CRITERIA AND ANALYSIS ... 40
5.6.1. Java Integration ... 40
5.6.2. Documentation, tools and available support ... 40
5.6.3. Language Capabilities ... 41
5.6.4. Simplicity/Complexity ... 41
5.6.5. Standardization ... 42
5.6.6. Language of choice ... 42
6. PROPOSED SOLUTION, IMPLEMENTATION AND TESTING... 45
6.1. PROPOSED SOLUTION ... 45
6.1.1. AS-IS Scenario ... 45
6.1.2. TO-BE Scenario ... 45
6.1.3. Demonstrator Tool ... 46
6.1.3.1. Usage of Ontologies as Data Models ... 46
6.1.3.2. Usage of a Mediator Ontology ... 47
6.1.3.3. Generation of Model Transformation Code in ATL ... 47
6.1.3.4. Usage of SPARQL for Retrieval of data Stored in Mediator Ontology ... 47
6.1.3.5. Integration with Protégé ... 48
6.1.4. Application Scenario ... 48
6.2. PROOF-OF-CONCEPT IMPLEMENTATION ... 50
6.2.1. Implementation Overview and Technology Used ... 50
6.2.1.1. Use-Cases ... 51
xiii
6.2.2.1. Step 1- Creation of Simplified Income Statements in OWL ... 53
6.2.2.2. Step 2- Development of Java Methods for Data Insertion into Mediator Ontology ... 53
6.2.2.3. Step 3 – Development of Java Methods for Querying the Mediator Ontology ... 53
6.2.2.4. Step 4 – Development of ATL Code Generation Methods ... 53
6.2.2.5. Step 5 – Development of Protégé Tab as an Integration Tool and GUI ... 54
6.3. IMPLEMENTATION TESTING AND HYPOTHESIS VALIDATION ... 54
6.3.1. Testing of Java Methods for Data Insertion ... 55
6.3.2. Testing of SPARQL Queries ... 55
6.3.3. Testing of Java Methods For Calling and Running Sparql Queries ... 56
6.3.4. Testing of ATL Code generated by the Application ... 56
6.3.5. Testing of Protégé Tab ... 57
7. CONCLUSIONS AND FUTURE WORK ... 58
7.1. CONCLUSIONS... 58
7.2. FUTURE WORK ... 58
xv
L
IST OF
F
IGURES
Figure 1.1– Ontological Heteregoneity Example [3]... 2
Figure 1.2 – Steps in the Scientific Method ... 4
Figure 2.1 - Business Reporting Supply Chain [7] ... 7
Figure 2.2 - Business Reporting Supply Chain enabled by XBRL [9] ... 9
Figure 2.3 - XBRL Report Components [16] ... 12
Figure 2.4 - The role of linkbases in a XBRL taxonomy [17] ... 16
Figure 2.5 - Calculation linkbase example [17] ... 18
Figure 2.6 - Difference between Presentation and Calculation linkbases [17] ... 18
Figure 2.7 – IFRS to USGAAP REconciliation [22] ... 23
Figure 2.8 – Income Statement items from Daimler [23] (Left) and NISSAN [24] (RIGHT) ... 23
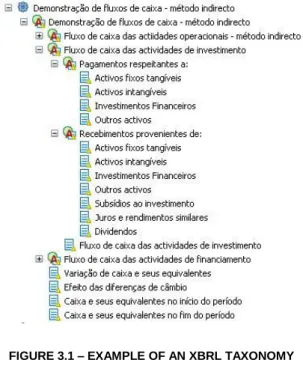
Figure 3.1 – Example of an XBRL Taxonomy ... 26
Figure 4.1 Mismatch examples ... 30
Figure 4.2 - Mapping as a model (map12) ... 31
Figure 4.3 - Structure of knowledge base for communication support (CM) ... 33
Figure 5.1 – MOF Metamodelling hierarchy [4] ... 36
Figure 5.2 – Relationships between QVT metamodels [47] ... 37
Figure 6.1 – Income Statement according to two different accounting Standards (US GAAP & IFRS) ... 49
Figure 6.2 – Example of a 1-to-1 Mapping ... 49
xvii
L
IST OF
T
ABLES
Table 4.1 – Cases of Model Morphisms ... 29
Table 4.2. Semantic Mismatches (based on [31]) ... 30
Table 5.1 - Comparison of Transformation Languages ... 42
xix
S
YMBOLOGY AND
N
OTATIONS
AICPA American Institute of Certified Public Accountants
API Application Programming Interface
ATL Atlas Transformation Language
CPA Certified Public Accountant
CRM Customer Relationship Management
CWM Common Warehouse Metamodel
ERP Enterprise Resource Planning
GUI Graphical User Interface
IASB International Accounting Standards Board
IDE Integrated Development Environment
IFRS International Financial Reporting Standards
M2M Model to Model
MDA Model Driven Architecture
MOF Meta Object Facility
MoMo Model Morphism
oAW openArchitectureWare
xx
OMG Object Management Group
OWL Web Ontology Language
PDF Portable Document Format
PIM Platform-Independent Model
PSM Platform-Specific Model
QVT Query/View/Transformation
RDF Resource Description Framework
RDFS RDF Schema
SEC Securities and Exchange Commision
SPARQL SPARQL Protocol and RDF Query Language
UML Unified Modeling Language
URL Uniform Resource Locator
US GAAP United States Generally Accepted Accounting Principles
W3C World Wide Web Consortium
WWW World Wide Web
XBRL eXtensible Business Reporting Language
XFRML Extensible Financial Reporting Markup Language
xxi
1
1. I
NTRODUCTION
1.1. G
ENERAL INTRODUCTION AND MOTIVATIONThe current financial crisis has its roots on human greed and irresponsibility on the part of many actors. It is not the first time that the world is faced with the dishonest actions of a few which caused an impact in the rest of the world.
The beginning of the current fallout has already been discussed many times over: financial institutions made loans to customers who could not afford to pay them back, and in turn, these financial institutions packaged and sold these loans to other financial institutions as securities. This “scheme” worked as long as real estate prices continued climbing. However, as housing prices fell, so did the value of these securities.
One of the main issues that faced regulators and financial institutions when the current crisis started to unfold was their inability to properly evaluate the market value of these securities. As each packaged security was based on hundreds of individual mortgages, the task of evaluating them was an extremely difficult one, and that is assuming that the financial institutions would be able to correctly identify the “contents” of each one of their securities.
However, this sort of accounting problem is just one side of the issue. One must not also forget the many accounting scandals which took place almost a decade ago. The early 2000’s saw another barrage of financial and accounting scandals. The accounting frauds perpetrated by Enron and MCI are the first that come to mind. However, in 2002 alone, there were more than 20 known accounting scandals [1], ranging from inflated revenues and sales, to overstated assets and understated liabilities.
In response to these, stricter accounting rules and regulations, such as the “Sarbanes-Oxley Act”, were passed into law in the United States. Unfortunately, a few years later, the United States and the rest of the world face an even bigger financial crisis, which has not only proved that the earlier regulatory mechanisms were not enough, but that other methods may have to be used to prevent future financial calamities and restore investor confidence in the financial sector.
In the article “How to Fix Financial Reporting”, Bogoslaw [2] discusses some of the measures that could be implemented in order to help restore confidence in the equity markets. From changes in accounting rules, to increased transparency in the derivatives market, one of the solutions according to this article is the move towards digital financial data [2]:
“Financial reporting also needs to move away from big documents to electronic database formats that relieve analysts of the need to re-enter all the numbers in their own spreadsheets, and would free up analysts and regulators to actually analyze the data, says
2
Philip Moyer, chief executive of EDGAR Online (EDGR), a Web site that publishes corporate filings to the SEC.”
This move towards digital financial data has already started in 2000, with the introduction of eXtensible Business Reporting Language (XBRL), a standard specification which is mainly used to exchange accounting information, such as financial reports and statements.
As it shall be discussed further ahead, XBRL has brought tremendous advantages as it has become the ‘de facto’ standard format for exchanging accounting data. However, some challenges still remain, mainly regarding the semantics of the contents being exchanged. An important distinction must be made between the contents being exchanged and their respective semantics. Just because data can be exchanged between two systems with the same data format it does not necessarily mean that each system will give the same meaning to the data being exchanged. This is referred to as ‘semantic heterogeneity.’
This issue, in the context of exchanging XBRL data, is raised by Madnick and Zhu [3] and they refer to it as “Ontological Heterogeneity”, which is “the case where the elements in different taxonomies that appear to refer to the same concept actually have subtle differences.” The authors show that the concept of ‘Operating Profit’ contained in XBRL taxonomy according to US GAAP, may have some differences from its Chinese equivalent, ‘Ying Ye Li Rum’, as exemplified below:
FIGURE 1.1– ONTOLOGICAL HETEREGONEITY EXAMPLE [3]
This issue arises because of the differences in accounting standards between two countries. Although XBRL may be used to represent a taxonomy according to many different accounting standards, currently there are no tools which allow the correct mapping of accounting data defined according to different standards.
Therefore, the exchange of accounting data still requires a set of tools which will enable the mapping or the transformation of data between different accounting standards.
3
1.2. P
ROBLEM DESCRIPTION AND CONTEXTThis dissertation intends to focus and address the problems related to the interoperability establishment of financial information models. Thus, its focus is to propose a solution that could help on solve interoperability issues related to the exchange of the current existent financial information models. The proposed technical solution is mainly related to business information models (e.g. XBRL) and information semantic solutions (e.g. taxonomies; ontologies; semantic mappings; model morphisms).
The dissertation proposes a solution, which is demonstrated by the development of tools which can assist in the mapping and transformation of data, in particular, accounting data represented according to two different accounting standards. However, such results of the work performed, may be transferred to other domains, such as the exchange of product data.
Ontologies are used to build an information model which allows the exploration of the information space in terms of the items which are represented, the associations between the items, the properties of the items, and the links to documentation which describe and defines. Thus, this dissertation studies ontologies and their capacity to represent different accounting standards, but also as an active mechanism to solve the existent interoperability issues mainly related to semantics. One of its main uses in this dissertation is for the representation of semantic mappings and model morphisms.
Regarding model morphisms, the present dissertation builds upon the “Knowledge Enriched Tuple”, a formalism which has been defined, as a means of representation of semantic mappings. In the context of the solution to be presented, this formalism is used to exemplify how it can be used to store mappings between two different ontologies, in way which can also be utilized by other applications or even model transformation code generation.
Ontology mapping is something that can be achieved already through various existing tools. However, according to [4], the variety of ontology languages, as well as, the diversity of ontology tools presents a serious problem of lack of interoperability. Additionally, [5] states the following: “There are many existing ontology development tools, and they are used by different groups of people for performing diverse tasks. Although each tool provides different functionalities, users tend to use just one tool, as they are not able to exchange their ontologies from one tool to another.”
Therefore, there is a need for some harmonization with regards to ontology mapping, a need which can be fulfilled through the use of Model-Driven Architecture (MDA) paradigms.
In the particular context of ontology mapping, the model transformation languages, such as ATL, provided by the MDA paradigm can serve as tool which can assist in the mapping of concepts between two different information models. The proposed solution aims to provide a bridge between the conceptual representation of the model mappings, as described above, and
4
translate it into model transformation code, which can be utilized to perform the actual transformation with existing instances of those models.
1.3. R
ESEARCHM
ETHODThe present dissertation will use the following scientific research method [6]:
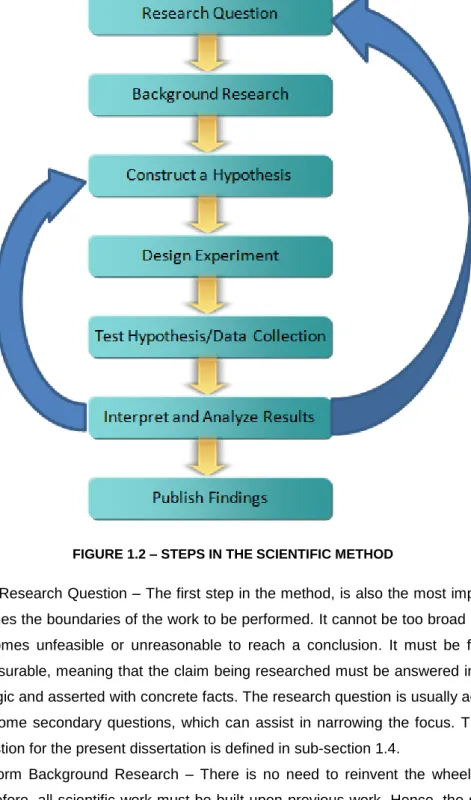
FIGURE 1.2 – STEPS IN THE SCIENTIFIC METHOD
1. Ask Research Question – The first step in the method, is also the most important, as it defines the boundaries of the work to be performed. It cannot be too broad otherwise, it becomes unfeasible or unreasonable to reach a conclusion. It must be focused and measurable, meaning that the claim being researched must be answered in a way that is logic and asserted with concrete facts. The research question is usually accompanied by some secondary questions, which can assist in narrowing the focus. The research question for the present dissertation is defined in sub-section 1.4.
2. Perform Background Research – There is no need to reinvent the wheel in science, therefore, all scientific work must be built upon previous work. Hence, the second step of the scientific method consists of performing background research on the subject under question. This research consists of developing a state-of-the-art on relevant matters which relate to the research question. Once one has a good grasp of what has
5
been accomplished so far in the subject, one is therefore much better able to determine what and how the research work being developed will complement the work done previously, and how it will serve to advance the knowledge in the fields associated with it. The background research consists mostly of literature review of papers, articles, books and other relevant materials which are available on the subject under question. The background research is detailed in sections 2, 3, 4 and 5.
3. Construct a Hypothesis – Once sufficient knowledge on the subject has been obtained it is then possible to formulate a hypothesis, based upon the information collected in step 2. The hypothesis is then a compilation of facts, which serve as the basis for further study. It aims to predict a specific outcome and it must be brief, focused and stated in a declarative form. The purpose of the hypothesis is to give clarity and focus to the research problem. The hypothesis for the present dissertation is defined in sub-section 6.1.3.
4. Design experiment – This step consists in outlining what is necessary to properly evaluate the hypothesis under consideration. Within the realm of computer science, this usually requires the design of a prototype or the development of a system architecture. In order to be valid, the experiment must be measurable, meaning that under this step, it is important to identify which variables will be under evaluation. Finally, the validation of the hypothesis must be planned in such a way which can be easily replicated by others. The theoretical design and the proof-of-concept implementation are described in section 6.2.
5. Test hypothesis / Collect Data: Once the experiment has been designed, it is then necessary to perform the testing of the hypothesis and gather all relevant data. In order to properly test the hypothesis, a battery of tests should be defined and performed. For each test scenario, data should be collected to perform the validation of the hypothesis. The test methodology is discussed in section 6.3.
6. Interpret and analyze the results: Once all the tests have been performed and the associated data has been collected, it is then necessary to interpret the results. It is at this stage where it is possible to evaluate whether the hypothesis under evaluation is valid, or if the test data is unfavorable, if it needs to be refined or completely redefined. In some instances, it may even be necessary to reformulate the research question, and start from the top. If the test results do validate the hypothesis, it is then possible to move on to the next step. The interpretation of analysis of the test results is detailed also in section 6.3.
7. Publish findings: The final step in the scientific method is the publication of the findings which results from the research work developed. The findings publication serves as a contribution to the scientific community and can be used to further advance other relevant research in the subject field. In accordance to the type of research performed, the findings should be published in scientific papers.
6
1.4. R
ESEARCHP
ROBLEM ANDQ
UESTIONSThe research problem and questions to be addressed by the present dissertation are:
Shall it be possible to achieve harmonization of global accounting standards through the interoperability of accounting data, achieved through model transformation and supported by ontologies?
1.5. H
YPOTHESISThe hypothesis to be validated by the dissertation is the following:
XBRL can be the reference standard data format for the exchange of accounting data between global accounting systems.
It is possible to enhance the interoperability between heterogeneous accounting systems through the use of an ontology-based harmonization tool.
1.6. D
ISSERTATIONO
UTLINEThe dissertation begins with an overview of Financial Reporting and XBRL as a Financial Reporting Data Standard. This section provides an introduction to the financial reporting domain, as well as, a detailed description on the inner workings of XBRL. The description of XBRL serves a means of better understanding the capabilities and, more importantly, the limitations of XBRL and, therefore, the need to adopt a different information modeling mechanism The next section, ‘Knowledge Representation & Interoperability Semantics’, discusses the various knowledge representation paradigms available, and how ontologies are the most appropriate mechanism for the representation of financial reporting data. Then, the dissertation describes the major types of Model Morphisms and introduces the “Communication Mediator” ontology, as mechanism to be included in the proposed solution, when integrated in a Model-Driven Architecture, focusing on how Model Transformation Languages can assist in implementing model morphisms.
Section 6 discusses the proposed solution for validating the hypothesis raised, based on the technologies described in the earlier sections, followed by a discussion on the Proof-of-Concept implementation, by elaborating on the actual technology solutions used and respective implementation steps. Finally, it describes the testing procedures which were performed to validate the implementation of the proposed solution.
The final section of the dissertation discusses the conclusions reached and foreseen future work.
7
2. O
VERVIEW OF
F
INANCIAL
R
EPORT
&
XBRL
AS A
F
INANCIAL
R
EPORTING
S
TANDARD
2.1. O
VERVIEW OFF
INANCIALR
EPORTING2.1.1. I
NTRODUCTION TOF
INANCIALR
EPORTINGThe accounting software in use by most large companies today, is extremely sophisticated. Usually, Enterprise Resource Planning (ERP) applications, such as SAP, provide a variety of modules that integrate many types of data, and which also integrate themselves with other company applications, such as Customer Relationship Management (CRM) applications. However, this sophistication has yet to make its transition to other types of accounting information to be used by other parties, in particular, financial accounting reporting data.
FIGURE 2.1 - BUSINESS REPORTING SUPPLY CHAIN [7]
Figure 2.1 exemplifies the business reporting supply chain from a ‘traditional perspective’. The sophistication of IT accounting systems has for many years been limited to the internal processes of the reporting supply chain. Within company walls, accounting data flows in digital format.
However, when accounting reporting data must be released to external parties, the flow of digital data is stopped. Data from accounting systems must be converted into other formats, traditionally a paper report.
Even with the advent of the Internet, a few more options appeared, as most companies now publish their reports in a digital format, usually in PDF file format, while some even provide accounting data such as, Balance Sheet, Income Statement and Cash-Flow Statement in Excel, thus saving investors and analysts some precious time while doing their own analysis.
8
Besides the potential for errors, there is above all, the time spent unnecessarily, copying data from one type of document to another. David Harper, an investment analyst for Harbinger Research claims that, “crunching numbers and generating graphs occupies at least 50% of my time” when writing a company report. [8]
Additionally, even digital formats, such as PDF and Excel files, do not allow much in terms of customization nor do they provide much assistance in terms of their integration with other tools and/or other types of data. The typical “cut & paste” of data is still prevalent when one has to perform financial analysis using these formats.
Also, the information provided is static, not dynamic, meaning that it soon gets outdated, as market conditions change every day. The financial information provided by a public company in December, can be quickly outdated by the end of January.
Finally, one must also take into account that certain companies, such as multinationals, may be subject to multiple accounting standards. For example, a Portuguese company listed on the New York Stock Exchange is required to file financial reports according to IFRS, while it may also be required to provide financial information according to the Portuguese GAAP. In this scenario, although the raw data is the same, it must, however, be presented according to two different standards.
2.1.2. H
OWXBRL
CAN ASSIST FINANCIAL REPORTINGXBRL is a digital data format which aims at solving many of the problems of today’s financial reporting, while adding new opportunities for more advanced tools of financial analysis.
By becoming a data standard, XBRL will enable the appearance of XBRL-enabled tools to analyze XBRL data, thus taking away the need to import data from one digital format to another. As other tools also become XBRL compatible, this will allow for even further integration.
In addition to the above, XBRL is dynamic as data published in XBRL can be generated directly from a company’s internal accounting system. The paradigm of continuous accounting, which shall be discussed below, can become a reality.
Finally, XBRL offers flexibility, as different taxonomies can be used, thus facilitating the generation of financial reports according to various accounting standards.
2.1.3. C
USTOMIZABLED
ATA,
C
ONTINUOUSA
CCOUNTING&
A
UDITINGAs discussed in the previous section, digital data flows freely within a company’s accounting system. At any time, an accountant or any member of the management team can get access to real-time information on a company’s financial situation.
9
Again, as it was already mentioned, today’s financial reporting system does not provide the same sort of ability to those outside the company. At best, analysts and investors are only able to obtain financial reports on a quarterly basis, at best.
The shift to an electronic data format, such as XBRL, could enable a paradigm shift in terms of seamless access to data.
FIGURE 2.2 - BUSINESS REPORTING SUPPLY CHAIN ENABLED BY XBRL [9]
The ‘XBRL-enabled’ reporting supply chain, shown in Figure 2.2, exemplifies what could be the future of accounting reporting.
By utilizing XBRL as the data exchange standard in IT accounting systems, both within the company and outside, here are some of the consequences of this paradigm shift:
1. Customizable accounting data – In utilizing a common standard for accounting data, there would be no more need to convert internal accounting data into external accounting reports. The source of data would be the same, however it would be customizable according to the needs of each participant. For example, analysts would obtain financial reporting data, whilst regulators could have access to more in-depth information financial data.
2. Real-time accounting data could become a reality – With the implementation of an XBRL reporting supply chain, the possibility of real-time accounting data [10] may become a reality. Thus, instead of financial reporting data only being available on a quarterly basis, such as, the typical quarterly report, investors, analysts and regulators could have access to real-time accounting information in the near future. The implications of such a paradigm shift could be tremendous, as companies would be forced to have greater transparency. However, as it was the case with many accounting scandals, there are times when companies may wish to cut back on their information
10
disclosure. But, on the other hand, investors would benefit from this, as greater transparency would enable them to make more sound investment decisions.
3. Continuous auditing – Rezaee, Elam and Sharbatoghlie define continuous auditing as “a process of gathering and evaluating evidence to determine the efficiency and effectiveness of Real-Time Accounting in safeguarding assets, maintaining data integrity, and producing reliable financial information” [10]. If the XBRL enabled business supply chain is to become a reality, the auditing process must also shift from “the manual audit of accounting systems with paper documentation to on-line, continuous electronic audit of EDI, paperless systems.” [10] The implications of this change are tremendous as continuous auditing will allow auditors “to test a larger sample (up to 100 percent) of clients’ transactions and data faster and more efficiently”, as well as, reduce the time and costs required by audits and, it may “also increase the quality of financial audits by allowing auditors to focus more on understanding a client’s business and industry and its internal control structure” [10].
A concrete example of how continuous reporting can assist companies is provided in a study by Searcy, Ward and Woodroof [11]. In their paper, “Continuous reporting benefits in the private debt capital market”, the authors found that “that high risk companies providing financial information to the lender on a daily basis have a higher probability of loan acceptance than do companies providing financial information to the lender on a quarterly basis.” [11] Indeed, this shows how greater transparency can be beneficial to companies by providing greater confidence to third-parties, such as, lenders, regulators and investors.
2.2. XBRL
AS AF
INANCIALR
EPORTINGD
ATAS
TANDARD2.2.1. B
RIEFI
NTRODUCTION AND HISTORICAL BACKGROUNDeXtensible Business Reporting Language (XBRL) is a standard specification, based on XML for the purposes of exchanging accounting information, more specifically, financial reports and statements [12], as well as, other non-financial information. Some examples include the following [13]:
Financial information: Balance Sheets Cash flow Statements Income Statements Non-financial information:
Performance Measurements Regulatory Reporting Forms Loan Applications
11
The beginnings of XBRL can be traced back to April 1998, when Charles Hoffman, a Certified Public Accountant (CPA), started investigating the usage of eXtensible Markup Language (XML) in financial information reporting. Mr. Hoffman started by developing prototypes of financial statements and audit schedules in XML. [14]
In July 1998, Mr. Hoffman contacts the American Institute of Certified Public Accountants (AICPA), in particular, the AICPA’s High Tech Task Force, regarding the potential of XML in financial reporting. [7]
The objective was to engage the AICPA in developing a “standard, XML-based language for digitizing business reports in accordance with the rules of accounting in every country around the world.” [15]
Just two months later, a Product Description is crafted, which proposes the creation of a prototype set of financial statements. After receiving funding, just one month later, the prototype is completed in December 1998. Then, in January 1999, it is presented within the AICPA, which recognizes the value and the importance of the standard to the accounting profession.
In June 1999, a business plan is created for the development of XFRML (Extensible Financial Reporting Markup Language), and in July 1998, the AICPA agrees to provide funding for the new endeavor. Soon after, twelve companies joined in as members of the Steering Committee, including Deloitte & Touche, Ernst & Young, KMPG, PricewaterhouseCoopers and Microsoft, amongst others.
The organization changed its name to XBRL Steering Committee in April 2000, and the first XBRL specification was released in July 2000. XFRML, the code name for the language, would now become XBRL.
Today, the XBRL Consortium has more than 550 members, including companies, governmental entities, universities and other institutions. These members are spread out through several established jurisdictions. Jurisdictions are composed by all the members involved in the development or deployment of XBRL at a national level. There already fifteen countries with established XBRL jurisdictions, while seven more countries have Provisional jurisdictions.
2.2.2. T
ECHNICALS
PECIFICATIONS OFXBRL
1XBRL reports are made with separate entities, each with its specific purposes. As it shall be seen further ahead, it is this separation between components that gives XBRL much of its appeal.
12
FIGURE 2.3 - XBRL REPORT COMPONENTS [16] As figure 2.3 exemplifies, the two main components of an XBRL report are:
1) Taxonomy – In its essence, it provides the structure of the financial report. It includes the definitions of the concepts that are to be included in the report, as well as, the relations between them. However, the taxonomy document does not include any values for any of the concepts [13]. Some examples of some concepts that can be included in a balance sheet report, may include:
Assets
Currents Assets Accounts Payable Equity
2) Instance Document –Basically, an instance document is a collection of facts, which in this case, are the values for the concepts that are defined in the taxonomy. However, the instance document does not include any information regarding the relations between the facts. As mentioned previously, all this is contained in the taxonomy document.
This separation of a business report into two entities is what gives XBRL great flexibility. For example, a company may need only to develop a taxonomy document once, as the definitions will most likely be the same, year after year. Once a taxonomy document is developed, a company filing an XBRL report needs only to create an instance document with the new values. Additionally, this also allows for the creation of national taxonomies, whereby all firms in a country can submit their financial reports according to the standard national taxonomy. However, given the specificities of certain sectors, there are usually several national taxonomies, each specific to a sector, such as banking, industry and others.
13
Finally, the use of standard taxonomies allows for easy comparison of financial reports belonging to different firms.
2.2.3. C
OMPONENTS OFT
AXONOMYD
OCUMENTSA taxonomy derives its name from the Greek, being the junction between the verb tassein (to classify) and nomos (law or science) [17].
Therefore, a taxonomy would mean the law or science of classification, however, it is usually interpreted as being the classification of knowledge in a particular domain.
In the XBRL environment, the taxonomy is the classification of the various accounting terms in a structured way.
XBRL Taxonomies can be decomposed into the following:
1) Taxonomy Schema – It includes the definitions of the elements that are contained in the taxonomy.
2) Taxonomy Linkbases – The Linkbases, on the other hand, include the relationships between the different elements of the taxonomy.
This separation between definitions and Linkbases is traced back to the XML standard, which specifies such separation.
2.2.4. T
AXONOMYS
CHEMAAs mentioned above, the taxonomy schema contains the definitions of all the elements that make up the taxonomy, and their respective attributes such as their identifications, names and other characteristics.
The schemas are created according to the XML Schema format and are usually stored as an .xsd file. In the particular case of XBRL, the schemas are tailored to the specific needs of financial reporting.
The code example below will assist in illustrating the structure of an XBRL taxonomy schema:
<schema xmlns="http://www.w3.org/2001/XMLSchema" xmlns:xbrli="http://www.xbrl.org/2003/instance" xmlns:link="http://www.xbrl.org/2003/linkbase" xmlns:xlink="http://www.w3.org/1999/xlink" xmlns:ifrs-gp="http://xbrl.iasb.org/int/fr/ifrs/gp/2005-05-15" xmlns:ifrs-gp-rol="http://xbrl.iasb.org/int/fr/ifrs/gp/2005-05-15/roles" xmlns:samp="http://www.iqinfo.com/xbrl/taxonomy" targetNamespace="http://www.iqinfo.com/xbrl/taxonomy" elementFormDefault="qualified" attributeFormDefault="unqualified">
14
The schema always begins with the root element, the tag <schema> and always ends with the closing tag </schema> (not shown). Following this, there are several namespaces.
The namespaces help identify where the various elements derive their definitions from. For example, the definition of “Assets” in US GAAP may be slightly different than the one provided by the Australian GAAP. Therefore, the namespaces must be unique and that explains why they are defined with Uniform Resource Identifiers (URI’s), similar to the Uniform Resource Locators (URL’s) that are common for locating web addresses.
As it can be seen from the example above, the namespaces included in an XBRL schema are various, each with its own specific role, as described below:
The ‘xmlns’ namespace is a reference to the XML Schema, since XBRL derives from XML.
The ‘xmlns:xbrli’ namespace contains the elements and attributes that are unique to XBRL. It extends the XML Schema and it is required in all XBRL taxonomies.
The ‘xmlns:link’ namespace is the XBRL implementation of XML linking. It is required in all XBRL taxonomies, as it used to relate the various XBRL elements contained in the taxonomy.
The ‘xmlns:xlink’ namespace refers to the native XML Linking elements and attributes. It is different from the XBRL linking discussed above and it is also required.
The ‘xmlns:ifrs-gp’ namespaces are references other taxonomies. In this example, the taxonomy being described will be defined as an extension to the IFRS taxonomy. The ‘xmlns:samp’ is the namespace for the taxonomy under definition. When one builds
a new taxonomy, one is also building a new schema which must also have a unique reference. This namespace will then be the reference for the new concepts that will be defined in this new taxonomy.
Finally, the ‘targetNamespace’ declares the ‘samp’ namespace defined previously. Both of these must be unique to each taxonomy schema.
2.2.5. T
AXONOMY ELEMENTSIn addition to the root element, the schema contains the definitions of the various elements. Basically, an XBRL element is a business concept, such as “Assets”, “Cash” or “Liabilities”, defined according to a set of rules and having certain characteristics, as illustrated below:
<element name=”Assets” id=”Assets” periodType=”instant” balance=”debit” abstract=”false” substitutionGroup=”item” type=”monetaryItemType”/>
The element definition is composed of several attributes, the most relevant being:
‘element name’ – The name must be unique, as there cannot be two different elements with the same name. Additionally, the name must meet certain requirements, as it
15
cannot have spaces or other reserved XML characters (such as <, > or /). Finally, names are case sensitive in XML, meaning that ‘Assets’ is a different element from ‘assets’.
‘periodType’ – This attribute refers to the “ accounting distinction flows and resources.” (IASB n.d.) Since Assets are valued at a specific point in time (i.e. year-end Balance Sheet), the periodType is considered to be ‘instant’, thus referring to a particular point in time. On the other hand, Cash Flow elements would have ‘duration’ as periodType. ‘balance’ – This attribute defines the balance nature of the element, according to double
entry accounting rules. Assets appear as a debit on the Balance Sheet, hence the respective ‘debit’ attribute. Obviously, on the other hand, a Liabilities element would be characterized as a ‘credit’.
‘Abstract’ – This attribute defines whether this element is to be used in calculations or not. For example, an element such as “Balance Sheet” could be defined in order to assist in the visualization of the final report. However, the element “Balance Sheet” would not have any monetary value associated to it, as it is only meant to be used as a label and it would therefore be described as an abstract element.
‘substitutionGroup’ – This attribute defines whether the element is an ‘item’ or a ‘tuple’. An ‘item’ refers to a single reporting concept, while a ‘tuple’ refers to a collection of items. A possible example of a tuple element could be the company information, such as company name, company address, company telephone, etc.
‘type’ – Finally, the type attribute refers to the kind of value that will be stored in the element. In this case, the element will contain a monetary value, hence the ‘monetaryItem Type’. There are several other types, such as ‘sharesItemType’ for shares based values, ‘decimalItemType’ for decimal values or stringItemType for string values, among others.
2.2.6. T
AXONOMYL
INKBASESBesides the schema, as it was mentioned earlier, any XBRL taxonomy contains linkbases. The elements contained in the Schema do not contain any information whatsoever regarding their hierarchy or relationships with other elements. Therefore, it is the role of the linkbases to establish the relationships amongst the various taxonomy elements.
As stated in the IASB XBRL site [17], “the creation of an XBRL taxonomy, regardless of its purpose, also involves performing (the) following actions:
labelling elements in specified languages in order to make taxonomy readable for humans;
referencing elements to the external resources that justify their existence and that contain an explanation, definition or example of the use of the particular financial concept,
16
defining relations between elements according to different criteria.”
FIGURE 2.4 - THE ROLE OF LINKBASES IN A XBRL TAXONOMY [17] Figure 2.4 provides a graphical representation of the role of the various linkbases.
For instance, the calculation, presentation and definition linkbases are described with bidirectional arrows, meaning that they help define relationships between elements.
On the other hand, the reference and label linkbases are represented by unidirectional arrows, meaning that they provide links to resources that are external to the taxonomy.
Linkbases are based on two XML languages:
XLink – Also known as XML Linking Language, XLink “allows elements to be inserted into XML documents in order to create and describe links between resources.” [18] XPointer – Or, XML Pointer Language, which “allows for examination of a hierarchical
document structure and choice of its internal parts based on various properties, such as element types, attribute values, character content, and relative position.” [19]
Basically, in order to create a relation, we need to point to elements or resources that we are interested in and define the type of relationship. A simplified example of a hierarchical relation from a presentation linkbase is provided below [17]:
<loc xlink:type="locator"
xlink:href="schema.xsd#Assets" xlink:label="Assets_Locator"/>
17 <loc xlink:type="locator" xlink:href="schema.xsd#CurrentAssets" xlink:label="CurrentAssets_Locator"/> <presentationArc xlink:type="arc" xlink:arcrole="http://www.xbrl.org/2003/arcrole/parent-child" xlink:from="Assets_Locator" xlink:to="CurrentAssets_Locator"/>
In this particular example, two locators are created using Xlink. Locators help identify reporting concepts in a taxonomy. These locators indicate that the elements ‘Assets’, in the first locator, and ‘Current Assets’, in the second locator, are in the schema.xsd file, under the references ‘#Assets’ and ‘#CurrentAssets’ respectively. Each locator has also its own label, in this case, ‘Assets_Locator’ and ‘CurrentAssets_Locator’.
The last section of code describes the relationship between the two elements. The ‘presentationArc’ reference means that this is a presentation linkbase relationship, whereas the ‘arcrole’ attribute defines the relation as a ‘parent-child’. The last line of code refers that the ‘Assets’ element (from) is the ‘parent’ of the ‘Current Assets’ element.
There are five different types of linkbases in a XBRL taxonomy: Presentation
Calculation Definition Label Reference
Each of these linkbases will be explained in further detail in the following sections.
2.2.7. P
RESENTATIONL
INKBASEThe presentation linkbase, as its name implies, stores the relations between the various taxonomy elements, so that they may be properly organized within the taxonomy. By organizing the various taxonomy elements, they can then be presented in a structured way.
For example, a Balance Sheet contains information regarding Assets, which may be decomposed into Current Assets and Non-current Assets. As seen in the example above, the presentation linkbase will store parent-child relations, defining the relation between these two elements.
2.2.8. C
ALCULATION LINKBASEThe calculation linkbase is used to add some sort of validation rules to XBRL reports. This linkbase contains “basic validation rules, which apply to all instance documents referring to a particular taxonomy” [17]. Whereas the presentation linkbase provides a hierarchy of how the elements should be presented, the calculation linkbase provides a structure where lower level
18
elements are summed or subtracted from one another, so that the higher level element is the result of these calculations.
The following is a basic example of how the calculation linkbase works:
FIGURE 2.5 - CALCULATION LINKBASE EXAMPLE [17]
In the example shown in Figure 2.5, the high-level element ‘Gross Profit’ is obtained by the addition of ‘Total Revenue’, which is represented with weight ‘1’, and the subtraction of ‘Cost of Sales’, which is defined with a ‘-1’ weight.
The XBRL code for the above example is as follows [17]:
<calculationArc xlink:type="arc"
xlink:arcrole="http://www.xbrl.org/2003/arcrole/summation-item" xlink:from="GrossProfit" xlink:to="RevenueTotal"
order="1" weight="1" use="optional"/>
<calculationArc xlink:type="arc"
xlink:arcrole="http://www.xbrl.org/2003/arcrole/summation-item" xlink:from="GrossProfit" xlink:to="CostOfSales"
order="2" weight="-1" use="optional"/>
One must notice the similarities between the calculation linkbase and the presentation linkbase. The calculation relation is defined with a ‘calculationArc’, where the ‘arcrole’ attribute is defined as a ‘summation-item’. However, the negative weight in the ‘CostOfSales’ is what indicates that this element must be subtracted, instead of added to the ‘Gross Profit’ element.
While getting a better understanding of the calculation linkbase, one also gets a better idea behind the need for the presentation linkbase:
19
As stated earlier, in the calculation base, the high-level element is the sum of all lower level elements. However, the way a financial report is structured, requires that Total Assets appear at the bottom of all elements, thus to indicate that is a sum of the elements above it.
Despite the added advantage of having some data validation built-in into the XBRL taxonomy itself, the calculation linkbase does have its limitations. The major limitation behind the calculation linkbase is that it does not allow elements which have different ‘periodType’ attributes. One significant example of this limitation is for example, the inability to perform calculations between elements from the Balance Sheet, which have an ‘instant’ ‘periodType’, with elements contained in the Income Statement or Cash-Flow Statement, which have a ‘duration’ ‘periodType.’
However, in June of this year, the XBRL consortium released a new Formula Linkbase, XBRL Formula 1.0, which makes it “possible to define logical and mathematical relations expressing sophisticated rules and checks between business concepts.” [20]
Given its recent introduction, it may take still a few more months before existing taxonomies are revised and updated to include this new linkbase.
2.2.9. D
EFINITIONL
INKBASEThe definition linkbase allows the ability to create relationships which are not covered by either the calculation or presentation linkbases.
The four types of standard relationships supported by the definition linkbase are:
‘general-special’ – this type of relationship helps distinguish between concepts that have a generic or a more specific (special) meaning. For example, ‘ZIP Code’ is a specific definition of the more general concept of ‘Postal Code’.
‘essence-alias’ – This relationship allows matching different elements that have same meaning. For example, an airline company may use the concept of ‘Planes’ in its taxonomy, while another airline may use ‘Aircraft’, even though for accounting purposes, the concepts are the same and they can be used interchangeably.
‘similar-tuples’ – This relationship is similar to the essence-alias. While the ‘essence-alias’ applies only to single elements, the ‘similar-tuples’ applies to two different tuples that have equivalent meanings.
‘requires-element’ – As the name itself states, this sort of relationship is used when the value of one element requires the value of another element. An example of this relationship can be when a regulatory authority may require the disclosure of certain component of Assets, if that particular component appears on the Balance Sheet.
20
2.2.10.
R
EFERENCEL
INKBASEThe purpose of the reference linkbase, as stated by its name, is to provide a reference mechanism to the elements contained in the taxonomy.
Most taxonomies are based on existing accounting standards or regulations, be they international, such as the IFRS, or national, such as the POC in Portugal. Hence, XBRL taxonomies allow for the inclusion of a reference to those specific documents or items, in order to provide some sort of guidance to would be XBRL instance creators.
Examples of reference relationships are shown below [17]:
<reference xlink:type="resource" xlink:role="http://www.xbrl.org/2003/role/presentationRef" xlink:label="CashFlowsFromUsedInOperationsTotal_ref"> <ref:Name>IAS</ref:Name> <ref:Number>7</ref:Number> <ref:Paragraph>14</ref:Paragraph> </reference> <reference xlink:type="resource" xlink:role="http://www.xbrl.org/2003/role/measurementRef" xlink:label="CashFlowsFromUsedInOperationsTotal_ref"> <ref:Name>IAS</ref:Name> <ref:Number>7</ref:Number> <ref:Paragraph>18</ref:Paragraph> <ref:Subparagraph>a</ref:Subparagraph> </reference>
The first segment of XBRL code refers to a presentation reference, meaning that it references a document that explains “how and where the element should be presented in terms of its placement and labeling” [17]. In this case, we can find that reference in the IAS 7, paragraph 14. The second type of reference relationship is a measurement reference. Therefore, the resource referenced will explain how the value for that particular element is determined and how it should be calculated.
2.2.11.
L
ABELL
INKBASEFinally, the label linkbase provides a mechanism to make XBRL taxonomies “multi-lingual”, meaning that a single element can have multiple labels, in various different languages, as shown below [17]:
<label xlink:type="resource" xlink:role="http://www.xbrl.org/2003/role/label" xlink:label="ifrs_AssetsTotal_lbl" xml:lang="en">Assets, Total</label>
<label xlink:type="resource" xlink:role="http://www.xbrl.org/2003/role/label"
xlink:label="ifrs_AssetsTotal_lbl" xml:lang="de">Vermögenswerte, Gesamt</label>
21
xlink:label="ifrs_AssetsTotal_lbl" xml:lang="pl">Aktywa, Razem</label>
The three label relationships above all refer to the same element, ‘Assets’, where the first label is in English, followed by the German and Polish translations.
2.2.12.
T
AXONOMY EXTENSIONAs its name implies, the first attribute of XBRL is its “extensibility”, meaning that given the variety of industries and businesses, some companies are required to modify existing “standard” taxonomies (i.e. national taxonomies, IFRS taxonomies) in order to suit their own particular needs, such as adding new elements not contained in the original taxonomy, or changing the relationships between existing elements, with regards to their order, addition or deletion.
XBRL does allow such flexibility, however such extensions must not modify the base taxonomy. This is usually not possible, because as seen in the schema section of this chapter, the URI’s for the standard taxonomies are usually web addresses that are out of reach to taxonomy creators.
2.2.13.
XBRL
I
NSTANCED
OCUMENTAfter the taxonomy is created, it is then possible to create an instance document, in accordance to the specified taxonomy.
The instance document will contain the values for the elements specified in the taxonomy, together with an explanation of the context in which they are specified.
Finally, XBRL instance documents also allow the inclusion of footnotes, whenever further information is needed regarding a particular element.
2.3. L
IMITATIONS OFXBRL
AND THEN
EED FORO
NTOLOGIESIn order to ensure the successful exchange of data, there are two interoperability areas which must be addressed:
- Common syntax – This relates to the way that the data is structured in order to be exchanged.
- Common semantics – Even if data can be exchanged, the semantics of the data being
exchanged must be common, that is, the meaning behind the data concepts must be the same in order to enable complete interoperability between systems.
In the realm of accounting reporting data, XBRL has provided a common syntax for the exchange of financial accounting data, and thus becoming the ‘de facto’ standard for
22
exchanging accounting data in most countries around the world. However, it has some limitations, both technical and conceptual.
As mentioned in section 2.2.8, one of XBRL’s technical limitations is in its calculation linkbase which does not allow calculations between elements which have different ‘periodType’ attributes, such as the elements from the Balance Sheet, which have an ‘instant’ ‘periodType’, with elements contained in the Income Statement or Cash-Flow Statement, which have a ‘duration’ ‘periodType.’
On the other hand, a major conceptual limitation has to do with the variety of XBRL taxonomies, many of which are based on different accounting standards, which vary from country to country. Bansón et al, state that these various taxonomies, “may seem an advantage, but, actually, they represent an impediment for achieving the full, comprehensive expansion and application of the standard. If the bases on which the XBRL taxonomies rest are different, users will not be able to compare the financial information corresponding to companies from different countries." [21] Therefore, as it currently stands, XBRL by itself is not capable of ensuring a common semantic for the exchange of financial reporting data on a global scope. However, the issue of semantic interoperability is one that is not so easy to solve, for three major reasons:
- Existence of different accounting standards - This the most common source of discrepancies, as national accounting standards differ from country to country. For example, these discrepancies may make it difficult for an analyst to compare companies which have financial data according to different accounting standards (ie US GAAP vs IFRS).
- Differing terms may describe the same concept – Even in those situations where the accountings standards being used are the same, it is common to find the same concept being described through different terms, such as, Turnover/Revenue, Net Income/Net Profit, etc.
- Different users may have different views on the same data – Accounting reporting needs
may also vary upon the specific needs of the user. For example, internal accounting data (managerial accounting) needs are different from those of external data consumers, such as regulators, investors, analysts, etc. (financial accounting)
As XBRL focuses on financial accounting only, the issues behind the mapping of concepts between the managerial accounting and the financial accounting realms shall remain outside the scope of this work. However, the same principles which are to be applied to map accounting concepts belonging to different accounting standards are exactly the same as those which could be used to map managerial and financial accounting concepts.
An example of the discrepancies generated by different accounting standards can be shown below, where some of the financial reporting data of a company must be adjusted in order to be reported under a different accounting standard:
![FIGURE 1.1– ONTOLOGICAL HETEREGONEITY EXAMPLE [3]](https://thumb-us.123doks.com/thumbv2/123dok_us/1798946.2757874/26.892.187.748.668.872/figure-ontological-heteregoneity-example.webp)
![FIGURE 2.1 - BUSINESS REPORTING SUPPLY CHAIN [7]](https://thumb-us.123doks.com/thumbv2/123dok_us/1798946.2757874/31.892.139.751.452.772/figure-business-reporting-supply-chain.webp)
![FIGURE 2.2 - BUSINESS REPORTING SUPPLY CHAIN ENABLED BY XBRL [9]](https://thumb-us.123doks.com/thumbv2/123dok_us/1798946.2757874/33.892.144.758.270.571/figure-business-reporting-supply-chain-enabled-xbrl.webp)
![FIGURE 2.3 - XBRL REPORT COMPONENTS [16]](https://thumb-us.123doks.com/thumbv2/123dok_us/1798946.2757874/36.892.226.674.104.439/figure-xbrl-report-components.webp)
![FIGURE 2.4 - THE ROLE OF LINKBASES IN A XBRL TAXONOMY [17]](https://thumb-us.123doks.com/thumbv2/123dok_us/1798946.2757874/40.892.186.687.110.575/figure-role-linkbases-xbrl-taxonomy.webp)
![FIGURE 2.8 – INCOME STATEMENT ITEMS FROM DAIMLER [23] (LEFT) AND NISSAN [24] (RIGHT)](https://thumb-us.123doks.com/thumbv2/123dok_us/1798946.2757874/47.892.132.759.195.1030/figure-income-statement-items-daimler-left-nissan-right.webp)
![TABLE 4.2. SEMANTIC MISMATCHES (BASED ON [31])](https://thumb-us.123doks.com/thumbv2/123dok_us/1798946.2757874/54.892.135.764.147.409/table-semantic-mismatches-based-on.webp)