EUROPEAN
COMMISSION
Brussels, 18.3.2015
SWD(2015) 36 final/2
CORRIGENDUM
This document corrects document SWD(2015) 36 final of 26.02.2015
Addition of missing paragraphs on page 58 and 60
The text shall read as follows:
COMMISSION STAFF WORKING DOCUMENT
Country Report Hungary 2015
Including an In-Depth Review on the prevention and correction of macroeconomic
imbalances
{COM(2015) 85 final}
This document is a European Commission staff working document . It does not
constitute the official position of the Commission, nor does it prejudge any such position.
CONTENTS
Executive summary 1
1. Scene setter: economic situation and outlook 3
2. Imbalances, Risks and Adjustment 11
2.1. External sustainability 12
2.2. Government debt sustainability 18
2.3. Financial sector risks and deleveraging 25
2.4. Labour market with a focus on public works 35
3. Other structural issues 43
3.1. Fiscal policy 44
3.2. Labour market and social cohesion 47
3.3. Education and skills 51
3.4. Business environment 54
3.5. Network industries and environment 58
A. Overview Table 61
B. Standard Tables 68
LIST OF TABLES
1.1. Key economic, financial and social indicators 9
1.2. The MIP scoreboard 10
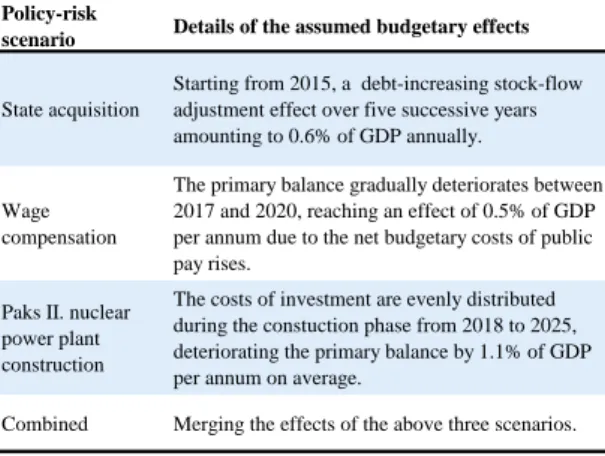
2.2.1. The examined fiscal policy-risk scenarios 21
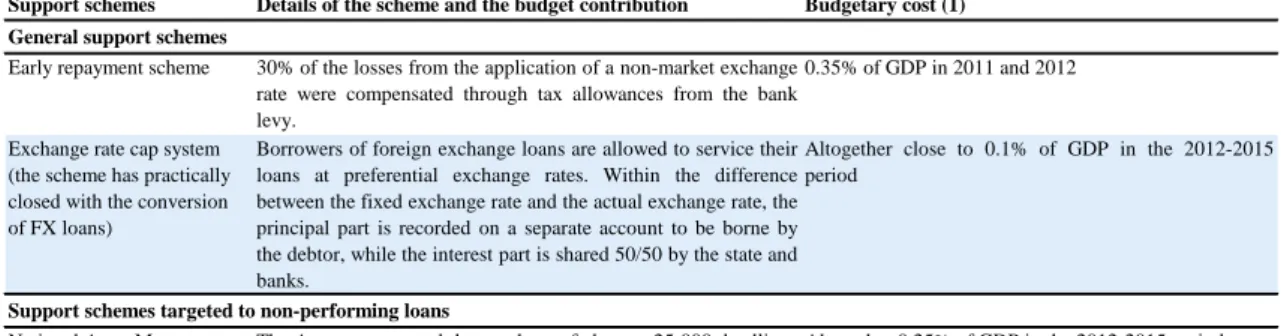
2.3.2. Policy measures increasing the burden on the banking sector 30
B.1. Macroeconomic indicators 68
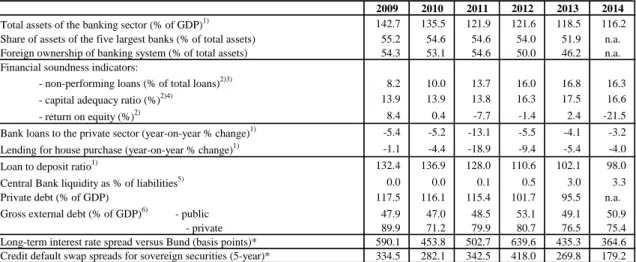
B.2. Financial market indicators 69
B.3. Taxation indicators 69
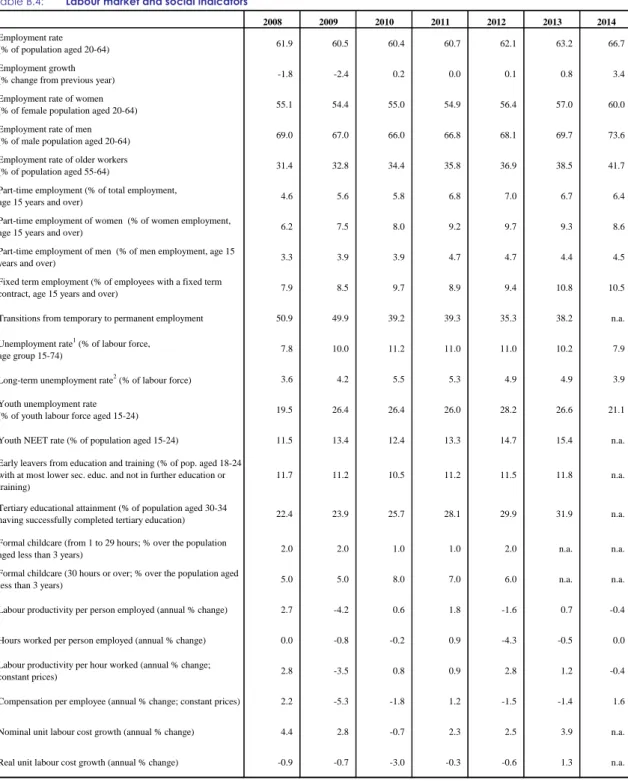
B.4. Labour market and social indicators 70
B.5. Labour market and social indicators (continued) 71
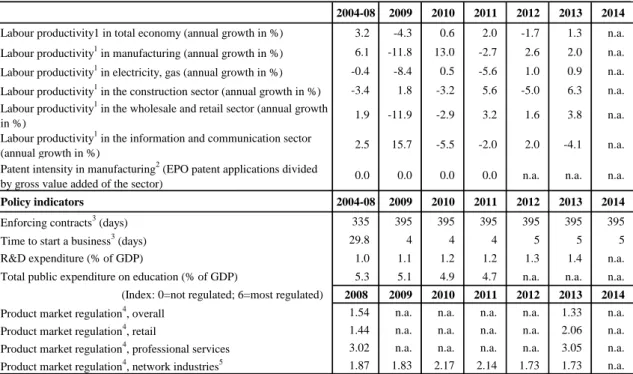
B.6. Product market performance and policy indicators 72
B.7. Green growth 73
LIST OF GRAPHS
1.1. GDP in 2010 constant prices 3
1.2. External and domestic demand contributions to economic growth 3
1.3. Headline inflation and core inflation 4
1.4. Net Lending/Borrowing by Sector 5
1.5. Potential output growth 6
2.1.1. Components of Net International Investment Position 12 2.1.2. Components of the external position (current and capital accounts) 13 2.1.3. Evolution of Hungary's export market share (year-on-year) 14 2.1.4. Net foreign direct investment in the region (% of GDP) 16 2.1.5. Foreign direct investment flows in Hungary (% of GDP) 16 2.1.6. Greenfield foreign direct investment inflows into Hungary (2003-2014) 17 2.2.1. Gross government debt ratio: historic data and short-term projection 19 2.2.2. Composition of the annual change in gross government debt 19 2.2.3. Gross government debt ratio: the baseline scenario 20 2.2.4. Gross government debt ratio: state acquisition and wage compensation scenarios 21 2.2.5. Gross government debt ratio: the Paks II and the combined policy scenarios 22 2.2.6. Gross government debt ratio: sensitivity to macroeconomic variables 22 2.2.7. The share of FX denominated government debt and the effect of previous exchange rate
changes on the gross debt ratio 23
2.2.8. Stochastic debt projections, 2015-19 23
2.2.9. Fiscal policy-risks scenarios compared with the debt-reduction benchmark set by the
one-twentieth rule 24
2.3.1. Decomposition of private sector debt 25
2.3.2. Decomposition of credit flows 25
2.3.3. Change in corporate loans in international comparison (annual transaction-based growth rates)26 2.3.4. Change in household loans in international comparison (annual transaction-based growth rates)27 2.3.5. External funding transactions in the local banking sector (cumulative changes) 29 2.3.6. The Financial Conditions Index (FCI) and economic growth 33 2.3.7. Deleveraging pressures on the supply and demand side 34
2.4.1. Participation, employment and unemployment 35
2.4.2. Activity rate 35
2.4.3. Unemployment rate 36
2.4.4. Change in employment by source of employment, sectoral breakdown 38
2.4.5. Change in employment by source of employment 38
2.4.7. Employment level with and without the public works 39 2.4.8. Probability of successful exit from the Public Work Scheme, by education 40 2.4.9. Probability of successful exit from the Public Work Scheme, by age cohort 40 2.4.10. Probability of successful exit by time spent in the Public Work Scheme (months) 40 3.2.1. The severe material deprivation rate in the region 49 3.3.1. Impact of socio-economic status on mathematics performance (2012) 51
3.3.2. Drop-out rate from tertiary education (2011) 53
3.4.1. Public R&D intensity (1), 2005-2013 57
LIST OF BOXES
1.1. Trade linkages and energy tie of Hungary to Russia 7
1.2. Economic surveillance process 8
1.2. Economic surveillance process 8
2.4.1. Recent tax and benefit measures affecting the low-skilled 37
EXECUTIVE SUMMARY
Following a meagre growth performance in the aftermath of the crisis, Hungary’s GDP is expected to have increased over 3% in 2014, supported by stimulus factors of temporary nature. The surge in growth was driven by temporary measures and factors, such as the increased absorption of EU funds, subsidised loan schemes as well as the regulated utility price cuts. Accordingly, the Commission forecasts a deceleration in growth from 3.3% in 2014 to around 2.5% in 2015 and around 2% in 2016 as the temporary effects peter out. The current negative headline inflation will likely pick up towards 3% by the end of 2016. The trend of employment gains is projected to continue to be led by the private sector. The government deficit is expected to remain broadly around 2.5% of GDP between 2014 and 2016, which may not be sufficient to achieve a robust debt reduction.
This Country Report assesses Hungary's economy against the background of the Commission's Annual Growth Survey which recommends three main pillars for the EU's economic and social policy in 2015: investment, structural reforms, and fiscal responsibility. In line with the Investment Plan for Europe, it also explores ways to maximise the impact of public resources and unlock private investment. Finally, it assesses Hungary in the light of the findings of the 2015 Alert Mechanism Report, in which the Commission found it useful to further examine the persistence of imbalances or their unwinding. The main findings of the In-Depth Review contained in this Country Report are:
Despite the rapid improvements in recent years, external indebtedness continues to be at unsafe levels. Rebalancing of the economy has been on-going since the crisis, driven by sustained current and capital account surpluses, which reflect both private sector deleveraging and the increasing positive contribution from EU funds. In parallel, there has been some structural deterioration on the financing side, as net foreign direct investments, in particular greenfield inflows, have slowed down.
The high level of government debt remains an important source of vulnerability for the
Hungarian economy. Medium-term
sustainability simulations show public debt, in
a baseline scenario, falling further in the coming decade. However, the projected improvements are subject to important fiscal policy-related risks and a considerable vulnerability to economic shocks is still present.
Financial deleveraging has continued in a difficult context characterised by a high regulatory burden on the financial sector and a high level of non-performing loans. The fall seen in the loan-to-deposit ratio has to a large extent been necessary in order to repair balance sheets. Nevertheless, the pace and the channels through which the deleveraging pressures materialised were heavily influenced by financial sector policies, in particular the imposition of a high tax burden. Subsidised lending schemes and the recent pick-up in growth have started to reduce the speed of deleveraging, which is, however, expected to continue in the coming years.
The Public Works Scheme appears to be an
inefficient active labour market policy measure and distorts the proper functioning of the labour market. It nominally reduces unemployment, but there is a risk, also from a budgetary point of view, that public works of such a magnitude could entail significant ‘lock-in’ effects and become a permanent replacement for the system of welfare benefits for the low-skilled. The scheme is not adequately coordinated with other public employment services, and does not sufficiently support the reintegration of participants into the open labour market.
The Country Report also analyses other macroeconomic issues and the main findings are:
Investments peaked in 2014 and are forecast
to decelerate until 2016. Investments started to grow in 2013 for the first time since 2008. In 2014, they showed more than 10% real growth, mainly on the back of EU co-financed public investments. As EU fund absorption is expected to be lower in 2016, this will bring investment growth to around zero.
The efficiency of the Hungarian tax system is affected by a number of flaws both in
Executive summary
terms of design and governance. Recent changes have reignited the earlier trend of raising the weight of sector-specific corporate taxes. The tax burden on some groups of low income earners has remained among the highest in the EU. At the same time, there has been some progress in fighting tax evasion.
The unstable regulatory framework, the
lack of transparency in decision-making procedures and inadequate consultation of interested parties are, together, weighing heavily on the business environment. Frequent and unpredictable regulatory changes, often resulting in new entry barriers in certain sectors, are worsening the investors’ perception. This is exacerbated by the fact that the quality of legislative processes suffers from, inter alia, the lack of proper ex ante impact assessments and short transition periods for stakeholders.
Overall, Hungary has made limited progress
in addressing the 2014 country-specific recommendations. In particular, despite the sharp increase in the share of subsidised loans, normal lending in the economy has not yet returned, partly linked to the further increase in the overall regulatory burden on the financial sector. There has been some progress in the area of tax compliance and in the continued reorganisation of state-owned public transport companies. Some progress has also been made in strengthening the targeted active labour market policies: both the preparation of the profiling system in the Public Employment Service and set-up of the youth mentoring network are on schedule. However, some country-specific recommendations have remained broadly unaddressed. Specifically, the policy advice on the re-arrangement of the tax structure has not been followed. The period of eligibility for unemployment benefits has not been increased and worsening poverty indicators continue to call for integrated policy measures. Entry costs and regulatory restrictions have further increased in several market segments, particularly in the service sector. A systemic approach to promote inclusive mainstream education is yet to be developed.
The Country Report reveals the policy challenges stemming from the analysis of
macro-economic imbalances, namely:
Hungary is still facing considerable external debt rollover needs, thus maintaining the confidence of foreign investors is of utmost importance. A number of anti-competitive measures over the recent years in the non-tradable sectors are weighing on the attractiveness of the country as business location.
Normal lending flows to the economy have yet to be restored. Subsidised lending schemes cannot substitute a sound operating environment for banks. There is a lack of sufficient capital accumulation possibilities in financial intermediation and the adopted relief schemes were not targeted. State interventions in the banking sector via increased direct ownership, even for a temporary period, may entail significant fiscal risks.
The increasing dominance of the Public
Work Schemes poses a significant challenge for improving the efficiency of active labour market policies. This is all the more so in light of its limited positive effect on the employment chances of participants and its quadrupling budgetary cost over the last four years.
Other policy challenges are: The legislated medium-term budgetary framework is not yet implemented. Despite recent progress, there is still a significant scope to improve administrative efficiency in tax collection and to reduce tax evasion. Gaps remain in the efficiency and coverage of social assistance. The rigorous enforcement of the legislated conditions for law-making is still missing. There are shortages of skilled professionals in science and engineering and of the SME’s innovative capacities. Transitions between the stages of education are still weak and systemic measures to promote inclusive mainstream education, early school leaving prevention and wider access and completion of tertiary education have not been put in place. The adopted price cuts for household consumers in the energy sector have not been reviewed.
1.
SCENE SETTER: ECONOMIC SITUATION AND OUTLOOK
Macroeconomic developmentsHungary's economic growth has generally been weak since the start of the crisis, and growth accelerated significantly only since 2014. After the crisis, Hungary experienced a moderate recovery in 2010 and 2011 (0.8% and 1.8% respectively), before the country fell back into recession again in 2012 with a negative 1.5% GDP growth. In 2013, economic activity revived again with a moderate 1.5%. After five years of continuous decline, 2013 was the first year when gross fixed capital formation turned positive.
GDP has only reached the level of the pre-crisis period but lags behind regional peers. The Hungarian GDP is still below its 2008 level by about 1%, while Poland's and Slovakia's GDP far exceed the pre-crisis levels.
Graph 1.1: GDP in 2010 constant prices
90 95 100 105 110 115 120 08 09 10 11 12 13 14* CZ HU PL SK 2008=100
Source: European Commission
Note: * Data is based upon European Commission winter 2015 forecast
GDP picked up in 2014, and based on the Commission’s winter 2015 forecast it is projected to have accelerated to 3.3%. This is attributed to growing domestic demand with a significant contribution of gross fixed capital formation. The surge in growth (3.8% in the first half of 2014), however, was supported by temporary measures and factors, such as the stepped-up absorption of EU funds and the central
bank’s Funding for Growth Scheme of subsidised loans to small- and medium-sized enterprises.
Economic activity has started to slow down slightly in the second half of 2014 and is expected to further decelerate until 2016. According to the Commission's 2015 winter forecast, economic growth is projected to stand at 2.4 % and 1.9 % in 2015 and 2016, respectively, reflecting the fading of the above mentioned time-bound stimulus measures. The flash estimate for 2014 annual growth is 3.5%, which increases somewhat the positive risks to the Commission’s projections.
Graph 1.2: External and domestic demand contributions to economic growth -10 -8 -6 -4 -2 0 2 4 6 8 10 98 99 00 01 02 03 04 05 06 07 08 09 10 11 12 13 14 15 16 pp Investment Consumption
Net exports GDP growth (2010 prices)
Source: European Commission
Domestic demand is expected to remain the main driver of economic growth in the coming years, but with a shift from investment to private consumption. Due to measures easing the burden of mortgage loans on households (see below), real disposable income will be affected positively in 2015, and this would stimulate consumption (Graph 1.2). With the start of the new Multiannual Financial Framework period for EU structural and investment funds, the absorption of EU funds is expected not to be at full speed in 2016. The associated drop will have a visible impact on investment activity, particularly in the public sector, and as a result investment growth is projected to be negative in 2016. Export growth, which is set to decrease in 2015 due to lower demand from major trade partners, is expected to
pick up again in 2016, while imports will remain stable fuelled by private consumption. Thus net exports will contribute moderately to growth in 2015, but more significantly in 2016.
Household final consumption expenditure could be boosted by expanding real disposable income. First, this is due to the adopted settlement scheme for household loans, which requires banks to compensate borrowers for unfairly applied terms (for details, see section 2.3). This elevates the consumption path by almost 1 pp. in 2015. Second, also linked to the reduced uncertainty concerning mortgage loans, the precautionary savings attitude of households is expected to start to gradually decrease. Finally, there is the effect of low inflation which increases the purchasing power of wages and pensions.
Inflation was on average around 5% until 2011, but has started to decrease rapidly since 2012. The fall in inflation was driven by regulated and utility price cuts. Inflation decelerated to -0.2% in 2014, which was also influenced by falling oil prices as well as by imported disinflation. Inflation expectations have adjusted downwards, but core inflation in 2014 remained in positive territory. With the weaker exchange rate passing through to prices, inflation is expected to increase gradually to reach the 3% target of the central bank by the end of 2016.
Graph 1.3: Headline inflation and core inflation
-2 0 2 4 6 8 10
Consumer price index
Core inflation excluding indirect taxes
Source: MNB
LABOUR MARKET SITUATION
The number of employed rose to an all-time high and unemployment rate dropped to an all-time low in 2014. While employment has also recovered in the private sector with the economic uptake, this happened to a large extent on account of the expansion of the Public Work Scheme since
2011. Without the public works, the
unemployment rate would be higher by at least 1.5 pps. Furthermore, it is foreseen in the medium-term budgetary plans that the size of the scheme will be further extended. It needs therefore a closer look to assess whether recent labour market developments, heavily influenced by the Public Work Scheme, can lead to a lasting improvement in Hungary's employment in the open labour market (see section 2.4).
Although both the employment rate and the activity rate are increasing, they are still low in international comparison. Activity is increasing rapidly, but still below the level of regional peers and by some 5 pps. below the EU average. At the same time, unemployment declined to the second lowest level among the Visegrád countries.
Despite the improvements in the labour market, all poverty indicators have shown a substantial and continuous deterioration since the start of the crisis. Specifically, the number of young people not in employment, education or training has been constantly increasing since 2010 and the number of people at risk of poverty or social exclusion has been increasing since 2009.
Budgetary developments and outlook
Following the exit from the Excessive Deficit
Procedure in 2013, Hungary's general
government deficit has been kept under control. In 2014, the headline deficit is projected in the Commission's 2015 winter forecast to reach 2.6% of GDP, compared to 2.4% of GDP in the previous year. The estimated deterioration in the structural balance is more significant (1.3 pps.) revealing the easing of the fiscal stance in the election year. The government deficit is projected to increase slightly further this year before decreasing to 2.5% of GDP in 2016. The structural balance is also forecast to improve moderately, but will remain well above the country's medium-term objective (i.e. -1.7% of GDP).
Government debt is expected to decrease only very moderately in the short term. The debt-to-GDP ratio is forecast to having increased by about 0.4 pp. in 2014 to 77.7% mainly on account of the weakening of the exchange rate. The debt reduction is expected to be rather contained in 2015 and relatively faster in 2016.
The high level of public debt is a source of fragility for the Hungarian economy. With the current level of the gross government debt-to-GDP ratio, the country occupies an outlier position within the group of low and middle income economies. This results in elevated risk premia containing investment and economic activity. Although the government debt has been declining since the beginning of the decade, it is not yet on a firmly decreasing path. It is therefore relevant to explore the medium-term prospects for debt reduction (see section 2.2).
Financial sector
Private sector indebtedness continued
decreasing on the back of a persistent active deleveraging in the economy, which pace has slowed down recently. The balance sheet repair in the private sector has predominantly been driven by the continued contraction in private sector credit flows. Net lending flows to the private sector have improved recently, as the subsidized lending programmes provided some temporary relief in access to credit for firms, in particular for SMEs. However, the conditions of financial intermediation have not improved in a sustainable manner to restore normal lending.
The situation in the financial sector continues to raise concerns. Although the sector seems to be adequately capitalised (the aggregate capital adequacy was hovering around twice of the regulatory minimum of 9% in recent quarters) and its liquidity position is relatively strong, the combination of a high level of tax and regulatory burdens as well as a high share of problematic loans does not provide the right incentives for banks to increase their lending activity. The persistence of banks' negative profits represents a risk to financial stability, which was exacerbated by costs of the ongoing settlements with foreign-exchange borrowers and the new tightening regulatory steps. An analysis is therefore
warranted on the main drivers of the deleveraging process and the related risks (see section 2.3).
External Balances
The external balance of the country is stable. The current account turned positive in 2010 and currently stands just above 4% of GDP. In the Commission’s 2015 winter forecast, it is expected to increase further, as the surplus in goods and services trade balance rises. The capital account surplus is projected to increase slightly in 2015 and to decline in 2016, reflecting the dynamics of EU funds absorption. Similarly, the net lending position will improve until 2015, but with reducing EU fund inflows, it is projected to decrease below 8% of GDP in 2016.
Graph 1.4: Net Lending/Borrowing by Sector
-15 -10 -5 0 5 10 15 99 00 01 02 03 04 05 06 07 08 09 10 11 12 13 14 15 16 % o f GD P
Households and NPISH General government
Corporations Total economy
Source: European Commission
Private sector deleveraging has been mirrored in a surplus of the external balance, despite a weak export performance. Export market shares fell by a cumulative 19% between 2009 and 2013, the worst export performance in a regional comparison. Despite this negative development, the net lending/borrowing position of the whole economy was in surplus, driven mainly by the adjustment of the private sector resulting in a substantial decline in the investment rate. (see section 2.1).
Medium-term economic outlook
Although somewhat improving, the growth potential of the country remains moderate. The weak growth potential mainly reflects a weak total factor productivity which in turn is linked to problems with financial intermediation as well as to the low level of innovation in the economy in general. Capital accumulation is also below the pre-crisis level. This is due to deleveraging (see section 2.3), but partly also stems from the perceived deterioration in the business environment. On the other hand, there have been some improvements in the contribution of labour to potential growth, which is linked to structural reforms (see section 2.4 for details). Looking ahead, the growth potential of the country is estimated at 1.8% on average between 2014 and 2016 according to the Commission's winter forecast, but it is projected to decline to 1.5% in the medium term. In an international comparison, Hungary is lagging behind regional peers in terms of potential growth. Hungary's potential growth is significantly below that of Poland (3.1%) and Slovakia (2.5%), while it is somewhat higher than in the case of the Czech Republic (1.2%).
There is a lack of appropriate economic policies to address Hungary's relatively low grow potential. Normal lending in the economy is not yet restored due to a high regulatory and tax burden on the financial sector and the continued need for portfolio cleaning. In addition, the Hungarian tax system faces several challenges both in terms of design and governance. The increased reliance on sector-specific taxes in recent years may have exacerbated the productivity problems. The introduction of additional restrictions to entry in certain service sectors also hamper an efficient allocation of economic resources and increase uncertainty for investors. The unstable regulatory framework coupled with a lack of transparency in decision-making
procedures and inadequate stakeholder
consultations are negatively affecting the business environment. Moreover, the education system appears to have a low ability to tackle the substantial disparity in the employment opportunities of high and low-skilled workers through increasing the education attainment.
Graph 1.5: Potential output growth
-1 0 1 2 3 4 5 00 01 02 03 04 05 06 07 08 09 10 11 12 13 14 15 16 labour capital TFP POT GDP
Source: European Commission
Box 1.1 summarises trade and energy linkages
between Hungary and Russia. Regarding foreign
direct investment, Hungary's exposure is not large, but one bank is substantially affected by the Russian crisis. The direct trade effect of the Russian crisis is also not significant, but together with indirect trade effects there is a small negative effect on GDP. The energy (oil and gas) exposure on the other hand is relatively large.
Box 1.1: Trade linkages and energy tie of Hungary to Russia
FDI from Russia to Hungary is negligible, while Hungarian FDI outflows to Russia are also not significant, namely around 0.6% of GDP. Nevertheless, most of this FDI is related to one company, Hungary's largest commercial bank, OTP. OTP's exposure to Russia is around 3% of GDP. The bank has a very high capital adequacy ratio at 20% as well as high loan loss coverage in the Russian markets (around 100% in Russia). While the intensification of the Russian crisis could have a significant effect on its capital position, the bank’s excess capital is above the regulatory requirement (at around 2.8% of GDP) and is close to its total exposure to Russia. This being said, OTP does not have a large parent bank behind it and its total size of assets stand around one third of Hungarian GDP. Therefore, its exposure could be an important vulnerability.
As regards trade channels, the share of exports to Russia is around 4½ % of total exports (2.9% in goods and 1.3% in services, 2013 data) while the share of imports from Russia in total imports is around 9½% (9% in goods and 1.3% in services, 2013 data,). As regards the product structure of imports, Hungary is most exposed to Russia in terms of energy supply. The share of Russian gas in the country's natural total consumption is 64.5%, the share of Russian oil in total oil gross inland consumption is 91.3% (indirectly through Ukraine) and the share of Russian coal in total coal gross inland consumption is 3.1%. Current storage levels could mitigate the effects of such disruptions albeit just temporarily as they would cover supply needs for more than two months in case of natural gas, and for around 100 days in case of crude oil. Other sources of supply are deemed to be extremely difficult to find in the short to medium term, especially with regard to gas. In fact, the pipelines connecting Hungary to Western Europe (through the Austrian exchange and the new Slovak one, which is not yet operational) could not ensure a sufficient level of provision given the current demand. Moreover, the Southstream project was officially abandoned in December 2014. Alternative solutions are currently being investigated.
Although in the first half of 2014 exports to Russia and Ukraine declined by 20% and 10% year-on-year, respectively, GDP was a strong (3.8% year-o-year during this period and export volumes also performed well with a 7.2% growth. Overall, the Russian slowdown has not affected visibly the Hungarian economy yet. While the confidence channel effect is more prominent (the decline in stock prices affects both investment – user cost channel – and consumption – wealth effect) and has a negative GDP growth effect of less than 0.1 pp in 2014 and 0.3 pp in 2015. Hungary’s trade comes mostly from countries that have relatively strong trade linkages with Russia (Germany, Austria and Central and Eastern European Countries). Finally, the indirect effects (the effects of the Russian crisis on Hungary's major trade partners) are forecast to have a further negative growth effect of 0.1 pp for both 2014 and 2015. Overall, according to most recent calculations of the Commission services', the negative impact of the Russian crisis on Hungary's GDP growth is estimated at 0.2 pp. in 2014 and is expected to be around 0.4 pp. in 2015.
The devaluation of the RUB against the HUF (and against the EUR) reduces export revenues for the concerned Hungarian firms, which affects profits, investments and thus GDP. Several Hungarian companies have a large exposure to Russia. In terms of exports, the pharmaceutical industry has a very significant share of revenues (around 30%) from Russia (revenues totalling around 0.4% of GDP).
Box 1.2: Economic surveillance process
The Commission’s Annual Growth Survey, adopted in November 2014, started the 2015 European Semester, proposing that the EU pursue an integrated approach to economic policy built around three main pillars: boosting investment, accelerating structural reforms and pursuing responsible growth-friendly fiscal consolidation. The Annual Growth Survey also presented the process of streamlining the European Semester to increase the effectiveness of economic policy coordination at the EU level through greater accountability and by encouraging greater ownership by all actors.
In line with streamlining efforts this Country Report includes an In-Depth Review — as per Article 5 of Regulation no. 1176/2011 — to determine whether macroeconomic imbalances still exist, as announced in the Commission’s Alert Mechanism Report published on November 2014.
Based on the 2014 In-Depth Review for Hungary published in March 2014, the Commission concluded that Hungary was experiencing macroeconomic imbalances, which require monitoring and decisive policy action, in particular, the ongoing adjustment of the highly negative net international position, the high level of public and private debt in the context of a fragile financial sector and deteriorating export performance continue to deserve very close attention.
This Country Report includes an assessment of progress towards the implementation of the 2014 Country-Specific Recommendations adopted by the Council in July 2014. The Country-Specific Recommendations for Hungary concerned public finances and taxation, financial sector, labour market, education, business environment and network industries.
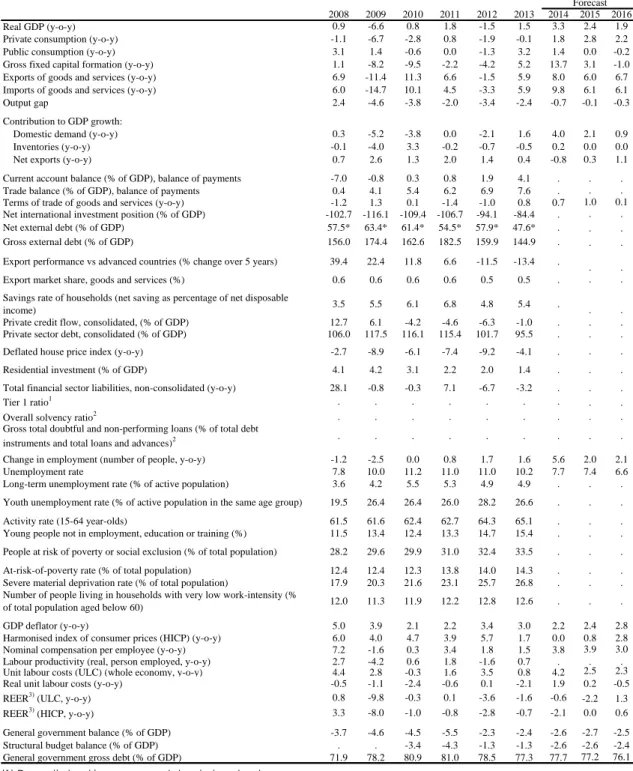
Table 1.1: Key economic, financial and social indicators
2008 2009 2010 2011 2012 2013 2014 2015 2016
Real GDP (y-o-y) 0.9 -6.6 0.8 1.8 -1.5 1.5 3.3 2.4 1.9
Private consumption (y-o-y) -1.1 -6.7 -2.8 0.8 -1.9 -0.1 1.8 2.8 2.2
Public consumption (y-o-y) 3.1 1.4 -0.6 0.0 -1.3 3.2 1.4 0.0 -0.2
Gross fixed capital formation (y-o-y) 1.1 -8.2 -9.5 -2.2 -4.2 5.2 13.7 3.1 -1.0
Exports of goods and services (y-o-y) 6.9 -11.4 11.3 6.6 -1.5 5.9 8.0 6.0 6.7
Imports of goods and services (y-o-y) 6.0 -14.7 10.1 4.5 -3.3 5.9 9.8 6.1 6.1
Output gap 2.4 -4.6 -3.8 -2.0 -3.4 -2.4 -0.7 -0.1 -0.3
Contribution to GDP growth:
Domestic demand (y-o-y) 0.3 -5.2 -3.8 0.0 -2.1 1.6 4.0 2.1 0.9
Inventories (y-o-y) -0.1 -4.0 3.3 -0.2 -0.7 -0.5 0.2 0.0 0.0
Net exports (y-o-y) 0.7 2.6 1.3 2.0 1.4 0.4 -0.8 0.3 1.1
Current account balance (% of GDP), balance of payments -7.0 -0.8 0.3 0.8 1.9 4.1 . . .
Trade balance (% of GDP), balance of payments 0.4 4.1 5.4 6.2 6.9 7.6 . . .
Terms of trade of goods and services (y-o-y) -1.2 1.3 0.1 -1.4 -1.0 0.8 0.7 1.0 0.1
Net international investment position (% of GDP) -102.7 -116.1 -109.4 -106.7 -94.1 -84.4 . . .
Net external debt (% of GDP) 57.5* 63.4* 61.4* 54.5* 57.9* 47.6* . . .
Gross external debt (% of GDP) 156.0 174.4 162.6 182.5 159.9 144.9 . . .
Export performance vs advanced countries (% change over 5 years) 39.4 22.4 11.8 6.6 -11.5 -13.4 .
. .
Export market share, goods and services (%) 0.6 0.6 0.6 0.6 0.5 0.5 . . .
Savings rate of households (net saving as percentage of net disposable
income) 3.5 5.5 6.1 6.8 4.8 5.4 . . .
Private credit flow, consolidated, (% of GDP) 12.7 6.1 -4.2 -4.6 -6.3 -1.0 . . .
Private sector debt, consolidated (% of GDP) 106.0 117.5 116.1 115.4 101.7 95.5 . . .
Deflated house price index (y-o-y) -2.7 -8.9 -6.1 -7.4 -9.2 -4.1 . . .
Residential investment (% of GDP) 4.1 4.2 3.1 2.2 2.0 1.4 . . .
Total financial sector liabilities, non-consolidated (y-o-y) 28.1 -0.8 -0.3 7.1 -6.7 -3.2 . . .
Tier 1 ratio1 . . . .
Overall solvency ratio2 . . . .
Gross total doubtful and non-performing loans (% of total debt
instruments and total loans and advances)2 . . . .
Change in employment (number of people, y-o-y) -1.2 -2.5 0.0 0.8 1.7 1.6 5.6 2.0 2.1
Unemployment rate 7.8 10.0 11.2 11.0 11.0 10.2 7.7 7.4 6.6
Long-term unemployment rate (% of active population) 3.6 4.2 5.5 5.3 4.9 4.9 . . .
Youth unemployment rate (% of active population in the same age group) 19.5 26.4 26.4 26.0 28.2 26.6 . . .
Activity rate (15-64 year-olds) 61.5 61.6 62.4 62.7 64.3 65.1 . . .
Young people not in employment, education or training (%) 11.5 13.4 12.4 13.3 14.7 15.4 . . .
People at risk of poverty or social exclusion (% of total population) 28.2 29.6 29.9 31.0 32.4 33.5 . . .
At-risk-of-poverty rate (% of total population) 12.4 12.4 12.3 13.8 14.0 14.3 . . .
Severe material deprivation rate (% of total population) 17.9 20.3 21.6 23.1 25.7 26.8 . . .
Number of people living in households with very low work-intensity (%
of total population aged below 60) 12.0 11.3 11.9 12.2 12.8 12.6 . . .
GDP deflator (y-o-y) 5.0 3.9 2.1 2.2 3.4 3.0 2.2 2.4 2.8
Harmonised index of consumer prices (HICP) (y-o-y) 6.0 4.0 4.7 3.9 5.7 1.7 0.0 0.8 2.8
Nominal compensation per employee (y-o-y) 7.2 -1.6 0.3 3.4 1.8 1.5 3.8 3.9 3.0
Labour productivity (real, person employed, y-o-y) 2.7 -4.2 0.6 1.8 -1.6 0.7 . . .
Unit labour costs (ULC) (whole economy, y-o-y) 4.4 2.8 -0.3 1.6 3.5 0.8 4.2 2.5 2.3
Real unit labour costs (y-o-y) -0.5 -1.1 -2.4 -0.6 0.1 -2.1 1.9 0.2 -0.5
REER3) (ULC, y-o-y) 0.8 -9.8 -0.3 0.1 -3.6 -1.6 -0.6 -2.2 1.3
REER3) (HICP, y-o-y) 3.3 -8.0 -1.0 -0.8 -2.8 -0.7 -2.1 0.0 0.6
General government balance (% of GDP) -3.7 -4.6 -4.5 -5.5 -2.3 -2.4 -2.6 -2.7 -2.5
Structural budget balance (% of GDP) . . -3.4 -4.3 -1.3 -1.3 -2.6 -2.6 -2.4
General government gross debt (% of GDP) 71.9 78.2 80.9 81.0 78.5 77.3 77.7 77.2 76.1
Forecast
(1) Domestic banking groups and stand-alone banks.
(2) Domestic banking groups and stand-alone banks, foreign-controlled (EU and non-EU) subsidiaries and branches. (3) Real effective exchange rate
(*) Indicates BPM5 and/or ESA95
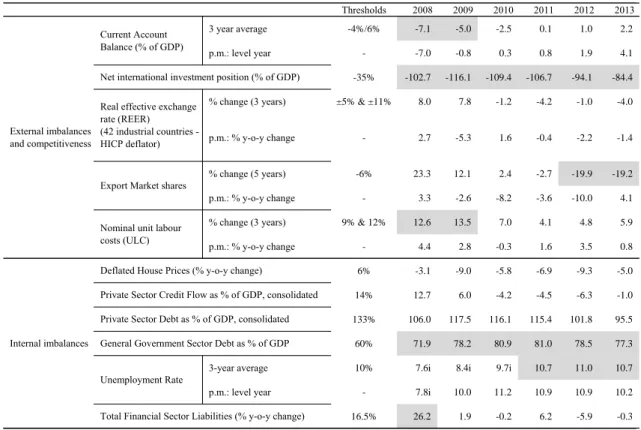
Table 1.2: The MIP scoreboard
Thresholds 2008 2009 2010 2011 2012 2013
3 year average -4%/6% -7.1 -5.0 -2.5 0.1 1.0 2.2
p.m.: level year - -7.0 -0.8 0.3 0.8 1.9 4.1
-35% -102.7 -116.1 -109.4 -106.7 -94.1 -84.4
% change (3 years) ±5% & ±11% 8.0 7.8 -1.2 -4.2 -1.0 -4.0
p.m.: % y-o-y change - 2.7 -5.3 1.6 -0.4 -2.2 -1.4
% change (5 years) -6% 23.3 12.1 2.4 -2.7 -19.9 -19.2
p.m.: % y-o-y change - 3.3 -2.6 -8.2 -3.6 -10.0 4.1
% change (3 years) 9% & 12% 12.6 13.5 7.0 4.1 4.8 5.9
p.m.: % y-o-y change - 4.4 2.8 -0.3 1.6 3.5 0.8
6% -3.1 -9.0 -5.8 -6.9 -9.3 -5.0
14% 12.7 6.0 -4.2 -4.5 -6.3 -1.0
133% 106.0 117.5 116.1 115.4 101.8 95.5
60% 71.9 78.2 80.9 81.0 78.5 77.3
3-year average 10% 7.6i 8.4i 9.7i 10.7 11.0 10.7
p.m.: level year - 7.8i 10.0 11.2 10.9 10.9 10.2
16.5% 26.2 1.9 -0.2 6.2 -5.9 -0.3
Internal imbalances
Deflated House Prices (% y-o-y change)
Private Sector Credit Flow as % of GDP, consolidated Private Sector Debt as % of GDP, consolidated General Government Sector Debt as % of GDP Unemployment Rate
Total Financial Sector Liabilities (% y-o-y change) External imbalances
and competitiveness
Current Account Balance (% of GDP)
Net international investment position (% of GDP) Real effective exchange
rate (REER) (42 industrial countries - HICP deflator)
Export Market shares
Nominal unit labour costs (ULC)
Flags: na: not available.
Note: Figures highlighted are the ones falling outside the threshold established by EC Alert Mechanism Report. For REER and ULC, the second threshold concerns non-Euro Area Member States. (1) Figures in italic are according to the old standards (ESA95/BPM5). (2) Export market shares data: the total world export is based on the 5th edition of the Balance of Payments Manual (BPM5). (3) Unemployment rate: i=Eurostat backcalculation to include Population Census 2011 results.
2.1. EXTERNAL SUSTAINABILITY
Although the current and capital accounts have repeatedly recorded historically high surpluses, the stock of net external liabilities at above -80% of GDP continues to be in risky territory. The rapid decrease in the Net International Investment Position since 2009 has led to a notable correction in the severity of the related risks. The robust net lending position of around +8% of GDP in both 2013 and 2014 was supported by all external balance components, including the recently improving export performance. The drivers of this development and its durability are analysed in more detail in this section. Finally, a short discussion is warranted on the recent slowdown in foreign direct investment inflows, as the composition of debt-creating and non-debt creating elements on the financing side has important economic implications.Adjustment in external indebtedness
Since peaking at -116% of GDP in 2009, the overall improvement in the Net International Investment Position has been above 30 percentage points, reflecting the increasing current and capital account surpluses. The degree of the adjustment in the external balances reflects a level of rebalancing similar to that seen in the vulnerable euro area countries. At the same time, Hungary’s regional peers (Visegrád countries) typically recorded improvements of much smaller magnitude (a couple of percentage points) over the last five years, their net lending positions are still being in deficit or showing a small surplus. Nevertheless, the significant reduction in external imbalances had up until 2012 been mainly driven by the compression of imports. The country’s export performance clearly underperformed that of its regional peers, as demonstrated by the large accumulated losses in export market shares (see the detailed comparative analysis in the 2014 In-Depth Review). From a sectoral point of view, some two-thirds of the total change is attributable to the financial sector, and the remaining one-third to the private sector, with both the household and corporate sectors increasing their savings rates (while the net position of the central bank and the general government remained broadly unchanged).
The rapid improvement in the Net International Investment Position has continued in 2013 by some 10 pps to -84% of GDP on account of
declining external debt. Net external debt has declined from close to 70% of GDP in 2012 to
around 58% by end-2013. The recent
improvements came in spite of some negative effects from valuation changes in both 2012 and 2013, when the exchange rate remained relatively stable. This may turn out to be an even more important factor as the recent waves of forint depreciation may suggest a risk of prolonged weakness with the national currency. The stabilisation of this robust net lending position seen in recent quarters occurred despite a substantial pick-up in investment (which grew at 16.8% year-on-year in the first half of 2014). This suggests that the external balance surplus is also a result of improving export performance.
Graph 2.1.1: Components of Net International Investment Position -200 -150 -100 -50 0 50 97 98 99 00 01 02 03 04 05 06 07 08 09 10 11 12 1314* % o f GD P
Net portfolio investment, equity and investment fund shares/units Net portfolio investment, debt securities
Other investment (net) Net direct investment
Net financial derivatives and employee stock options Net external debt (neg. sign)
Net Int'l investment position (NIIP)
Marketable debt (portfolio debt instr. and other investment, net)
(1) Reserve assets excluded, * indicates estimated figure using quarterly data
Source: European Commission
Based on current information, the Net International Investment Position is anticipated to improve further markedly in the coming period. By mid-2014, it declined further to around 82% of GDP. Regarding 2015 and 2016, the surplus projections for both the current and capital accounts contained in the Commission’s 2015 winter forecast, ceteris paribus, would imply a further steep reduction in the Net International Investment Position to below 70% of GDP by the
end of 2016. (1) Looking further ahead, the illustrative medium-term scenarios modelled by the Commission show that Hungary would need to achieve a current account surplus of only 1.5% of GDP on average over the next 10 years in order to halve its negative Net International Investment Position by 2024 (to around -42% of GDP). Based on the government plans regarding the potential EU structural fund inflows in the present and forthcoming multiannual financial frameworks, the capital account could plausibly be projected to show a surplus in the magnitude of at least 2% of GDP in the coming decade. Taking into account this additional positive factor, the current account could be in a slight deficit of around 0.5% of GDP, yet the Net International Investment Position ratio could still be halved.
All components of the current account have generally been constantly improving since 2008, leading to a historically high surplus of slightly over 4% of GDP in 2013. Both the goods and services sub-balances have recorded significant surpluses, the former despite the fact that Hungary repeatedly had one of the highest trade deficits of energy products in the EU (consistently more negative than –6% of GDP over recent years). In addition, the structurally high primary income deficit (reflecting the accumulated large foreign direct investment stock) has been progressively curbed throughout the recent period. While the balance of factor incomes registered massive deficits of more than 6% of GDP prior to the crisis, more recently, it has been on a downward path falling to below -3% of GDP. This is chiefly due to the remittances of the rapidly increasing number of Hungarian frontier workers. (2) In addition, the
(1) Moreover, the conversion of households’ foreign exchange mortgage loans into forints may further reduce the gross external debt figures through banks’ balance sheet adjustment. At the same time, as credit institutions have predominantly obtained the necessary foreign exchange funds through the central bank’s liquidity instruments, net external debt will not be affected by the conversion (i.e. the decline in gross external debt entails a decrease in international reserves).
(2) In September 2014, the Central Statistical Office introduced important methodological changes (more appropriate data sources for both the headcounts and the wages) for the calculation of compensation of employees, which overall led to a very significant revision of past data: most notably, the 2013 income balance was improved by 1.4% of GDP. As a consequence, this sub-item’s net surplus more than tripled within a short time-period: from 0.6% of GDP in 2010 to 2.1% of GDP in 2013. See for
recent decreases in debt service payments (reflecting the fall in both interest rates and external indebtedness) also lowered the deficit.
Graph 2.1.2: Components of the external position (current and capital accounts)
-20 -15 -10 -5 0 5 10 15 97 98 99 00 01 02 03 04 05 06 07 08 09 10 11 12 13 14* % o f GD P
Capital account (KA) Secondary income balance Primary income balance Trade balance - services Trade balance - goods Trade balance
Current account balance (CA) Net lending/borrowing (CA+KA)
* indicates estimated figure using quarterly data. Source: European Commission
Financial flows from the EU made an increasing contribution to the current account surpluses as well as to improvements in the net external financing capacity. Current EU transfers (primarily direct agricultural payments) improved the current account by close to 2% of GDP in recent years, while EU structural fund flows financing predominantly investment activities (registered in the capital account) followed a constant increase after the EU entry in 2004 to the magnitude of 2% of GDP in 2010 and rising further to over 3.5% of GDP in 2013. The recently observed levels of EU inflows are expected to be at least maintained in 2015, with some scheduled declines in subsequent years. Overall, financial relations with the EU progressively contributed to the increase in the country’s net lending.
Despite the recent large adjustments, the negative Net International Investment Position and the associated relatively high rollover needs continue to represent a source of vulnerability
further details Central Statistical Office (2014), National accounts of Hungary, 2013 (preliminary data).
for the economy. Looking forward, sustainability calculations suggest there will be further significant improvements, even if the size of EU fund inflows will be moderating. Nevertheless, the country is still facing considerable external rollover needs (close to a yearly 25% of GDP), which underlines the importance of maintaining the confidence of foreign investors.
Drivers of trade performance
Following the uninterrupted fall in export market shares between 2009 and 2012, the deterioration was broadly halted in 2013. The five-year loss in export market shares experienced by Hungary (-19.2% in 2013) was much more substantial than that of its regional peers (Czech Republic: -7.7%, Poland: -0.4%; Slovakia: -2.2%), while other new Member States (Baltic countries, Bulgaria, and Romania) have all recorded positive figures, often large increases). The moderate turnaround (year-on-year growth of 4.1% in 2013) in the export market share has chiefly been driven by increased production capacity in the automobile industry, which, according to the companies’ reports, could have added to exports 2 to 4 percentage points in recent years. Based on the Commission’s 2015 winter forecast, the export market share is expected to continue improving over the period to 2016.
The loss of export market shares occurred despite slightly improving cost competitiveness since the crisis. Growth in nominal unit labour costs remained under control. Despite a 19% hike in the minimum wage in January 2012 with some spill-over effects on the whole wage structure, the year-on-year unit labour costs growth was limited to 3.5%). The adjustment in the real effective exchange rate had originally been driven by the nominal depreciation of the forint and was subsequently supported by successive moderate declines in real compensation per employee. Indeed, based on updated estimates using the Commission's fundamental exchange rate equilibrium method (3), the real effective exchange rate for 2012 appeared to be somewhat
(3) For methodological details, see Salto, Matteo – Alessandro Turrini (2010), Comparing alternative methodologies for real exchange rate assessment, European Economy Economic Papers No. 427.
undervalued (by roughly 3.7-5.6%). In this context, it is worth highlighting that the expected positive effects of the real effective exchange rate depreciation are likely to have been attenuated by a number of factors. First, given the high volume of foreign currency debt in the corporate sector (4), improvements in price competitiveness could well have been offset by a deterioration in firms’ balance sheet position. Second, the import share of Hungarian exports is traditionally one of the highest in the EU (hovering around 45% over the last 15 years (5)), implying that the impact of the exchange rate on exports is proportionally limited.
Graph 2.1.3: Evolution of Hungary's export market share (year-on-year) -15 -10 -5 0 5 10 15 20 97 98 99 00 01 02 03 04 05 06 07 08 09 10 11 12 13 R a te o f c h a n g e y -o -y ( % )
Contribution to EMS: goods Contribution to EMS: services Export market share growth yoy
Source: European Commission
The large cumulative losses in export market shares could therefore be attributed to deteriorating non-cost competitiveness factors. The traditional resilience of the Hungarian export sector has to a large extent been predicated on the
(4) Before the outbreak of the crisis, some 55% of all corporate domestic loans were denominated in foreign currency, out of which up to two-thirds were unhedged, suggesting a significant degree of currency mismatch in the economy. (5) The Hungarian central bank published various estimates for
the import content, and based on 2008 data, it arrived at an even higher ratio of 56% (Bodnár, Katalin, György Molnár, Gábor Pellényi, Lajos Szabó, Judit Várhegyi (2013), Dynamics of the trade balance and developments in exports and imports, MNB Bulletin, Special October issue, pp. 37-45.). The central bank study found that the local value added content was particularly low for electronic and optical products as well as for vehicles (most notably for the automotive industry).
very significant share of high-technology goods. Its share in total exports was hovering over 20% over the decade 2000-10, but has started to gradually decline since 2009 and reached around 16% in 2013. This is still the highest ratio among new Member States, but nevertheless represents some quality shift in the export structure. Furthermore, Vandenbussche (2014) (6) found in an empirical study that Hungary displays a ‘bimodal’ quality distribution in the structure of its export products. This specialisation pattern is characterised by two peaks in the distribution: one in low, and one in the high quality products, with relatively few goods in the middle field. Low quality products are increasingly facing tough price competition from emerging markets, in particular from China. The study referred to above also found that quality upgrades between 2007 and 2011 showed an overall slow dynamics in the Visegrád countries (including Hungary, unlike in the Baltic states for example), which left a considerable part of their exports exposed to cost competition.
Looking ahead, the durability of the record high trade surpluses in the medium term may not be guaranteed. Starting from a level slightly above zero prior to the crisis, the trade surplus had surged to close to 8% of GDP by 2013. Concerning the overall values, service exports are much lower (some one-fifth) than the country’s exports of goods, but the two factors’ respective contributions to the increased surplus were broadly even in recent years. The question that naturally arises is to what extent the adjustment could be considered permanent, or at what level the trade balance will be when the temporary factors (such as the subdued domestic demand) peter out. In this context, it is worth recalling that according to the calculations by Halpern-Oblath (2014) (7), based on Hungary’s trade openness, its relative economic development (as measured by its GDP per capita in purchasing power parity terms) and the valuation of the local currency, the high surplus level in 2013 cannot be explained by the country’s fundamentals. At the same time, some recent factors may delay the expected moderation of the
(6) Vandenbussche, Hylke (2014), Quality in Exports, European Economy Economic Papers. No. 528.
(7) Halpern, László – Gábor Oblath (2014), The “bright” and gloomy side of economic stagnation, Economic Review, Vol. 61. No. 7-8. pp. 757-800.
trade surplus. First, Hungary is set to enjoy a sizeable terms-of-trade improvement due to the substantial fall in the oil price. Second, some of the recent large-scale investments in the automotive industry are still in the maturation phase, and industrial production and exports will therefore further boosted in 2015 and potentially even in 2016.
Recent investment trends may suggest some deterioration in the services trade balance in the coming period. The investment-to-GDP ratio has stayed below 20% in the 2011-2013 period, compared to its level of 23%-24% seen prior to the crisis. This being said, the 2014 surge in investment as projected in the Commission’s forecast should correct some of this erosion. In parallel to this overall decline, there was a significant change in the composition of investment activity over the last five years: the relative share of manufacturing and public investments increased, largely at the expense of real estate activities, but the share of market services also declined (e.g. wholesale and retail trade, transportation and storage, accommodation, information and communication). Given the significant role played by these internationally ‘tradable services’ in recent trade surpluses, the continuation of these trends may impact the country’s external lending position both directly (through reduced trade in services) and indirectly (through a smaller net balance of tourism).
Despite Hungary’s recent high trade surpluses, and the improved cost competitiveness, the turnaround in its export performance is not yet
ensured. Further integration of domestic
companies into global supply chains would be conducive to increasing the domestic value-added as well as potentially making more resilient the product structure of exports. In previous years, repeated interventions by the government in the functioning of certain service sectors, typically by increasing restrictions to entry, and the unpredictability of these actions have led to greater uncertainty for investors.
Foreign direct investments
The continued sluggishness of foreign direct investments in Hungary is a source of concern. Attracting foreign direct investment has traditionally been treated as an important means of
structural upgrading, technology transfer and productivity growth in the new Member States. For the Central and Eastern European region, annual net foreign direct investment flows are considerably smaller than prior to the crisis, reflecting a wider European trend. Nonetheless, the decrease appears to be slightly more pronounced in Hungary than for other new Member States, in particular over recent quarters (see Graph 2.1.4, which shows statistics including special purpose entities as these are the internationally comparable data).
Graph 2.1.4: Net foreign direct investment in the region (% of GDP) -2 0 2 4 6 8 10 12 04 05 06 07 08 09 10 11 12 13 Czech Republic Hungary Poland
Baltics weighted average %
Source: European Commission Calculation
Annual net foreign direct investment flows (8) have been on generally decreasing trend since Hungary’s accession to the EU ten years ago. Numerous one-off factors have featured over recent years, which could substantially distort the assessment of foreign direct investment. Specifically, it may be worth filtering out two factors to better capture the ‘genuine’ foreign direct investment transactions by non-resident corporations: (i) the continuous wave of capital injections by parent banks to offset the capital shortfall resulting from losses in their Hungarian subsidiaries (see also the discussion in section 2.3); (ii) large-scale corporate acquisitions by the state
(8) When analysing trends in foreign direct investments, it is worth focusing on net transactions, as the gross capital flows are heavily affected by the increasing weight of capital flowing through Hungary (capital in transit).
(2011: MOL, 2013: E.On). MNB (9) estimated the underlying trend (adjusted for the above-mentioned significant one-off impacts) in net foreign direct investment flows at an annual average of around EUR 0.5-1 billion between 2010 and 2013. An important explanatory factor for the low average is the decrease in reinvested earnings: in a subsequent central bank report (10), the average ratio for reinvested profits was reported to be ca. 40% prior to the crisis, while the corresponding average for the 2009-13 period is less than 20%. On a positive note, while in 2009-10, dividend payments even exceeded total profits of foreign-owned firms (as presumably many parent companies used the retained earnings of subsidiaries to tackle their liquidity needs), the situation has been improving since 2011.
Graph 2.1.5: Foreign direct investment flows in Hungary (% of GDP) -2 0 2 4 6 8 10 12 04 05 06 07 08 09 10 11 12 13
FDI assets FDI liabilities FDI net
(1) The data series are excluding SPEs Source: MNB
Statistics focusing on greenfield foreign direct
investment investments also suggest a
deteriorating attractiveness. Total foreign direct investment inflows as reported in the balance-of-payment statistics may overestimate the related boosting effects as flows corresponding to the acquisition of existing facilities are also included.
(9) MNB (2014a), Developments in Foreign Direct Investment in Hungary after the crisis, In: Report on the Balance of Payments – July, pp. 23-31.
(10) MNB (2014b), Corporate incomes, In: Report on the Balance of Payments – September, pp. 24-33.
It is therefore useful to analyse a dataset showing only greenfield investments, i.e. only those projects where a company establishes or expands its manufacturing base, service function, or extraction operation. This is important as greenfield projects, by definition, increase the host country’s production capacity, thereby exerting a positive impact on economic growth, whereas this is not necessarily the case for mergers and acquisitions. Greenfield foreign direct investments show a clear deceleration in the aftermath of the crisis (see Graph 2.1.6), which is reflected in their decreasing role in private sector employment creation: while between 2004 and 2007, they accounted for at least 40 000 new jobs each year, this decreased to around 10 000 recently.
Graph 2.1.6: Greenfield foreign direct investment inflows into Hungary (2003-2014) 3.5 2.3 4.0 3.1 2.4 2.0 1.8 3.5 1.2 1.1 1.3 0.3 3.1 3.2 4.3 5.7 7.5 7.1 2.1 4.0 2.0 1.3 0.8 1.1 0 2 4 6 8 10 12 03 04 05 06 07 08 09 10 11 12 13 14*
Total extra-EU inflows Total intra-EU inflows $bn
(1) Data for 2014 covers the January - August period. Source: Financial Times FDImarkets database
The underlying foreign direct investment flows have recently even recorded negative figures. The last available reading for the net foreign direct investment figure between Q4-2013 – Q3-2014 is EUR 0.5 billion, but if parent bank recapitalisations are deducted, the resulting figure is some EUR -1 billion. Furthermore, the observed outflow from non-financial corporations is not concentrated, but spread across a wide range of industries, including machinery, trade and communications. The recently concluded series of
strategic partnership agreements (11) do not appear to have been able to reverse the negative trend.
The slowdown observed in net foreign direct
investment flows, including greenfield
investments, in particular over recent quarters, may be linked to a number of measures with potential detrimental impacts on the business environment. Specifically, the introduction of new barriers in previously open markets and the increased reliance on sector-specific taxation might have detracted from the overall attractiveness of the Hungarian economy. Moreover, the regulatory framework suffers from the lack of both systematic stakeholder consultations and evidence-based impact assessments (see the discussion on business environment in section 3.4). Accordingly, among the Visegrád countries, OECD Product Market Regulation indicators show Hungary as having the highest legal barriers to entry. In addition, recent international competitiveness surveys (e.g. World Economic Forum) rank the country as having the least transparent policy-making in its Visegrád peer group.
(11) The government concluded some 50 strategic partnership agreements between mid-2012 and end-2014. According to Transparency International Hungary (Lifting the Lid on Lobbying. Strategic Partnership Agreements in an Uncertain Business Environment. National Report, 2014), the companies in question represent slightly more than 8% of private sector headcount, but they account for ca. 35% of total exports. Moreover, there is a notable concentration in the sectors openly preferred by the government: the companies chosen for such agreements cover approximately 90% of employment in the pharmaceutical sector, 37% in automotive industries and 47% in electronic and electrical industries.
2.2. GOVERNMENT DEBT SUSTAINABILITY
At somewhat below 80% of GDP, Hungary'sgeneral government debt is an important remaining vulnerability of the economy. Hungary's public debt is below the EU average, but is significantly higher than that of its regional peers (12) and exceeds the level which would be in line with the country's economic development (13). Although decreasing, Hungary's short-term sovereign financing needs are still among the highest within the group of emerging and middle income economies. The strong dependency on external sources is a further factor contributing to the high exposure of the economy to risks related to government debt. After reviewing the origins of high public indebtedness, this section examines the prospects for reducing government debt. The surplus of the primary government balance (maintained since 2012) ensures a precondition for debt-reduction and the required further improvement could be facilitated by expected savings is age-related costs. The country's low growth potential, however, could hamper the decline of government debt and remains a source of fragility. Moreover, foreseeable budgetary risks may prevent the improvement of the primary balance. The impacts of these driving forces and risk factors are assessed on the basis medium-term debt projections.
Historic developments and short-term outlook for government debt
The current high level of Hungary's
government debt is the result of lax fiscal policies in the last decade exacerbated by the impact of the subsequent financial and economic crisis. Hungary saw a rapid increase in its government debt ratio during the last decade. From a level of 51.9% in 2001, it rose by almost 30 pps., to reach around 81% over ten years (see Graph 2.2.1). In the pre-crisis years, this was driven by accumulating primary deficits (which reached an annual average of 3½% of GDP
(12) Hungary's government debt ratio stood at 77.3% of GDP in 2013, whilst the average of the debt ratios of the other three Visegrád countries was only 52%.
(13) By regressing the debt ratio on per capita income, which could be seen as an indicator of a nation's wealth, Hungary's government debt is found to be around a third higher than would be expected at a similar income position. See also Hungarian central bank (MNB) (2013), Projection on the evolution of government deficit and debt (in Hungarian).
between 2002 and 2007; see Graph 2.2.2). At the same time, both the "snowball" effect (14) and stock-flow adjustments overall were able to contain the dynamics of rising public indebtedness thanks to a relatively high growth and the still significant receipts from privatisation. The outbreak of the financial crisis brought a turnaround in this situation. The primary deficit was practically eliminated as a result of fiscal consolidation efforts, including measures implemented under the EU-IMF financial assistance programme for Hungary. But the fall in output generated a large debt-increasing effect. Moreover, stock-flow adjustments made a contribution of a similar magnitude to the rising debt levels. This occurred mainly because of a sharp increase in state cash deposits (15), but also as a consequence of the depreciation of the forint.
(14) The snowball effect measures the annual change in the debt-to-GDP ratio, which is produced by the difference between the implicit nominal interest rate and nominal growth. The magnitude of the effect is proportional to the previous year's debt ratio.
(15) While there was a temporary increase in the level of cash deposits due to the frontloaded nature of the EU-IMF financial assistance loan, government deposits have remained considerably higher since the crisis (i.e. around 5.5% of GDP on average compared with the pre-crisis levels of around 2.5%). This reflects the higher liquidity needs of government financing when market conditions are more volatile.