Lingfen Sun
, Member, IEEE
, and Emmanuel C. Ifeachor
, Member, IEEE
Abstract—The primary aim of this paper is to present new models for objective, nonintrusive, prediction of voice quality for IP networks and to illustrate their application to voice quality monitoring and playout buffer control in VoIP networks. The contributions of the paper are threefold. First, we present a new methodology for developing perceptually accurate models for nonintrusive prediction of voice quality which avoids time-consuming subjective tests. The methodology is generic and as such it has wide applicability in multimedia applications. Second, based on the new methodology, we present efficient regression models for predicting conversational voice quality nonintrusively for four modern codecs (G.729, G.723.1, AMR and iLBC). Third, we illustrate the usefulness of the models in two main applica-tions—voice quality prediction for real Internet VoIP traces and perceived quality-driven playout buffer optimization. For voice quality prediction, the results show that the models have accuracy close to the combined ITU PESQ/E-model method using real In-ternet traces (correlation coefficient over 0.98). For playout buffer optimization, the proposed buffer algorithm provides an optimum voice quality when compared to five other buffer algorithms for all the traces considered.
Index Terms—Conversational speech quality, E-model, jitter buffer optimization, nonintrusive, perceptual evaluation of speech quality (PESQ), regression model, voice over IP, voice quality prediction.
I. INTRODUCTION
I
P NETWORKS are on a steep slope of innovation that will make them the long-term carrier of all types of traffic, in-cluding voice. However, such networks are not designed to sup-port real-time voice communication because of their variable characteristics (e.g., due to delay, delay variation and packet loss) which lead to a deterioration in voice quality [1], [2]. A major challenge in such networks is how to measure or predict voice quality accurately and efficiently for Quality-of-Service (QoS) monitoring and/or control purposes to meet technical/ commercial requirements (e.g., service level agreements).Voice quality measurement can be carried out using either subjective or objective methods. The Mean Opinion Score ( ) is the most widely used subjective measure of voice quality and is recommended by the ITU [3]. A value is normally obtained as an average opinion of quality based
Manuscript received May 16, 2005; revised October 20, 2005. The work is supported in part by an EU grant under the Sixth Framework Programme (BIOPATTERN Project 508803) and by Acterna. The associate editor coordi-nating the review of this manuscript and approving it for publication was Dr. Anna Hac.
The authors are with the School of Computing, Communications and Elec-tronics, University of Plymouth, Plymouth PL4 8AA, U.K. (e-mail: L.Sun@ plymouth.ac.uk; E.Ifeachor@plymouth.ac.uk).
Digital Object Identifier 10.1109/TMM.2006.876279
on asking people to grade the quality of speech signals on a five-point scale (Excellent, Good, Fair, Poor, and Bad) under controlled conditions as set out in the ITU-T standard P.800 [3]. The subjective test can be listening only (i.e., one way) or con-versational (i.e., it involves interactivity). In the later case, the voice quality scores are sometimes referred to as conversational (i.e., ). In this paper, we use the term to represent conversational voice quality. In voice communication systems, is the internationally accepted metric as it pro-vides a direct link to voice quality as perceived by the end user. The inherent problem in subjective measurement is that it is time consuming, expensive, lack repeatability, and cannot be used for long-term or large scale voice quality monitoring in an operational network infrastructure. This has made objective methods very attractive for meeting the demands for voice quality measurement in communications networks.
Objective measurement of voice quality can be intrusive or nonintrusive. Intrusive methods are more accurate, but normally are unsuitable for monitoring live traffic because of the need for a reference data and to utilize the network. The ITU-T P.862 Perceptual Evaluation of Speech Quality (PESQ) [4]–[6], is the most commonly used intrusive measurement method for voice quality in current VoIP applications. It is designed for listening voice quality measurement and involves a comparison of a de-graded speech signal to a reference speech signal to predict the
value.
Nonintrusive techniques do not need a reference signal and can be used to monitor/predict voice quality directly either from the network and other relevant system parameters (e.g., packet loss, delay, jitter and codec) or from the degraded voice signal itself. The ITU-T E-model [7], [8] is a computational model that can be used to predict voice quality nonintrusively and directly from the network and other system parameters. ITU-T P.563 [9], on the other hand, can be used to estimate score from analysis of the degraded voice signal. In this paper, we focus on nonintrusive prediction of voice quality directly from network and other system parameters.
Although the ITU E-model is the most attractive and com-monly used nonintrusive method for voice quality prediction for VoIP applications [10]–[12], the current E-model is appli-cable to a restricted number of codecs and network conditions (because subjective tests are required to derive model param-eters [13]) and this hinders its use in new and emerging ap-plications. To address this, experimental methods for deriving the model parameters objectively have been proposed [14], but this is limited to a consideration of only the effects of codecs. Further more, the E-model is based on a complex set of fixed and empirical formulae which is not efficient for real-time
neural networks-based models can only predict one-way lis-tening voice quality [15], [18]. There is a need for an efficient, nonintrusive voice quality prediction model for technical and commercial reasons for voice over IP networks. The model should predict conversational voice quality to account for in-teractivity.
There is a large number of applications for nonintrusive voice quality prediction models. The most direct application is to monitor/predict voice quality from network and other system parameters for live VoIP calls [11]. This is essential for network operators to monitor the health of the network and for service providers to make sure that service agreements are met. Other more challenging applications are for end-to-end, perceived quality-driven QoS optimization and control, such as playout buffer control and codec sender-bit-rate control [19] (see later for more details). The idea in these applications is to move away from the use of individual network parameters, such as packet loss or delay, to control performance. Instead, to move towards perceptual-based, voice quality control in order to achieve the best possible end-to-end voice quality.
The main contributions of the paper are threefold.
1) A new methodology for developing models for non-intrusive prediction of voice quality is proposed. The resulting models provide an objective and perceptually accurate prediction of both listening and conversational voice quality, nonintrusively. This avoids time-consuming subjective tests. The method is generic and as such has wide applicability in multimedia applications.
2) Development of new and efficient models, based on the new methodology, to predict conversational voice quality nonintrusively for four modern codecs (i.e., G.729, G.723.1, AMR, and iLBC). This illustrates how to readily extend the ITU E-model to new codecs and new network conditions whilst avoiding time-consuming subjective tests and the use of a set of complex equations as in the current E-model.
3) An illustration of the use of the new models in two impor-tant applications: voice quality monitoring and prediction using real Internet VoIP traces and perceived quality-driven playout buffer optimization.
The remainder of the paper is structured as follows. In Section II, the novel methodology for nonintrusive prediction of voice quality is introduced, together with the combined PESQ/E-model structure that is used to predict conversational voice quality. In Section III, the development of the regression models for the AMR codec and other codecs are described. Two applications of the new models in voice quality moni-toring/prediction and playout buffer optimization are presented in Section IV. Section V concludes the paper.
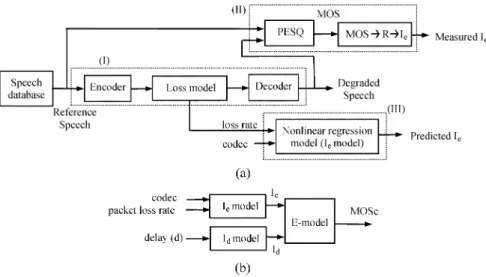
Fig. 1. Conceptual diagram of the new scheme for nonintrusive prediction of voice quality.
II. NEWMETHODOLOGY FORNONINTRUSIVE
VOICEQUALITYPREDICTION
A. Introduction to New Methodology
Fig. 1 depicts a simplified, conceptual diagram of the pro-posed novel methodology for developing and using new models for nonintrusive prediction of voice quality in IP networks. The lower part of the figure illustrates how a new model would be used to predict end-to-end, conversational voice quality, non-intrusively, from network and other system parameters (e.g., packet loss, delay and codec type). In practice, IP packets trans-porting voice data through the network would be captured at a monitoring point which may be at any suitable location (e.g., at a gateway). Network and other relevant system parameters (e.g., delay, packet loss, jitter and codec type) are then extracted from analysis of the headers (e.g., RTP headers). The parameters are then applied to the new model to provide a prediction of voice quality.
The top part of the figure (enclosed in dotted lines) shows how to obtain an objective measure of conversational voice quality using a combined ITU PESQ and E-model structure (see later for more detail). This is an important part of the methodology because it allows us to generate appropriate data for deriving new nonintrusive voice quality prediction models.
In the figure, (PESQ) refers to the listening-only mean opinion score obtained from PESQ algorithm by comparing the reference and the degraded speech. Measured refers to the measured conversational voice quality obtained by com-bining (PESQ) value and the end-to-end delay (see Sec-tion III for details). Predicted is the predicted conversa-tional voice quality by using the proposed new model.
In this paper, we will focus on the development of efficient regression models for conversational voice quality prediction for different codecs. The advantage of regression models is that they are efficient, straightforward and can be easily used in voice quality monitoring/prediction and perceived quality-driven QoS control (e.g., jitter buffer control and adaptive sender bit rate control).
The benefits of the new methodology for nonintrusive appli-cations include that
— It is generic and based on end-to-end, intrusive measure-ment of voice quality (in this case, using PESQ). Thus, it can be easily applied to other applications, such as audio
Fig. 2. Measurement of conversational voice quality using a combined PESQ and E-model.
(e.g., using ITU-T Perceptual Evaluation of Audio Quality (PEAQ) [20]), image (e.g., using a universal image quality index [21]) and video (e.g., using Video Quality Metric (VQM) [22]). For audio, image and video quality predic-tion, extra parameters will need to be taken into account. For example, for video quality prediction, parameters such as source bit rate, encoded frame type, and frame rate from the source should also be considered [17].
— It avoids expensive and time-consuming subjective tests. — It can be easily applied to new voice codecs [4], new packet
loss conditions (e.g., new packet loss burst patterns) or different speakers/languages.
B. Measurement of Conversational Voice Quality
Fig. 2 illustrates how a measure of conversational voice quality is obtained using a combined PESQ/E-model structure. PESQ is an accurate and reliable method for voice quality measurement, but it is an intrusive method and can only predict one-way listening-only voice quality. It does not consider the impact of end-to-end delay which is important for interactivity in voice communications. The approach in Fig. 2 exploits the accuracy of PESQ and the delay model of the E-model.
As shown in the figure, an estimate of the (PESQ) score is obtained directly from the PESQ algorithm by com-paring the reference and the degraded speech. The is converted to a rating factor (the R factor) [7] and then to an equipment impairment value . The is obtained by combining the value and the effects of end-to-end delay (the value). The detailed procedure to derive is as follows:
1) Convert Voice Quality From (PESQ) to : The ITU-T G.107 [7] defines the relationship between the factor and as in (1).
for for for
(1) This is a general relationship between factor and score. Depending on whether delay is considered, here can be referred as listening-only voice quality or con-versational voice quality .
The conversion from to value can be conducted by a complicated Candono’s Formula as in [23] or by a simplified 3rd-order polynomial fitting [24] as shown in (2).
(2) For (PESQ) which is a listening-only voice quality, the converted R factor does not consider delay impairment ( value). If we consider only the equipment impairment ( value,
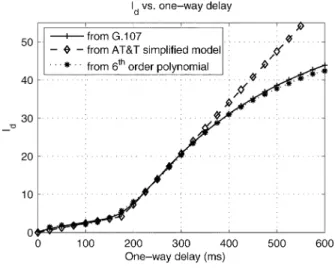
Fig. 3. I versus delay.
which is the impairment from packet loss and codec), can be converted to as in (3).
(3) The default value for is 93.2 [7].
2) Obtain From One-Way Delay, : The delay impair-ment factor, , represents all impairments due to delay of voice signals and includes impairments due to Listener Echo, Talker Echo, and Absolute delay. Assuming a perfect echo cancella-tion, can be calculated by a series of complex equations in ITU G.107 [7]. The derived curve of vs one way delay is shown in Fig. 3 (the curve labelled G.107). can also be cal-culated using a simplified version of (4) as provided in [11] (the curve labelled AT&T simplified model in Fig. 3).
if
if (4)
We note that the simplified model [11] is only accurate (close to the curve from G.107) for delay less than 400 ms (see Fig. 3). When delay is over 400 ms, the curve from the simplified model deviates from the curve for G.107. Considering a more accurate fit to the curve for G.107 when delay is over 400 ms, a 6th order polynomial function is derived as shown in (5) for delay less than 600 ms (majority of end-to-end delay for VoIP links is less than 600 ms). The curve from polynomial fitting is also shown in Fig. 3 (the curve labelled 6th order polynomial).
Fig. 4. Scheme I: System structure for voice quality prediction based onI regression model.
Fig. 5. Scheme II: System structure for voice quality prediction based onMOSregression model.
3) Obtain From and : Having obtained and , the E-model factor can be calculated as
(6) This value considers the impairment from packet loss (codec dependent) and delay. If we convert to using (1), the obtained is for conversational voice quality which can be represented as . Overall, the Measured in Fig. 1 can be obtained from (PESQ) and end-to-end delay.
III. NONLINEAR REGRESSIONMODELS FOR
VOICEQUALITYPREDICTION
A. System Structure of Regression-Based Models
Two schemes are proposed for developing regression-based models for voice quality prediction in VoIP applications. Scheme I, shown in Fig. 4(a), consists of three parts (as indi-cated by dotted lines): (I) a VoIP simulation system to simulate a VoIP flow, which includes encoder, packet loss simulator and decoder; (II) a voice quality prediction module based on PESQ/E-model to obtain a measure of the Measured , and (III) a nonlinear regression model to generate the Predicted from packet loss rate and codec type. The Predicted (Measured)
is then obtained by combining the Predicted (Mea-sured) with from end-to-end delay as shown in Fig. 4(b).
Scheme 2, shown in Fig. 5, also consists of three parts (en-closed in dotted lines). Instead of predicting equipment impair-ment as in Scheme I, it predicts conversational voice quality from packet loss rate, delay and codec directly using a nonlinear regression model. The Measured is calcu-lated using a combined structure of PESQ and E-model. The Predicted is obtained by using the developed regression model.
For each of Schemes I and II, we derive the regression models for four modern codecs (i.e., G.729 (8 Kb/s), G.723.1 (6.3 Kb/s), AMR (the highest mode, 12.2 Kb/s and the lowest, 4.75 Kb/s) and iLBC (15.2 Kb/s)). The reference speech is taken from the ITU-T data set [25]. Packet loss is generated from 0% to 30%, in an incremental step of 3% and Bernoulli loss model is used for simplicity. PESQ-LQ (Listening Quality) [26], and PESQ-LQO from ITU P.862.1 [27], the two latest variants of PESQ are also included for comparison.
B. Procedures for Developing Regression-Based Models
As an illustration, we first derive the value for a new codec (AMR at the highest mode of 12.2 Kb/s) for VoIP applications using PESQ. model does not exist for AMR codec at present in the public domain. We further derive value directly from packet loss rate and delay based on Schemes I and II. The procedure is as follows:
Step 1: Obtain (PESQ) versus Packet Loss Rate for the AMR Codec: For each speech sample in the ITU-T data set
Fig. 6. MOS versus packet loss ratefor AMR codec.
for British English, a (PESQ) score is obtained by av-eraging over 30 different packet loss locations (via using dif-ferent random seed setting) in order to remove the influence of packet loss location. Further, the score for a packet loss rate is obtained by averaging over all speech samples (a total of 16 samples, consisting of eight males and eight females), so that the influence of gender is removed (we did not consider the gender issue for regression-based models for simplicity). The relationships between the average and packet loss rate for AMR codec are shown in Fig. 6 (curve for PESQ). The curves for PESQ-LQO and PESQ-LQ are converted from the curve for PESQ according to the mapping functions in [27] and [26], respectively.
Step 2: Convert versus Packet Loss Rate to versus Packet Loss Rate: The relationship between and packet loss rate in Fig. 6 can now be converted to the Equipment im-pairment [measured in Fig. 4(a)] versus packet loss rate via (2) and (3). The derived curves for versus packet loss rate are shown in Fig. 7 (the curves for PESQ/PESQ-LQO/ PESQ-LQ). A logarithm fitting function, similar to that in [11]), can be derived as (7) for PESQ, PESQ-LQO and PESQ-LQ by nonlinear least-squares data fitting. The fitting curves are also shown in Fig. 7 (shown as PESQ/PESQ-LQO/PESQ-LQ fit-ting). The goodness of the fit (e.g., value) are all above 0.996:
for PESQ for PESQ-LQO for PESQ-LQ
(7) Considering the wide applicability of PESQ, the PESQ value is used in the following derivation of the relationship of versus packet loss rate and delay. If PESQ-LQO or PESQ-LQ or other variants of PESQ need to be used, similar procedures can be followed.
Step 3: Calculate the for AMR Codec: Considering in (5) and in (7), the E-model’s factor can be obtained from (6).
The can be calculated from using (1) for a given random packet loss rate and end-to-end delay. The
Fig. 7. I versus packet loss ratefor AMR codec.
Fig. 8. MOScversus packet loss and delay for AMR 12.2 Kb/s.
versus packet loss rate and delay for AMR codec is shown in Fig. 8. It can be seen that the relationship of versus loss rate and delay are nonlinear.
Overall, by using the model for in (5) and the model for in (7) (for PESQ), voice quality can be predicted using the E-model as shown in Fig. 4(b) for Scheme I.
Step 4: Surface Fitting for Nonlinear Mapping From Packet Loss and Delay to : For Scheme II, a nonlinear regres-sion surface fitting can be performed to obtain the nonlinear function from packet loss, delay to as in Fig. 8 for a spec-ified codec. We tested with different polynomial and rational equations for the surface fitting and obtained the following poly-nomial equation with a reasonable fitting goodness:
(8) The error surface for fitting is depicted in Fig. 9. The absolute error is within 0.2 of scale. The Fit Standard Error is 0.053 and the is 0.9948.
Fig. 9. Error surface forMOScfitting for AMR (12.2 Kb/s).
Fig. 10 MOSversus packet loss rate.
C. Nonlinear Regression Models for Different Codecs
Following the above procedures, we have extended the nonlinear regression models to other codecs, i.e., AMR(L, 4.75 Kb/s), G.729 (8 Kb/s), G.723.1 (6.3 Kb/s) and iLBC (15.2 Kb/s) based on PESQ. The results for AMR(H, 12.2 Kb/s) is also included for comparison.
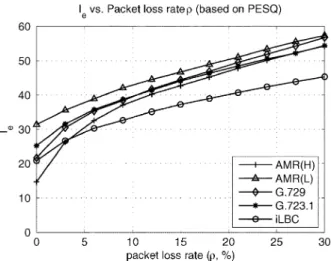
The relationships between the (PESQ) and packet loss rate for each of the four codecs are shown in Fig. 10. From the figure, it can be seen that iLBC gives the best voice quality when packet loss rate is high (over 4%). AMR (H, 12.2 Kb/s) has the highest score when packet loss rate is zero. AMR (L, 4.75 Kb/s) has the lowest quality regardless of loss rate.
The relationship between the versus packet loss rate in Fig. 10 can now be converted to the Equipment Impairment versus packet loss rate via (2) and (3). The derived curves for versus packet loss rate are shown in Fig. 11.
From Fig. 11, a nonlinear regression model can be derived for each codec by the least squares method and curve fitting. The derived model has the following form [11]:
(9)
Fig. 11. I versus packet loss rate. TABLE I
PARAMETERS OFREGRESSIONMODELS FORDIFFERENTCODECS(PESQ)
where is the packet loss rate in percentage. The parameters ( , and ) for different codecs are shown in Table I.
Based on the model, the predicted can be obtained by combining and as shown in Fig. 4(b) (for Scheme I). For Scheme II, the versus packet loss rate and delay for different codecs can be derived using the above procedures and are shown in Fig. 12(a)–(d). From the figures, it is clear that different nonlinear relationships between and network impairments exist for different codecs.
The surface fitting for different codecs can be obtained using a general polynomial equation as in (10), where represents packet loss rate ( in percentage) and end-to-end delay ( in ms). The parameters for fitting surfaces for different codecs and the Goodness of fit are listed in Table II. These equations can be directly used for monitoring/predicting voice quality from network parameters (e.g., packet loss and delay) or for QoS optimization and control purposes which will be discussed in detail in Section IV.
(10)
IV. APPLICATIONS OFMODELS
The voice quality prediction models can be applied in dif-ferent areas such as voice quality monitoring, optimization and control for VoIP applications. As illustrated in Fig. 13, typical applications include 1) monitoring/prediction of voice quality by obtaining score directly from the nonintrusive mea-surement models, 2) control of receive-side playout buffer to achieve optimum end-to-end voice quality, and 3) adaptive con-trol of send-side bit rate for optimum end-to-end voice quality.
Fig. 12. MOScversus packet loss and delay for different codecs: (a) for AMR (4.75 Kb/s); (b) for G.729; (c) for G.723.1; (d) for iLBC.
TABLE II
SURFACEFITTINGPARAMETERS FORDIFFERENTCODECS
In this paper, we focus on applications of the models on voice quality monitoring and jitter buffer optimization. Application of the model in adaptive sender bit rate control can be found in [19] and will not be detailed in this paper.
A. Perceived Voice Quality Prediction for VoIP
The first application of the new models is to monitor/pre-dict voice quality for VoIP in the current Internet. We apply the models to a series of VoIP trace data collected in 2002 between the U.K. and Germany, between the U.K. and the USA, and be-tween the U.K. and China.
Five traces from different links were selected for the study. The basic information of delay/jitter/loss for the selected traces with a duration of 30 min is listed in Table III. Delay is the av-erage network delay and jitter is calculated according to the def-inition in the IETF RFC 1889 [28]. The network packet loss rate and mean burst loss length for the selected traces are also listed in Table III. The Cumulative Distribution Function (CDF) for end-to-end delay for the five traces are shown in Fig. 14. Delay is normalized for comparison (shift to the minimum end-to-end delay).
From Table III and Fig. 14, it can be seen that the traces be-tween UoP (University of Plymouth, U.K.) and BUPT (Beijing University of Posts and Telecommunications, China) suffered large delay and delay variation with jitter value of over 16 ms. The trace from UoP to NCT (Nanchang Telecomm, China) had
Fig. 13. Three applications of the new models. TABLE III
BASICINFORMATION FORTRACEDATA#1TO#5
Fig. 14. Delay cumulative distribution function (CDF) for the five traces.
large delay but small jitter. The traces from UoP to CU (Co-lumbia University, USA) and from UoP to DUT (Darmstadt University of Technology, Germany) experienced low delay and delay variation with jitter value of less than 1 ms. Network packet loss rate varied from 0.3% to 14.3%. Further details of the trace data collection and trace data features/performances can be found in [24].
As the collected Internet VoIP trace data is for G.723.1 codec (30 ms packet interval) with packet size of one, the relation-ship between , packet loss rate (in percentage) and end-to-end delay can be obtained using Schemes I and II (see Section III).
For Scheme I:
(11)
For Scheme II:
(12) We apply (11) and (12) directly to the collected trace data. In order to verify the model, we also calculate the score using the combined PESQ/E-model structure. The detailed pro-cedure is given below.
For every 9 s trace data (9 s is chosen because it is within the recommended length for PESQ algorithm [4]), the actual packet loss rate (including late arrival loss) and actual end-to-end delay (including buffer delay) are calculated based on the adaptive playout buffer algorithm [29]. The av-erage actual delay for the 9 s trace data is also calculated and sent to delay model to get delay impairment . According to the actual packet loss patterns, the degraded speech is generated by G.723.1 codec and compared with the reference speech to obtain (PESQ) score (details see [29]). The conversa-tional voice quality is then derived from the (PESQ) and delay as described in Section II. This gives the Measured which is used to verify the performance of the regression models from Schemes I and II.
For Scheme I, the Predicted is first calculated from (11) ac-cording to actual packet loss rate . Then the Predicted can be obtained by combining the Predicted and according to Fig. 4(b). For Scheme II, the Predicted can be ob-tained from (12) directly based on the actual packet loss rate
and the actual delay .
Overall the predicted conversational voice quality (pre-dicted ) can be obtained from packet loss rate, codec type, packet size, and delay using regression models based on Schemes I and II.
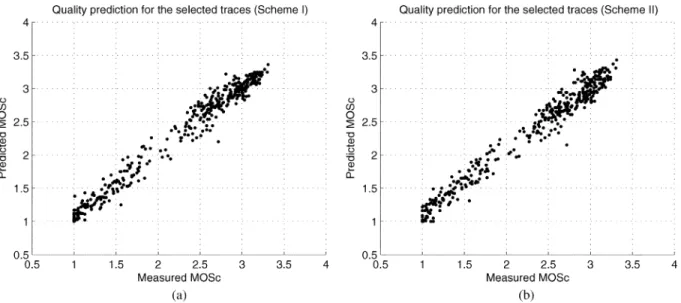
Fig. 15. PredictedMOScversus measuredMOScfor the selected trace data using regression models based on Schemes I and II.
There is a total of 396 samples generated from the selected trace data. The predicted is calculated using nonlinear regression models based on Schemes I and II, and the mea-sured is obtained by applying PESQ/E-model directly as shown in Section II. The scatter diagrams of the predicted versus the measured scores for the selected trace data for Schemes I and II are illustrated in Fig. 15(a) and (b), re-spectively. Results show that a correlation coefficient of 0.987 for Scheme I and a correlation coefficient of 0.985 for Scheme II are obtained. This demonstrates that the regression model works well for voice quality prediction for real Internet VoIP trace data. From the figures, it can also be seen that the predicted voice quality (predicted ) span a wide range, from lowest 1 (bad quality) to about 3.5 (good quality). It shows that some In-ternet links are ready for VoIP applications, but other links are not, as they provide very poor quality for a VoIP application.
B. Speech Quality Prediction for Buffer Optimization
The second application of the new models is for playout buffer optimization at the receiver side. The idea is to apply voice quality prediction model in designing perceived quality-driven playout buffer algorithms to achieve optimum end-to-end voice quality. Jitter buffer at the receiver side is used to com-pensate for the delay variation (jitter). It is a tradeoff between increased packet loss (packets that arrive too late will be dropped by buffer) and buffer delay (delay incurred in playout buffer).
In the past, the choice/design of buffer algorithms was largely based on buffer delay and loss performance (e.g., a design ob-jective could be to achieve a minimum average end-to-end delay for a specified packet loss rate [30]–[33] or minimum late arrival loss [30]). This approach is inappropriate as it does not provide a direct link to perceived voice quality. From QoS perspective, the choice of the best buffer algorithm for a given situation should be determined by the likely perceived voice quality. The impor-tance of this is now starting to be recognized [12], [29], [34]. For example, in [34], perceived voice quality is used to control the playout buffer in order to maximise the values in terms
of delay and loss. The concept of perceptual optimization has also been extended to other QoS control problems, such as joint playout buffer/FEC control [35] to maximize values in terms of delay, loss and rate.
In this section, we apply the newly developed regression models directly for perceived quality-driven playout buffer op-timization. A minimum impairment criterion and a perceptual optimization playout buffer algorithm will also be presented.
For perceptual buffer optimization, the aim is to achieve an optimum voice quality (e.g., in the term of score). Con-sidering the relationship of voice quality and impairments (e.g., packet loss and delay), the problem of optimum voice quality can be converted to that of minimum impairment.
We define an overall impairment function which is a
func-tion of delay and packet loss , with .
If we ignore other impairments such as echo, factor can be simplified as
(13) As increases monotonously with [see (2)], a max-imum value corresponds to a maximum score. Further when maximum is obtained, it corresponds to a minimum im-pairment function, .
Using (9) and (4) (a simplified delay model is used to show the concept), can be expressed as
(14) where and are codec related constants. is the playout delay, including network delay, and buffer delay, . consists of network packet loss, and buffer loss, .
It is a tradeoff between delay and packet loss for any buffer algorithm. When playout delay goes up , then buffer
loss goes down . When , then .
An optimum playout delay is obtained when minimum im-pairment is reached.
. For a playout delay , the buffer loss
can be calculated as .
In [36], we demonstrated that Weibull distribution is the best fit for delay distribution for current VoIP traffic (compared to Exponential and Pareto distributions). In this paper, we use Weibull distribution directly to represent delay distribution and derive the relationship between buffer loss , packet loss (in percentage), and playout delay as follows.
(15) Replacing into (14), overall impairment factor, , can be expressed as
(16) For a given trace segment, the Weibull Distribution location parameter equals the minimum network delay , the scale parameter and shape parameter can be estimated using max-imum-likelihood-estimator (MLE) method [37]. The optimum playout delay can be obtained by searching for a playout delay which meets the minimum impairment criterion.
Equation (16), which relates impairment with playout delay and network packet loss for a given trace, can be used directly for perceived jitter buffer algorithm optimization. For simplicity, we only use the equation for G.723.1 codec to show the concept of perceptual optimization buffer design.
Network traces show high possibility of “spike” (which is fined as a number of packets that have significantly higher de-lays than the rest). Thus, the “spike” state can be regarded as an exceptional state in the trace data (seen as a short-term delay characteristic) and the remaining “nonspike” state can be ana-lyzed based on long-term delay distribution. Several algorithms exist for spike detection. For example, Ramachandranet al.[30]
proposed to use to detect the start of a
spike ( is the network delay for packet). This accounts for a spike with a sudden increase of delay. However, from analysis of our Internet trace data, we notice that a significant number of spikes are accompanied by a gradual increase which cannot be detected by the above algorithm. Considering spikes with sudden or gradual increase, we use the spike detection based on
Fig. 16. Performance comparison for different buffer algorithms.
as in [31]. The proposed perceptual optimum buffer algorithm (P-optimum) is illustrated in the Appendix. De-pending on the current mode, the playout delay for the next talk-spurt is estimated differently in each mode. In spike-detection mode, the delay of the first packet of a talkspurt becomes the es-timated playout delay for the talkspurt. Otherwise, the perceptu-ally optimized playout delay based on the delay distribution of the last packets (inNORMALmode) is used. The larger the value, the less responsive the scheme to adapt. Theheadand
tailparameters are used to set the threshold for spike detection. In order to compare with other buffer algorithms, we also implemented “exp-avg,” “fast-exp,” “min-delay,” “spk-delay,” and “adaptive” algorithms (for details, see [29]). The results are shown in Fig. 16 for the five selected traces. The window size is set to 1000. Theheadis 4 and thetailis 2, as suggested in [31]. During the experiment, we changed the window size from 100 packets (3 s) to 10 000 packets (300 s, as suggested by [31] and [34]), and noticed that the performance (the overall score) does not show a big difference within the range. We choose of 1000 (30 s), as it is an appropriate duration for the or calculation and has higher computation efficiency than the longer window length.
From Fig. 16, it can be seen that “P-optimum” obtained the optimum scores among all the five traces. Our previous proposed “adaptive” algorithm achieved suboptimum results. The remaining buffer algorithms achieve good results only in some traces, but not for all. It has to be mentioned that P-op-timum has the highest computational complexity, whereas the others including “adaptive” have a similar low complexity.
V. CONCLUSION
In this paper, we have presented a new methodology for developing models for nonintrusive prediction of voice quality. Based on the new methodology, we have developed nonlinear regression models to predict perceived voice quality nonintru-sively for four modern codecs (i.e., G.729, G.723.1, AMR, and
applied the regression models to two main applications: voice quality prediction for real Internet VoIP traces and perceived quality-driven playout buffer optimization. For voice quality prediction, results show that high prediction accuracy was obtained from the regression models (correlation coefficient of 0.987 for Scheme I and 0.985 for Scheme II, respectively) using real Internet VoIP trace data. For playout buffer optimization, the proposed perceptual optimized playout buffer algorithm also achieved optimum voice quality when compared to five other buffer algorithms for all the traces considered.
In this paper, we considered two main network impairments (i.e., end-to-end random packet loss and end-to-end delay) for different codecs. This can be extended to include other end-to-end impairments (e.g., burst packet loss). The method presented is generic and can be applied to other media (e.g., audio and video), but extra parameters will need to be considered [17]. It can also be used in automated multimedia system for adaptive codec type/mode and sender-bit-rate control to achieve the best possible end-to-end perceptual voice/video quality.
APPENDIX
PERCEPTUALOPTIMUMBUFFERALGORITHM(P-OPTIMUM) For every packet received, calculate the network delay
if then
if then
/ the end of a spike /
end if
else if then
/ the beginning of a spike / / save to detect the end of a spike later /
else
/ normal model /
- update delay records for the past packets
end if
At the beginning of a talkspurt
if then
/ estimated playout delay /
else
- obtain in Weibull distribution
- search playout delay for which meets
end if
V1.1.1, Eur. Telecommun. Stand. Inst., Apr. 1999.
[2] L. Yamamoto and J. G. Beerends, “Impact of network performance parameters on the end-to-end perceived speech quality,” inProc. Expert ATM Traffic Symp., Mykonos, Greece, Sep. 1997.
[3] Methods for Subjective Determination of Transmission Quality, ITU Rec. P.800, Int. Telecommun. Union, Aug. 1996.
[4] Perceptual Evaluation of Speech Quality (PESQ), An Objective Method for End-to-end Speech Quality Assessment of Narrow-band Telephone Networks and Speech Codecs, ITU-T Rec. P.862, Int. Telecommun. Union, Feb. 2001.
[5] A. W. Rix, M. P. Hollier, A. P. Hekstra, and J. G. Beerends, “Percep-tual Evaluation of Speech Quality (PESQ): the new ITU standard for end-to-end speech quality assessment, part I—time-delay compensa-tion,”J. Audio Eng. Soc., vol. 50, no. 10, pp. 755–764, Oct. 2002. [6] J. G. Beerends, A. P. Hekstra, A. W. Rix, and M. P. Hollier,
“Percep-tual Evaluation of Speech Quality (PESQ): the new itu standard for end-to-end speech quality assessment part II—psychoacoustic model,”
J. Audio Eng. Soc., vol. 50, no. 10, pp. 765–778, Oct. 2002. [7] The E-Model, A Computational Model for Use in Transmission
Plan-ning, ITU-T Rec. G.107, Int. Telecommun. Union, Jul. 2000. [8] N. O. Johannesson, “The ETSI computation model: a tool for
trans-mission planning of telephone networks,”IEEE Commun. Mag., pp. 70–79, Jan. 1997.
[9] Single-Ended Method for Objective Speech Quality Assessment in Narrow-Band Telephony Applications, ITU-T Rec. P.563, Int. Telecommun. Union, May 2004.
[10] A. D. Clark, “Modeling the effects of burst packet loss and recency on subjective voice quality,” inProc. IPTEL’2001, New York, Apr. 2001, pp. 123–127.
[11] R. G. Cole and J. Rosenbluth, “Voice over IP performance monitoring,”
ACM Comput. Commun. Rev., vol. 31, no. 2, pp. 9–24, April 2001. [12] A. P. Markopoulou, F. A. Tobagi, and M. Karam, “Assessment of VoIP
quality over internet backbones,” inProc. IEEE Infocom, New York, Jun. 2002, vol. 1, pp. 150–159.
[13] Methodology for Derivation of Equipment Impairment Factors From Subjective Listening-Only Tests, ITU-T Rec. P.833, Int. Telecommun. Union, Feb. 2001.
[14] S. Möller and J. Berger, “Describing telephone speech codec quality degradations by means of impairment factors,”J. Audio Eng. Soc., vol. 50, no. 9, pp. 667–680, Sep. 2002.
[15] S. Mohamed, F. Cervantes-Pérez, and H. Afifi, “Real-time audio quality assessment in packet networks,”Network Inform. Syst. J., pp. 595–609, 2000.
[16] ——, “Integrating networks measurements and speech quality subjec-tive scores for control purposes,” inProc. IEEE INFOCOM’01, An-chorage, AK, Apr. 2001, vol. 2, pp. 641–649.
[17] S. Mohamed and G. Rubino, “A study of real-time packet video quality using random neural networks,”IEEE Trans. Circuits Syst. Video Technol., vol. 12, no. 12, pp. 1071–1083, Dec. 2002.
[18] L. Sun and E. Ifeachor, “Perceived speech quality prediction for voice over IP-based networks,” inProc. IEEE Int. Conf. Communications ICC’02, New York, Apr. 2002, pp. 2573–2577.
[19] Z. Qiao, L. Sun, N. Heilemann, and E. Ifeachor, “A new method for VoIP quality of service control based on combined adaptive sender rate and priority marking,” inProc. IEEE Int. Conf. Communications ICC 2004, Paris, France, Jun. 2004, pp. 1473–1477.
[20] Method for Objective Measurement of Perceived Audio Quality, ITU-R Rec. BS.1387, Int. Telecommun. Union, Nov. 2001.
[21] Z. Wang and A. C. Bovik, “A universal image quality index,”IEEE Signal Process. Lett., vol. 9, no. 3, pp. 81–84, Mar. 2002.
[22] American National Standard for Telecommunications—Digital Trans-port of Oneway Video Signals-parameters for Objective Performance Assessment, ANSI T1.801.03, Amer. Nat. Stand. Inst., 2003. [23] C. Hoene, H. Karl, and A. Wolisz, “A perceptual quality model for
adaptive VoIP applications,” inProc. Int. Symp. Performance Evalua-tion of Computer and TelecommmunicaEvalua-tion Systems (SPECTS’04), San Jose, CA.
[24] L. Sun, “Speech Quality Prediction for Voice Over Internet Protocol Networks,” Ph.D dissertation, Univ. Plymouth, Plymouth, U.K., Jan 2004.
[25] Objective Measuring Apparatus, Appendix 1: Test Signals, ITU-T Rec. P.50, Int. Telecommun. Union, Feb. 1998.
[26] A. W. Rix, “Comparison between subjective listening quality and P.862 PESQ score,” inProc. Online Workshop Measurement of Speech and Audio Quality in Networks, Czech Republic, May 2003, pp. 17–25.
[31] S. B. Moon, J. Kurose, and D. Towsley, “Packet audio playout delay ad-justment: performance bounds and algorithms,”Multimedia Syst., vol. 6, pp. 17–28, 1998.
[32] J. Rosenberg, L. Qiu, and H. Schulzrinne, “Integrating packet FEC into adaptive voice playout buffer algorithms on the internet,” inProc. IEEE Infocom 2000, Tel Aviv, Israel, Mar. 2000, vol. 3, pp. 1705–1714. [33] V. Ramos, C. Barakat, and E. Altman, “A moving average predictor
for playout delay control in VoIP,” inProc. Quality of Service—IWQoS 2003, 11th Int. Workshop, Berkeley, CA, Jun. 2003, pp. 155–173. [34] K. Fujimoto, S. Ata, and M. Murata, “Adaptive playout buffer
algo-rithm for enhancing perceived quality of streaming applications,” in
Proc. IEEE Globecom2002, Nov. 2002, vol. 3, pp. 2451–2457. [35] C. Boutremans and J. Y. Le Boudec, “Adaptive joint playout buffer
and FEC adjustment for internet telephony,” in Proc. IEEE IN-FOCOM’2003, San Francisco, CA, Apr. 2003, pp. 652–662. [36] L. Sun and E. Ifeachor, “New models for perceived voice quality
pre-diction and their applications in playout buffer optimization for VoIP networks,” inProc. IEEE Int. Conf. Communications ICC 2004, Paris, France, Jun. 2004, pp. 1478–1483.
[37] A. Feldmann, Characteristics of TCP Connection Arrivals. Florham Park, NJ: AT&T Labs—Research, 1998 [Online]. Available: http://cite-seer.nj.nec.com/feldmann98characteristics.html
Lingfen Sun(M’02) received the Ph.D. degree in computing and communications with a specialization in speech quality prediction for VoIP networks from the University of Plymouth, U.K.
She is now a Research Fellow in School of Com-puting, Communications and Electronics, University of Plymouth, U.K. Her research interests include VoIP, voice and video quality measurement, IP network measurement and characterization, quality monitoring and prediction, multimedia communi-cations and networking, grid computing; and grid applications in eHealthcare.
Communications at the University of Plymouth. He was Head of School of Electronic, Communication and Electrical Engineering from 1995 to 1999. His Chair was sponsored by the communications company, WWG/Acterna, for four years (1996–2000).He has published extensively in the areas of signal processing and computational intelligence, including co-authoring Digital Signal Processing—A Practical Approach (1st ed., Addison Wesley, 1993; 2nd ed., Prentice Hall, 2002), and editing/co-editing five books including Artificial Neural Networks for Biomedicine(Springer, 2000). His primary research interests are signal processing and computa-tional intelligence techniques and their applications to important real world problems in biomedicine, multimedia communications and audio. He has led many government and industry funded projects in these areas over the years, including coordinator of a four-year, EU funded (Euro 6.4 million), network of excellence project (BIOPATTERN) in biomedical informatics in support of ehealthcare and genomic-based medicine. Over the past five years, he has established an industry-sponsored research program on perceptual-based, speech, audio, and video quality prediction in communication systems. His current research activities include quality of service prediction and control for multimedia communications over packet, grid-enabled and mobilead-hoc
networks, end-to-end quality of service measurements for real-time multimedia applications (e.g., voice and video over IP and e-health services), audio signal processing, audio quality prediction, biomedical informatics, biosignals analysis, objective evaluation of intelligent medical systems, and eServices.
Dr. Ifeachor has received several external awards for his work, including two awards from the Institution of Electrical Engineers (IEE)—the IEE Dr. V. K. Zworykin Premium in 1997 and 1998. He currently serves on the UK Committee for Professors and Heads of Electrical Engineering (PHEE) and on the Executive Team of the IEE Professional Networks (PN) on Healthcare Technologies. In 2004, he served as the chair of the PN Executive Team.