The Performance of a Linux NFS Implementation by
Christopher M. Boumenot
A Thesis
Submitted to the Faculty of the
WORCESTER POLYTECHNIC INSTITUTE in partial fulfillment of the requirements for the
Degree of Master of Science in
Electrical and Computer Engineering by
May 20, 2002
APPROVED:
Prof. David Cyganski, Major Advisor
Prof. John Orr
Abstract
NFS is the dominant network file system used to share files between UNIX-derived operating system based hosts. At the onset of this research it was found that the tested NFS implementations did not achieve data writing throughput across a Gigabit Ethernet LAN commensurate with throughput achieved with the same hosts and network for packet streams generated with-out NFS. A series of tests were conducted involving variation of many system parameters directed towards identification of the bottleneck responsible for the large throughput ratio between non-NFS and NFS data transfers for high speed networks. Ultimately it was found that processor, disk, and network performance are not the source of low NFS throughput but rather it is caused by an avoidable NFS behavior, the effects of which worsen with increasing network latency.
Acknowledgements
First and foremost I would like to thank Professor Cyganski who started this project. Without him, I would not have had such an interesting thesis and enjoyable graduate career. Professor Cyganski has constantly been there to support and guide me from the beginning of this project until its conclusion. He has been there during the ups and downs that go along with a thesis as well as the dead ends, wrong ways, U-turns, and other miscellaneous road signs experienced along the way. For all of his help, I am deeply indebted.
I would like to thank Professor Brown for being a member of my com-mittee, a good friend, and a professor. He taught me that with probability and linear systems theory you can do an ything in Electrical Engineering.
Professor Orr is the head of the ECE department, and in my six year career at WPI, I have not had the chance to meet with Professor Orr more than a few times. I am nonetheless appreciative of the work he has done that has affected me both directly and indirectly. Furthermore, I would like to thank him for accepting a position on my committee, and lending his thoughts and ideas to improve this thesis.
I would like to thank Pirus Networks for funding this thesis. I would also like to thank them for allowing us to develop a worthwhile thesis. Professor Cyganski and I determined in the middle of the project that the largest benefit we could do for Pirus and this thesis was by changing our originally stated intentions. Without hesitation, Pirus allowed us to change directions and explore that alternative.
Contents
1 Introduction 1 1.1 NFS . . . 2 1.2 Thesis Organization . . . 3 2 Network Benchmarks 4 2.1 Network Configuration . . . 4 2.2 Netperf . . . 5 2.3 Loopback . . . 8 2.4 Network Throughput . . . 8 2.5 Fast Ethernet . . . 10 2.6 Gigabit Ethernet . . . 11 2.6.1 Jumbo Frames . . . 13 2.6.2 Burst Mode . . . 13 2.6.3 Zero-Copy . . . 14 3 Introduction to NFS 15 3.1 NFS Protocols . . . 15 3.2 NFS . . . 16 3.3 NFS Versions . . . 183.4 Default Testing Conditions . . . 19
4 NFS Benchmarks 20 4.1 Connectathon . . . 21
4.2 Multiple Tasks . . . 25
4.3 Loopback . . . 30
5 An Interim Performance Model 36
5.1 Processor Bound Performance Model . . . 36
5.2 MTU Variation . . . 37
6 An Interim Performance Model Refutation 40 6.1 Disk Speed . . . 40
6.2 FreeBSD . . . 46
7 Round Trip Time Benchmarks 49 7.1 UDP and RPC RTT . . . 49
8 IP Fragments 53 8.1 IP Fragmentation . . . 53
8.2 Linux IP Fragments . . . 55
8.3 Variable Adjustment . . . 55
8.4 Testing for IP Fragments . . . 56
8.5 MTU’s Effect on Performance . . . 58
9 A Transactional Model 61 9.1 Core Processor Speed . . . 61
9.2 Network Latency . . . 63
9.3 Disk Latency . . . 64
9.4 Model of NFS Operations . . . 65
9.4.1 Loopback NFS Latency Model . . . 68
9.5 Calculations . . . 69
9.5.1 Host-to-Host . . . 69
9.5.2 One NFSD . . . 71
9.5.3 Loopback . . . 72
9.5.4 Revisiting Host-to-Host Throughput . . . 73
9.6 NFS vs. Processor Load . . . 74
9.7 NFS’s Network Pace . . . 74
10 Concurrency Observed 77 10.1 Multiple NFS Servers and Clients . . . 77
10.2 Multiple NFS Servers . . . 79
11 NFS Packet Trace Analysis 82
11.1 Fast Disk Packet Trace . . . 82
11.2 Slow Disk Packet Trace . . . 86
12 Conclusion 89 12.1 Black Box Model . . . 90
12.2 Future Work . . . 90
A Inventory 93 A.1 NFS Test Hosts . . . 93
B Source Code 95 B.1 Parse Connecathon Log Files . . . 95
B.2 Connectathon Write Shell Scripts . . . 97
B.3 Threaded Connectathon Write Test . . . 99
B.4 Ethereal NFS Packet Analyzer . . . 101
B.5 Parse Linux’s /proc . . . 105
B.6 UDP RTT Client . . . 108
B.7 UDP RTT Server . . . 109
B.8 Precise Timer Class Definition . . . 110
B.9 Precise Timer Class Implementation . . . 112
B.10 UDP Socket Class Definition . . . 114
B.11 UDP Socket Class Implementation . . . 116
B.12 UDP RTT Makefile . . . 118
B.13 Compute Average from UDP RTT Output . . . 119
B.14 Increase Processor Load . . . 120
C Default Operating System Parameters 122 C.1 Linux Parameters . . . 122
C.1.1 TCP/IP . . . 122
D NFS Tests 124 D.1 Additional NFS Tests . . . 124
List of Figures
2.1 Loopback diagram. . . 9 2.2 Linear relationship between processor speed and throughput
in loopback. . . 10 4.1 Polaris+ to Hutt at 1 Gbps. . . 23 4.2 Legacy to Hutt at 100 Mbps. . . 24 4.3 Polaris+ to Hutt at 1 Gbps with multiple tasks, and 1MB file
size . . . 26 4.4 Linear relationship as the number of tasks is increased . . . . 27 4.5 Polaris+ to Hutt at 1 Gbps with multiple tasks, and 1MB file
size, and different files per each write sub-test. . . 28 4.6 Polaris+ to Hutt at 1 Gbps with multiple tasks, and 32MB
file size. . . 29 4.7 Polaris+ Loopback with multiple tasks, and 1MB file size . . . 31 4.8 Polaris+ Loopback with multiple tasks, and 1MB file size . . . 32 4.9 Topology used for NFS network testing. . . 34 4.10 Alternative topology used to test network latency’s effect. . . . 34 4.11 Polaris+ to Hutt at 1 Gbps through alternate topology. . . 35 5.1 Packet inter-arrival times compared to packet processing times. 37 6.1 Revanche to Beast at 1Gbps, multiple tasks, 1MB file size,
and disk with 2.89 MB/sec transfer speed. . . 41 6.2 Revanche to Beast at 1Gbps, multiple tasks, 32MB file size,
very slow disk. . . 42 6.3 Revanche to Bastion at 1Gbps, multiple tasks, 1MB file size,
slow disk. . . 42 6.4 Revanche to Bastion at 1Gbps, multiple tasks, 32MB file size,
6.5 Revanche to Beast at 1Gbps, multiple tasks, 1MB file size, fast disk. . . 44 6.6 Revanche to Beast at 1Gbps, multiple tasks, 32MB file size,
fast disk. . . 44 6.7 FreeBSD: Kaboom to Crash at 100 Mbps. . . 47 6.8 (Linux) Kaboom to Crash at 100 Mbps. . . 47 7.1 Near-linear relationship between packet size and UDP RTT. . 51 7.2 Near-linear relationship between packet size and RPC RTT. . 52 8.1 Loopback performance of Revanche for varying MTU sizes. . . 59 8.2 Beast to Revanche performance for varying MTU sizes
con-nected directly by a crossover cable. . . 59 9.1 Loopback and host-to-host performance for different MTU
sizes for Revanche and Beast. . . 62 9.2 NFS model of a transaction. . . 65 9.3 NFS latency diagram for sequential transfer with a
host-to-host configuration. . . 66 9.4 NFS latency diagram for two concurrent transfers with a
host-to-host configuration. . . 66 9.5 NFS latency diagram, loopback mode for sequential transfers. 68 9.6 NFS latency diagram, loopback mode for concurrent transfers. 69 9.7 Processor load’s effect on NFS performance. . . 75 11.1 This plot shows the cumulative transfer versus time for a
Con-nectathon write test between Revanche and Beast. . . 84 11.2 Per transaction throughput for write test described in Section
11.1. . . 85 11.3 The time between write call requests and write call replies. . . 85 11.4 This plot shows the cumulative transfer versus time for a
Con-nectathon write test between Beast and Revanche (slower hard disk). . . 87 11.5 Per transaction throughput for test described in Section 11.1. . 88 11.6 The time between write call requests and write call replies. . . 88 D.1 Polaris+ to Hutt, varying block size . . . 124
List of Tables
2.1 NIC information. . . 5
2.2 Netperf benchmarks. . . 5
2.3 Netperf TCP test results in loopback. . . 8
2.4 Netperf UDP test results in loopback. . . 9
2.5 TCP Netperf results between Beast and Revanche. . . 11
2.6 UDP Netperf results between Beast and Revanche. . . 12
4.1 Average multitasked throughput between Polaris+ and Hutt with 1MB Files. . . 27
4.2 Polaris+ to Hutt at 1 Gbps with multiple tasks, and 1MB file size, and different files per each write sub-test. . . 29
4.3 Polaris+ to Hutt at 1 Gbps with multiple tasks, and 32MB file size. . . 30
4.4 Polaris+ Loopback with multiple tasks, and 1MB file size. . . 31
4.5 Polaris+ Loopback with multiple tasks, and 32MB file size. . . 32
5.1 Connectathon write test on Polaris+ through loopback. . . 38
5.2 Connectathon write test, Polaris+ to Hutt at 1 Gbps. . . 38
6.1 Throughput with 32MB files, and multiple tasks for different disk speeds. . . 45
7.1 UDP round trip times between Polaris+ and Hutt. . . 50
7.2 RPC round trip times between Polaris+ and Hutt. . . 50
7.3 UDP throughput with FTP-like transfers. . . 51
8.1 IP fragmentation results for direct crossover connection. . . 57
8.2 IP fragmentation results when connected through a Gigabit Ethernet Switch. . . 57 8.3 Jumbo frame performance through a direct crossover connection. 58
9.1 Comparison of hdparm and Connectathon measured write through-put. . . 65 9.2 Host-to-host latency NFS performance calculations between
Revanche and Beast based on Top= 0 approximation. . . 71
9.3 Effect of different network latencies and disk speeds on per-formance with a single nfsd. . . 72 9.4 host-to-host latency NFS performance calculations for a single
nfsd. . . 74 9.5 Packet trace of a Connectathon write test. . . 76 10.1 Packet trace of Connectathon write test between Revanche
and Beast. . . 78 10.2 NFS write test with Hutt as the client, and Beast and
Re-vanche as the servers. . . 79 10.3 NFS write test executed separately between Hutt as the client
and Revanche as the server, and Hutt as the client and Beast as the server. . . 79 10.4 NFS write test with Hutt as the server, and Beast and
Re-vanche as the clients. . . 80 11.1 NFS RPC write call retransmissions, and duplicates. . . 83
Chapter 1
Introduction
If one measures the speed of NFS (Network File System) write bandwidth in a loopback system, that is, one in which a local disk is NFS mounted hence incurring all network protocol costs but avoiding the physical layer one can obtain performance as high as 762 Mbps. Given that measurements of a Gigabit network between two machines yields throughput as high as 990 Mbps, it is conceivable that host-to-host NFS performance could equal loopback performance. However, our measurements show that performance may be as low as 61 Mbps. This observation gives rise to three goals of this thesis.
The first goal is to discover the bottlenecks that give rise to this loss of per-formance. This was accomplished by using industry standard benchmarks, and tools we developed to assess specific behaviors of NFS and the network. We observed the impact of results unbiased by NFS caching, under variations of network latency, disk speed, varying degrees of host performance, network round trip times, and network throughput.
Our second goal is to obtain a model for NFS performance that explains the above performance values in terms of component performance parame-ters. The models developed allowed us to assign a metric to the performance of a system’s TCP/IP stack, datagram processing based upon MTU size, expected loopback mode throughput, and expected NFS performance.
Our third goal is to develop a suite of tests that extract the performance parameters needed to populate the performance model by direct measure-ment of an otherwise black box NFS system. A model can be constructed to put an upper bound on the performance of NFS assuming no caching is involved. The parameters needed for this model are network propagation
delay, the NFS block size, the throughput of the hard disk, or RAID array, and the throughput of an NFS system in local loopback mode.
1.1
NFS
At the most basic level a filesystem is used to reliably store and retrieve a user’s data. Filesystems usually implement a hierarchy so that data may be maintained in a much more ordered fashion. This is usually done using files and directories to store and organize the data.
A filesystem must be reliable, transparent, and maintain data integrity. NFS (Network File System) is a type of filesystem that stores user’s data on a machine other than the user’s local one. The user is able to make a network connection to communicate with the filesystem transparently using the NFS protocol. This means that instead of having the data stored on one’s personal machine it is instead stored on the network.
From an administrative point of view it is difficult to maintain, organize, and protect data for many independent users. Bringing the user’s data into one central location makes these three requirements easy to implement. But, measures implemented for the convenience of the administrator must be made transparent to user in order to not disturb their working habits.
NFS gives each user the ability to manipulate their data as if it was stored locally on their machine, but at the same time allowing the data to actually reside in a different, more convenient location for the administrator.
A problem with NFS is that performance can suffer due to the fact that data must be moved across the network. The user is at the mercy of the performance of the network, and must deal with network issues such as con-gestion, and down time.
A second problem is a potentially wide variety of clients running differ-ent operating systems all want access to data on the server. Compared to a locally mounted filesystem, a network file system has more incompatibil-ity issues to address. NFS does not have the luxury of servicing only one machine, one user, and one operating system at a time.
An NFS server works by exporting a filesystem to clients. The clients can then mount the exported filesystem as if it was a local one. The com-munication between the NFS client and server is handled by RPC (Remote Procedure Call) which runs on top of a network protocol, either UDP, or TCP. All of these things together ensure that a consistent view of the
filesys-tem is maintained across all exported filesysfilesys-tems and users, and that data on an NFS server is treated no differently from that on a user’s machine.
1.2
Thesis Organization
This thesis is more like a detective story than a technical paper in that piece by piece evidence is gathered and discarded. The evidence is assessed, reasons given for its nature and conclusions that may be drawn from it are discussed. Finally, after careful review of all of the evidence an accurate model to describe NFS write performance is developed and verified.
Chapter 2 presents results for the network used to test NFS performance. Chapter 3 gives a brief introduction to NFS. NFS performance is investigated in Chapter 4 with the use of benchmarks to uncover performance under different conditions. Scenarios are developed to help explain performance in Chapter 5, and refuted in Chapter 6. Other possible NFS bottlenecks are examined in Chapter 8. In Chapter 9 an accurate model of NFS is described. This model is able to predict the upper bound on NFS performance within 2% of test results. The paper is concluded in Chapter 12.
Chapter 2
Network Benchmarks
The first step in the process of reviewing NFS performance was to test and quantify the performance of an Ethernet network. Specifically, we were con-cerned with Gigabit Ethernet over Fiber and Copper, and Fast Ethernet. The performance of the network was measured using many different bench-marks. Some of the benchmarks used were industry standard benchmarks such as Netperf (as described in Section 2.2), and others were developed to test performance of specific protocols. The network protocol related per-formance tests included TCP, UDP, and RPC throughput, and file transfer times using an FTP-like transfer mechanism.
2.1
Network Configuration
The machines used to test network performance were equipped with Gigabit Ethernet, and Fast Ethernet adapters. All of the network cards used were manufactured by Intel. Four Gigabit Ethernet adapters were used, two with copper connectivity and the remaining ones with fiber connectivity. The Fast Ethernet adapters have only copper connectivity. The Gigabit Ethernet adapters with only copper connectivity were connected with a crossover ca-ble. The remaining adapters were connected through the ECE department’s switch, which has a 40 Gbps backplane. The Gigabit Ethernet adapters were connected to the processor via a 64-bit/66MHz PCI bus for the ma-chines Beast and Revanche, but all other adapters were connected via a 32-bit/33MHz PCI bus. Table 2.1 displays a listing of the adapters used, manufacturer, model numbers, physical connection, and driver version.
Manufacturer Model Connection Type Driver Version Intel PRO/1000XT Copper Intel 4.1.7
Intel PRO/1000F Fiber Intel 4.1.7
Intel PRO/100 Copper Linux 2.4.18
Table 2.1: NIC information.
2.2
Netperf
The Netperf benchmark was used to measure the performance of Ethernet LAN connections with 100 Mbps, and 1 Gbps link speeds. The Netperf benchmark is able to test different aspects of a network. Those tests that are relevant to our experiments are listed in the Table 2.2.
Test Name Description
TCP STREAM TCP stream throughput UDP STREAM UDP stream throughput
Table 2.2: Netperf benchmarks.
The Netperf benchmark was developed by Rick Jones of Hewlett-Packard, and is available from http://www.netperf.org. It is capable of measuring TCP and UDP stream performance, TCP request, response performance, and TCP connect, request, and response performance. Netperf also has support for DLPI, XTI, and ATM. The test works by running a daemon on one host (server), and a client on another host. The client program has command line options that can be used to select the test to be run, and to change the default behavior of the test. For example, the send and receive buffers can be changed. For a complete list of options see the Netperf manual page.
The benchmarks executed involved using machines all the way from a Pentium II, 300 MHz, up to a Pentium IV, 1.7 GHz server. (Characteristics of the machines used can be found in Appendix A, and are keyed by machine name.) Netperf was launched on the client with only two command line options, one to specify the server’s IP address, and one for the length of the test. The Netperf documentation recommends running all tests for a period of at least one minute, and running enough trials to ensure results are consistent. The results presented reflect a test time of one minute, and
a total of three trials.
All of the tests were run again but with modifications to the operating systems default TCP parameters. From researching the USENET archives we found suggestions indicating modifying tcp mem, tcp wmem, tcp rmem, and MTU (Maximum Transmission Unit) would have a large effect on net-work performance. The USENET archives can be browsed and searched at
http://groups.google.com.
The following information was taken from the standard kernel distribution of Linux as found on http://kernel.org, in the Documentation directory1
of the kernel. This documentation was found in kernel 2.4.17, but can be found in future revisions as well as previous versions.
tcp_mem - vector of 3 INTEGERs: min, pressure, max low: below this number of pages TCP is not bothered about its memory appetite.
pressure: when amount of memory allocated by TCP exceeds this number of pages, TCP moderates its memory consumption and enters memory pressure mode, which is exited when memory consumption falls under "low".
high: number of pages allowed for queueing by all TCP sockets.
Defaults are calculated at boot time from amount of available memory.
tcp_wmem - vector of 3 INTEGERs: min, default, max
min: Amount of memory reserved for send buffers for TCP socket. Each TCP socket has rights to use it due to fact of its birth. Default: 4K
default: Amount of memory allowed for send buffers for
1
TCP socket by default. This value overrides
net.core.wmem_default used by other protocols, it is usually lower than net.core.wmem_default. Default: 16K max: Maximal amount of memory allowed for automatically selected send buffers for TCP socket. This value does not override net.core.wmem_max, "static" selection via
SO_SNDBUF does not use this. Default: 128K tcp_rmem - vector of 3 INTEGERs: min, default, max
min: Minimal size of receive buffer used by TCP sockets. It is guaranteed to each TCP socket, even under moderate memory pressure. Default: 8K
default: default size of receive buffer used by TCP
sockets. This value overrides net.core.rmem_default used by other protocols. Default: 87380 bytes. This value results in window of 65535 with default setting of tcp_adv_win_scale and TCP_app_win:0 and a bit less for default tcp_app_win. See below about these variables. max: maximal size of receive buffer allowed for
automatically selected receiver buffers for TCP socket. This value does not override net.core.rmem_max, "static" selection via SO_RCVBUF does not use this. Default: 87380*2 bytes.
MTU specifies the maximum transmission unit used by IP when assem-bling a datagram to accommodate the largest packet an interface or interven-ing network is capable of supportinterven-ing. In the case of Ethernet the maximum size is 1,500 (expect for the special case with Gigabit Ethernet when used with jumbo frames). RFC 1122 specifies that any node on the Internet must be capable of accepting packets of at least 576 bytes in size. The size spec-ified for an MTU can be either manually set or determined by the PATH MTU discovery algorithm when implemented. The PATH MTU discovery algorithm is defined in RFC 1191.
received which is larger than the network node is capable of handling. The receiving network must fragment the packet on octet (8-byte) boundaries. A source node can request a packet not be fragmented by marking the packet. If a node must fragment a packet marked as such, it is instead dropped, and an ICMP error message is sent back to host.
2.3
Loopback
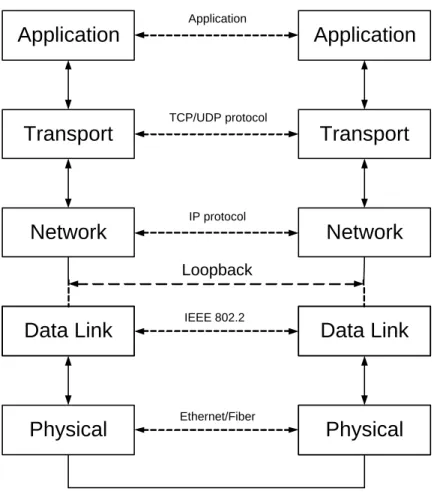
Loopback is a mode of operation in which a node acts as both a client and a server. In this mode the node’s TCP/IP stack is traversed twice, and the NIC and NIC driver is not used. A graphic depicting this can be seen in Fig. 2.1. All layers above the dashed line marked loopback represent the layers present in loopback. The data link and physical layer would not be present for a node in loopback mode.
2.4
Network Throughput
Performance evaluation in loopback mode was chosen as a starting point because one can see the raw performance of the machine without network bottlenecks. Loopback roughly shows half the performance that might be expected from a particular machine because the performance is processor speed bound (that is, there is no idle time during prosecution). In loopback, the host must act as both the sender and receiver. Netperf was executed on three different machines including Bastion, Hutt, and Revanche. The baseline TCP and UDP performance results are summarized in Table 2.3, and for UDP in Table 2.4.
Host Processor Processor Speed (MHz) Average Throughput (Mbps) Standard Devi-ation (Mbps) Bastion PII 350 628.21 10.96
Hutt Quad PII Xeon 700 1854.14 0.71
Revanche Athlon XP 1553 4299.46 70.9126
Application
Transport
Network
Application
Transport
Network
Application IP protocol TCP/UDP protocolPhysical
Data Link
Data Link
Physical
IEEE 802.2
Ethernet/Fiber
Loopback
Figure 2.1: Loopback diagram.
Host Processor Speed Average (Mbps) σ
Bastion PII 350 MHz 437.33 8.44
Hutt PII Xeon 700 MHz 1439.08 2.18 Revanche Athlon XP 1553 MHz 4674.81 51.48
The results show that our machines would not be processor limited on a connection through a network. A PII, 350 MHz machine is able to achieve approximately 630 Mbps in loopback. Because loopback requires twice the processing power, this machine should be able to achieve approximately 1.2 Gbps when coupled with a machine of equal or greater processing power. A near linear performance is observed compared to processor speed which indicates that in loopback mode, NFS throughput is exactly processor bound. This linear relationship is plotted in Fig. 2.2.
500 1000 1500 2000 2500 3000 3500 4000 4500 5000 400 600 800 1000 1200 1400 1600 Mbps
Core Processor Speed
Figure 2.2: Linear relationship between processor speed and throughput in loopback.
2.5
Fast Ethernet
The second test involved running Netperf between Legacy and Polaris over a 100 Mbps connection with the default TCP options of Linux kernel ver-sion 2.4.16. The average Netperf measured results of the three trials was equal to 94.093 Mbps, with a standard deviation of 0.03. The second half of this test involved the modification of tcp wmem, and tcp rmem to a value of ’65536 65536 65536’, this lead to a throughput of 94.12 Mbps with a standard
deviation of zero. This results translates into 99.1% of the theoretical maxi-mum performance in Mbps that can be achieved using Ethernet. Clearly we obtained network limited performance in this case.
The theoretical maximum performance of Ethernet was calculated by as-suming a standard TCP/IP header. A standard Ethernet frame is 1500 bytes in size. The IP header consumes 20 bytes, and the TCP header consumes 20 bytes, consuming a total of 40 bytes. Ethernet has a 8 byte preamble, 6 byte destination and source address, 2 bytes length or type field, 4 bytes for frame check sum (FCS), and 12 bytes used for inter frame spacing 2
. 94.93% = 1460
8 + 6 + 6 + 2 + 1500 + 4 ·100 (2.1)
2.6
Gigabit Ethernet
The primary network connection to be used for testing in this thesis is Gigabit Ethernet with both switched and crossover connectivity. The machines used in this test were Beast and Revanche both running Debian Linux v3.0 with kernel version 2.4.18. The results presented in this section present baseline results as well as performance upon modification to Linux’s TCP/IP parame-ters. The baseline test revealed a Netperf measured maximum throughput of 941.29 Mbps. The parameters tcp wmem, and tcp rmem were set to ‘1048576 1048576 2097152’, and the MTU was adjusted to 12,000 bytes. This yielded a result of 990.00 Mbps, with a standard deviation of 0. These results are also presented in Table 2.5.
MTU Connection tcp wmem/tcp rmem (bytes) Throughput (Mbps) 1,500 Switched default3
470.22 1,500 Switched ’1048576 1048576 2097152‘ 760.10
1,500 Crossover default 941.29
12,000 Crossover ’1048576 1048576 2097152‘ 990.00
Table 2.5: TCP Netperf results between Beast and Revanche.
2
Gigabit Ethernet, Rich Seifert, pg 169, 177
3
The results shown in Table 2.5 illustrate that the default parameter’s per-formance of crossover connectivity compared to the perper-formance as a result of tuning the default parameters is small. A 1% increase in performance was seen as a result of tuning parameters for crossover connectivity. The parameters had to be tuned much more aggressively to yield that 1% in-crease in performance, as opposed to Fast Ethernet. An MTU value larger than 12,000 bytes was not considered because Ethernet’s 32-bit CRC is not effective above an MTU of 12,000 bytes.
The performance of UDP was also tested with Netperf for both a switched, and crossover connection. The testing strategy recommended by Netperf for UDP is the same as TCP except that the throughput of the receiver should be used over the throughput of the sender.
A Netperf UDP stream test is composed of two parts. The first part involves the client transmitting to the server, and a measurement of the bandwidth achieved is recorded. The second part involves the server trans-mitting to the client, and a second measurement of the bandwidth achieved is recorded. The results of these tests are presented in Table 2.6.
MTU Connection Send Throughput (Mbps) Receive Throughput (Mbps)
1,500 Switched 748.69 451.96
1,500 Crossover 825.09 824.61
12,000 Crossover 868.02 868.02
Table 2.6: UDP Netperf results between Beast and Revanche.
There is a large discrepancy, 65%, between the performance of send and receive for UDP over a switched network. It is important to note the differ-ence between send and receive throughput performance. The measurement for both values is recorded on the client, and not on the server therefore; the send performance does not take into account lost UDP packets whereas receive performance does. The reason for packet loss is because UDP does not implement flow control thereby allowing a sender to easily overcome the receiver’s ability to properly buffer packets. As packets are being lost UDP is further hampered because it does not react to this information, and will continue to drown the receiver with UDP packets.
The loss of UDP packets due to buffer overflow is recorded in Linux as SNMP information. This information can be found in snmp under the proc
filesystem (/proc/net/snmp). We observed the values reported by Linux before and after the test, and found that 1,489,417 UDP packets were lost as the result of a 60 second Netperf UDP stream test. Later, it will be shown that this packet loss is not responsible for low NFS throughput performance. We attribute the performance difference between a switched and crossover connection as being the result of the switch’s inability to buffer packets, and UDP’s inability to react to adverse conditions in the network.
2.6.1
Jumbo Frames
Jumbo frames were used in some tests to increase the throughput for Gigabit connections by making the fragmentation of IP packets less frequent with the larger size. Jumbo frames typically allow an Ethernet frame size of 9,000 bytes, but can be made larger or smaller depending upon the manufacturer of the NIC. Support for a frame size of 9,000 is popular because of NFS’s 8 KB block size. An MTU size of 9,180 is recommended by RFC 1626 for ATM AAL5 supporting IP over ATM. IETF’s Network Working Group’s Internet draft “Extended Ethernet Frame Size Support4
,” recommends an MTU of 4,470 to support future applications that will make use of extended ethernet frames, and to prevent fragmentation of FDDI.
The support of jumbo frames between different hosts across a network is determined by using VLAN tagging[1] as defined in IEEE 802.1Q. Nodes can be placed on their own network segment to avoid VLAN requirements. In our configuration hosts were placed on a separate network segment.
2.6.2
Burst Mode
Gigabit Ethernet has the ability to operate in burst mode which allows it to transmit a series of frames up to a max of 64KB without releasing the transmission medium. The advantage is for non-fiber Ethernet (CDMA/CD) which must constantly sense the line to determine if it has the ability to transmit. In this case burst mode provides a means to bypass the bandwidth wasting inter-frame sense time. On the other hand, fragmentation of large datagrams into a 1,500 byte MTU is still required in burst mode since burst mode does not augment a node’s MTU.
4
2.6.3
Zero-Copy
When a packet arrives at a host it is the responsibility of the kernel to copy the packet from the NIC into its own address space. The packet must again be copied from the kernel’s address space to that of the user’s address space. The penalty incurred for having to copy the buffer multiple times is large, and can greatly affect network communication performance.
Providing means for a packet to be copied directly into a user’s ad-dress space, and bypassing the kernel is called zero-copy support. Zero-copy can improve network communication performance considerably. Khalidi[13] found a 40% increase in network communications throughput, and a 20% decrease in CPU utilization as a results of zero-copy. Zero-copy support is complex to implement, and most operating systems, and NICs do not provide the functionality to make zero-copy possible. The complexity in zero-copy stems from the fact that two sources of information are needed to copy a packet to a NIC. The kernel provides the TCP/IP header information, and the user’s process provides the actual data. The technique of bringing the two separate source of information together into one stream is called scatter-gather.
Zero-copy was introduced into the Linux kernel early in the 2.4 series by David S. Miller. Not all areas of the kernel make use of zero-copy, notably NFS, but there are patches available to add this functionality to NFS.
Additional techniques exist to improve network efficiency between the NIC and the operating system. They involve the more efficient movement of data between the NIC and the operating system. The Transport Area working group of the IETF is working on a draft for these techniques. Their work is available at http://www.ietf.org/3
.
Discovery of the fact that Linux’s NFS implementation4
did not support zero-copy, and that kernel patches were available to add support, happened after a majority of the results were collected. A test was conducted to observe the impact of NFS with zero-copy between Beast and Revanche, and there was no appreciable improvement in results found hence zero-copy is not used. The reason for this is made evident in Chapter 9.
3
http://www.ietf.org/internet-drafts/draft-ietf-isis-ext-eth-01.txt, http://www.ietf.org/proceedings/00jul/I-D/kaplan-isis-ext-eth-02.txt
4
Hirokazu Takahashi of VA Linux, NFS zero-copy patch developer, http://www.geocrawler.com/lists/3/SourceForge/789/50/8370662/
Chapter 3
Introduction to NFS
Network File System (NFS) is a stateless distributed file system that was invented by Sun Microsystems, and placed into the public domain in 1989 (RFC 1094). An NFS server exports a native file system so multiple clients can remotely mount said file system. The NFS server presents a consistent view to all clients, and manages client operations in a consistent manner.
3.1
NFS Protocols
NFS is built upon a layered protocol approach, much like other communica-tion protocols that conform to the spirit of the OSI model. NFS is the top layer sitting upon XDR, RPC, TCP or UDP, IP, link and physical layers such as IEEE 802.2 and Ethernet. Each layer in the system has a specific task and presents a consistent interface to the layer above and below. It is assumed the reader is familiar with the network, transport, and physical layers of this model [6].
RFC 1014 defines the External Data Representation (XDR) protocol that was developed by Sun to present a consistent encoding of data, and byte ordering. Computer systems use different conventions regarding the byte-ordering of data, as well as the format of structures. XDR ensures that one form, called the canonical form is used, which defines one byte ordering, and one structure. The transmission of data using XDR follows the format: sender places local data into canonical format, receiver decodes canonical format to local data.
mech-anism for a host to make a procedure call locally that is actually executed remotely. Typically, a call is executed remotely because the sending host does not have the resources locally to satisfy the call. RPC operates in a client/server relationship where a host with a service is the server, and the host requesting the service is the client. An RPC is packaged in the canonical from using XDR.
RPC is protocol independent and can be used with either TCP or UDP. UDP is usually the preferred choice, because RPCs are short-lived, and match well with the connectionless nature of UDP. The stateless nature of NFS, and the connectionless nature of RPC means that every RPC maintains enough state for that one RPC. This means that every RPC is independent of another and that every operation is self-contained. According to RFC 1057 it is the responsibility of the server to implement execute-at-most-once semantics, to avoid repetitive RPCs causing adverse effects. NFS requests can and are spread across multiple RPCs but the loss of one RPC does not affect the overall stream. A host can retransmit the missing RPC and continue the overall request where it left off.
An implication of RPC being connectionless is that RPC is responsible for implementing its own recovery mechanism in the event of a packet being dropped. Additionally, the arrival of packets out of order must be dealt with properly by some higher level mechanism that understands the semantics of the RPCs connected with a particular service. For example, NFS generated RPCs carry full block number reference state information in each RPC. Hence the server can be stateless.
3.2
NFS
NFS is a stateless protocol; being a stateless protocol the complexity of a server implementation is reduced, but performance is too. Complexity is re-duced by the fact every RPC operation carries enough state information for that one request, and in the event of failure only that RPC’s effect is lost. For example, if a client is accessing a server, and the server unexpectedly crashes, the client is guaranteed all previously acknowledged RPC opera-tions completed successfully. Performance is degraded by the very reason for increased data integrity, and reduced complexity - statelessness. Hav-ing state-packaged and idempotent RPC packets causes additional overhead which always means reduced performance.
There is another performance drawback due to the stateless nature of NFS. All NFS operations must be synced (“synced” is a term used to denoted the writing of all buffers and outstanding data to disk) to disk before they can be acknowledged if data integrity in the event of a system crash is to be preserved. NFS v2 and NFS v3 deal differently with the issue of whether or not a write can be committed synchronously or asynchronously - more on this later. A limited number of RPCs are allowed to interact with an NFS server at a time, and a RPC slot is consumed until the write is committed to disk. Stalling the RPC slot to finish a write makes for much more secure data, but does not help the NFS performance.
NFS clients do not have to be stateless, and most if not all do use state information to increase the performance of NFS. The client caches data and file attributes for quicker access. Client caching does affect the integrity of data because if the host crashes, data in the cache will be lost. Writes cached but not flushed are like local writes in this sense. Cached reads obviously have no impact on integrity.
NFS clients and servers employ specialized daemons called biods (block I/O daemon) and nfsds. A biod is used to pool write operations together into a single request to be sent to the NFS server. This avoids the needless sending of small RPCs, and leads to an overall improvement in performance. A biod connects to a server nfsd with a blocking behavior presented by both. Typically, the number of biods used by a client is four. Sun recommends1
for a server with 10 Mbps connection 16 nfsds, a 100 Mbps connections 160 nfsds, and a 1 Gbps connection 1,600 biods. Other tuning guides2
suggest 16 to 384 NFS threads per CPU, with the actual number being dependent upon processor performance. A SPARCstation 5 should use 16, and a 450 MHz UltraSPARC-II processor should use 384.
In Linux, a biod or rpciod is different than that found in other operating systems. Only a single rpciod kernel thread3
is used on the client to move data between the client and server. The rpciod is non-blocking as opposed to biods, and is as efficient because it satisfies a request (RPC) up to the point where it can sleep because of pending I/O and goes on to satisfy the next request in the queue. Copying the data from the socket is handled directly by the bottom halves of the networking layer.
1
Solaris 8 NFS Performance and Tuning Guide for Sun Hardware (February 2000). 2
System Performance Tuning, Gian-Paolo D. Musumeci et al, pg 264
3
As reported by Trond Myklebust, a Linux NFS developer, on the Linux NFS mailing list, http://www.geocrawler.com/lists/3/SourceForge/789/0/8388227/
When a host is not configured to run any biods or nfsds, an RPC con-nection can still be made by NFS. But, the performance degradation will be large. An RPC connection is typically made from a biod directly to an nfsd, and then later passed into the kernel from the nfsd. If an nfsd is not there to terminate the connection, it is terminated by the kernel, but all further connections will be blocked until completion. Having multiple nfsds to terminate connections avoids this constant blocking, and allows for better performance. If the server is extremely busy, and all of the nfsds become occupied with RPC connections, blocking will occur.
3.3
NFS Versions
NFS is available in three different versions, v2, v3, and v4 [2]. NFS v2 was put into the public domain by Sun Microsystems, and was the first version used in production environments. Subsequent versions of NFS are under the control of the IETF. NFS v3 was developed to address the shortcomings of v2, namely poor write performance, and small block size. NFS v4 is a radical departure from the first two versions - having moved from a stateless to a stateful implementation.
The fact that NFS v2 does not allow for asynchronous writes means the client has to block until a write operation has been successfully committed to disk, and acknowledged. NFS v3 allows for asynchronous writes, which increases the performance dramatically, but it also reduces the data integrity should the server fail.
The block size was increased in NFS v3, which allows RPC connections to bundle much more data, and be more efficient in their transfer size. NFS v2 allowed a block size of 1k or 2k, but v3 added 4k, 8k, 16k, and 32k.
NFS v4 is much different from the previous two versions. It was developed to address the shortcomings observed in NFS as a whole. Specifically, NFS v4 focuses on performance, security, consistency across different computer systems, better access across the Internet, internalization, and localization4
. 4
3.4
Default Testing Conditions
The experiments to be shown are executed with default NFS options. The default options are 8KB block sizes, the UDP protocol, asynchronous write access, and NFS protocol v3. Unless explicitly stated to the contrary these options were the defaults options used for NFS testing.
Chapter 4
NFS Benchmarks
Measuring the performance of NFS in a vacuum is meaningless; there is an obvious need to compare one machine against another, and one way to ac-complish this is with industry standard benchmarks. There are two broad categories of benchmarks - benchmarks that closely simulate real-world con-ditions, and benchmarks that exercise a specific function. The first approach can lead to conditions where faults in the system go undetected because they are obscured by averaging of performance values for the overall system. The second approach allows one to concentrate narrowly on conditions causing performance problems within the system, but may lead to ignorance of other facets of the system or problems only excited by conditions arising from complex semantics arising in actual applications.
The initial benchmark chosen for this project was the industry standard benchmark Connectathon, available fromhttp://www.connnectathon.org. The Connectathon benchmark is made up of three separate groups of tests including basic, general, and lock tests. The basic tests consist of simple file operations including file creation, file deletion, directory creation, directory removal, getting attributes, setting attributes, looking up attributes, reading files, writing files, linking, renaming, and getting file system status. The general test executes application programs such as nroff, make and compile. The lock test exercises the ability of the NFS implementation to properly implement locking semantics.
4.1
Connectathon
The first step towards benchmarking the various systems was to establish a baseline. To do this we used different machine configurations utilizing Gigabit Ethernet connections. (Information on the machines used for these tests in Appendix A.) The Connectathon suite was run with different mount options. The mount options used include using no options (baseline uses UDP, NFS v3, and 8KB write and read blocks), specifying NFS v3 and UDP as the protocol, and NFS v2 and UDP protocol. (The default values for baseline were stated both explicitly and implicitly.) The legend of the graphed data is presented with baseline, 3U, and 2U, and should be read as baseline, NFS version 3 with UDP, and NFS v2 with UDP respectively. The reason that TCP was not used as a protocol in these tests is due to the fact that Linux’s NFS implementation does not reliably (if at all) support TCP at the time of this writing. The kernel version at the time of this writing is 2.4.18.
The plots used in this thesis connect test points by lines, but in actu-ality the lines contain no information that is of value to us. However, the readability of the graphs are increased by using lines to connect test results associated with a given test configuration.
The graph shown below in Fig. 4.1 is the output of a Connectathon basic test between Polaris+ (client) and Hutt (server). The basic suite of Connecathon consists of ten different tests. These tests are enumerated in order in the following list.
1. recursive file and directory creation: The number of files, directories, and levels recursed is user specified. The default values are files=5, directories=2, and levels=5. These options can be adjusted at the time of test execution with command-line options.
2. recursive file and directory removal: The number of files, directories, and levels recursed is user specified. The default values are files=5, directories=2, and levels=5. These options can be adjusted at the time of test execution with command-line options.
3. lookups across a mount point: The system getcwd() is executed a user specified amount of times. The default is 250, and can be adjusted at the time of test execution with a command-line option.
4. getattr, setattr, and lookup: Ten files are created in a directory. The system calls chmod(), stat() are executed a user specified amount of
times on these files. The default is 50 for each file and can be adjusted at the time of test execution with a command-line option.
5. write file: A file of user defined size is written ten times. The default size of the file is 1MB. The size of the file is adjustable at the time of test execution with a command-line option.
6. read file: A file of user defined size is read ten times. The default size of the file is 1MB. The size of the file is adjustable at the time of test execution with command-line options.
7. read directory: 200 files are created in a directory and the directory is read 200 times. The directory is operated on with the system calls opendir(), rewinddir(), readdir(), and closedir(). The number of files created, and the number of operations on a directory is adjustable at the time of test execution with command-line options.
8. rename and link: Ten files are created in a directory. Each file is op-erated on ten times with the system calls link(), and rename(). The number of files created and the number of operation per file is ad-justable at the time of test execution with command-line options. 9. symlink and readlink: Ten files are created in a directory. Each file is
operated on twenty times with the system calls symlink(), and read-link(). The number of files created and the number of operation per file is adjustable at the time of test execution with command-line options. 10. getfs: The system calls statvfs(), and statfs() are called a default 1,500 times. This value is adjustable at the time of test execution with a command-line option.
The only tests on the graph that can be directly translated into through-put are the write and read tests. These tests were run with the default options. This means Test5 wrote 10MB of data in 0.513 seconds, which translates into 163.5 Mbps. The read test, Test6 read 10MB of data in 0.1 seconds which translates into 838.9 Mbps. Comparing these results to the results gathered with Netperf of 990 Mbps, NFS write throughput behaves more than six times worse.
Read performance throughput was large due to the use of an NFS cache on the client side. Note that the first operation committed was a write, and
0 0.5 1 1.5 2 2.5 1 2 3 4 5 6 7 8 9 10 Seconds Test No. baseline 3U 2U
Figure 4.1: Polaris+ to Hutt at 1 Gbps.
the NFS client implements caching thereby retaining the data for later use. The following test is a read test which does not even have to ask the NFS server for the data because it has a copy in its cache thereby producing a large throughput. Read performance out-paces write performance in almost all cases, and results gathered from read tests are skewed from this caching effect. For this reason, read performance is not considered in the examination of NFS we will conduct because its performance is far more reliant on client caching mechanisms.
The large gap in performance that exists between raw Gigabit Ethernet, and NFS write performance led us to believe that the required instruction processing overhead for NFS is large. This large amount of processing should cause throughput to be adversely and linearly affected by reduction of the clients processing power. To test this assertion the configuration was changed to involve the use of a slower client to see if the processing power of a machine did affect performance. Additionally, the bandwidth of the network was lowered to a tenth of its former value to determine if network bandwidth affects performance. These alternative configuration results can be in Fig. 4.2. (These variations were conducted together as a gross determination of their effects on performance. Later in this thesis we will vary the processor
speed separately.) 0 0.2 0.4 0.6 0.8 1 1.2 1.4 1.6 1 2 3 4 5 6 7 8 9 10 Seconds Test No. baseline 3U 2U
Figure 4.2: Legacy to Hutt at 100 Mbps.
As a result of lowering the processor core clock speed by approximately a factor of four, and decreasing the network’s bandwidth to a tenth of its former value, a relatively small effect was observed. The performance of the write throughput experienced a decrease in bandwidth by a factor of 2.3 times, from 163.5 Mbps to 69.9 Mbps.
We expected the performance to decrease by a much larger factor than it did. Our hypothesis that NFS requires more processing power than Polaris+ was able to provide is not valid. That is, our hypothesis that the network was under utilized due to the inadequate processing power of Polaris+ is not valid. The real cause of the observed poor performance might be at-tributed to a number of possible suspects: biod limitation, nfsd limitation, the transactional nature of NFS/RPC/UDP/IP deadlocks, RPC stop and wait behavior, and the performance bottlenecks having to do with the NIC, and NIC driver.
The results above led us to reassess the nature of the next set of exper-iments needed to narrow the focus on the possible bottlenecks mentioned above.
concen-trate on the write throughput values. Tests concerned with get/set attributes were ignored because these types of operations can be accelerated with meta-journaling [11]. The read test was ignored because it is cache implementation sensitive and strongly client dependent. The caching algorithms used, and the amount of memory used to cache is different from client to client. A large cache would allow for more operations to be readily available whereas another implementation with a smaller amount of cache would suffer in comparison. Our focus is now concerned with write test performance for asynchronous operations so that we can capture the lowest transactional level bottlenecks. Asynchronous mode is used because synchronous mode writes block until the data is committed to disk. This makes tests much more dependent upon the available number of biods, nfsds, and disk speeds. Synchronous writes also introduce a stop-wait behavior because after an RPC for a write is made, the user must wait until the data is committed before continuing. Asynchronous mode allows operations to be outstanding, avoids the stop-wait behavior, and exposes the machine’s ability to processes protocol handling from NFS down to the link level as well as expose network related bottlenecks.
4.2
Multiple Tasks
The test results up to this point have involved minimal testing of NFS, but have shown that there is a definite performance issue to be addressed. It has also been shown that the performance of the cache has an effect on the performance of NFS. Before continuing further and testing the various aspects of NFS, and attempting to determine bottlenecks, we would like to show that the caching mechanisms of NFS can be removed. To do this, tests were constructed that eliminated spatial and temporal locality.
To remove spatial locality, large files (32MB) were used instead of the normal 1MB files that Connecathon uses. The use of large files and a large number of tasks should remove spatial locality because the cache cannot maintain enough data before it is forced to commits its contents. Constantly filling the cache’s buffer, and forcing the writes to disk makes the principle of spatial locality ineffective. For the same reasons, NFS’s cache cannot use temporal locality because it would require too much memory.
Temporal locality can be affected by using many tasks to write many small files. The constant movement of data causes NFS’s cache to contin-uously exchange the contents of its cache with the newer incoming data.
This constant change does not allow NFS to make use of temporal locality, because old data is not retained.
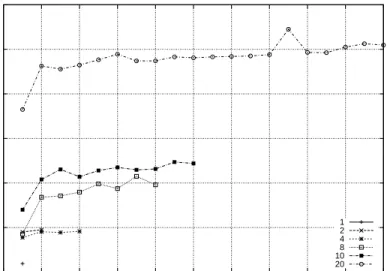
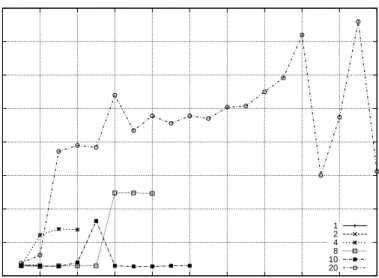
The following tests involve the use of multiple tasks from a single client accessing a single server. The tests were constructed such that a varying number of tasks were executed in parallel, with each one running an instance of the Connectathon write test, Test5. The number of tasks used took on six values for a single test, with the individual break down being 1, 2, 4, 8, 10, 20. 0 2 4 6 8 10 12 0 2 4 6 8 10 12 14 16 18 20
Seconds per Task
Tasks No. 1 2 4 8 10 20
Figure 4.3: Polaris+ to Hutt at 1 Gbps with multiple tasks, and 1MB file size
Fig. 4.3 shows the results of a multiple task test between Polaris+ and Hutt. The graph should be read by reading the X-axis as the index of a task that executes one instance of the Connectathon write test. The Y-axis corresponds to the amount of time required for each task. The results from tasks used in a single test are all tied together with a line to help the reader to easily differentiate between the various tests. Note, when the number of tasks used in a particular test is eight or larger, there is a clear advantage to being the first task. Subsequent tasks require approximately the same amount of time to complete as opposed to the first. This results from a slight advantage had by the first thread having been launched without delay
from a busy processor unlike those that follow. Table 4.1 presents the average throughput for each different task count.
Client Server No. of Tasks Throughput (Mbps) Standard Devi-ation (Mbps) 1.7 GHz 700 MHz 1 220.753 0 1.7 GHz 700 MHz 2 120.70 0.007 1.7 GHz 700 MHz 4 48.141 0.13 1.7 GHz 700 MHz 8 23.959 0.79 1.7 GHz 700 MHz 10 19.000 0.61 1.7 GHz 700 MHz 20 8.717 0.68
Table 4.1: Average multitasked throughput between Polaris+ and Hutt with 1MB Files.
These results have a near linear relationship in execution time that can be seen in Fig. 4.4. The data curve is a plot of the actual data. The solid line represents linear performance, and is used to compare the data against linearity. 0 1 2 3 4 5 6 7 8 9 10 0 2 4 6 8 10 12 14 16 18 20 Total Seconds Task Count
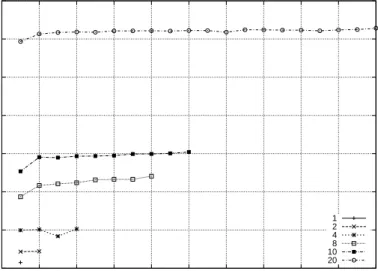
The Connectathon write test writes a 1MB file ten times in a row. Due to this, subsequent writes after the first benefit from caching. By adjusting the test such that ten different files were written as opposed to one, the benefit of the caching mechanism is obstructed. Fig. 4.5 shows the results of conducting a test between Polaris+ and Hutt using different files for each of the ten file access operations with a size of 1MB, and Fig. 4.6 shows the same test with 32MB files. Table 4.2 and Table 4.3 shows the results with the average throughput based on the number of tasks used for 1MB and 32MB files respectively. 0 1 2 3 4 5 6 7 8 9 10 11 0 2 4 6 8 10 12 14 16 18 20
Seconds per Task
Task No. 1 2 4 8 10 20
Figure 4.5: Polaris+ to Hutt at 1 Gbps with multiple tasks, and 1MB file size, and different files per each write sub-test.
The results seen in Table 4.3 show that the caching mechanism of NFS is directly affecting the results. Using the same file for all write operations results in a throughput of 220 Mbps, while using separate files the throughput is 153 Mbps; this makes the cached transfer approximately 1.5 times faster than the non-cached transfer. When using 20 tasks the improvement was not seen, but this can easily attributed to the large file size, and the resulting inability to make use of spatial and temporal locality.
The memory required to store 20 tasks each with 32MB worth of data is 671MB - just to handle incoming data for NFS. If this number is adjusted to
Client Server No. of Tasks Throughput (Mbps) Standard Devi-ation (Mbps) 1.7 GHz 700 MHz 1 153.345 0.00 1.7 GHz 700 MHz 2 175.68 0.04 1.7 GHz 700 MHz 4 148.64 0.05 1.7 GHz 700 MHz 8 162.10 0.33 1.7 GHz 700 MHz 10 174.65 0.49 1.7 GHz 700 MHz 20 177.11 0.69
Table 4.2: Polaris+ to Hutt at 1 Gbps with multiple tasks, and 1MB file size, and different files per each write sub-test.
0 100 200 300 400 500 600 700 0 2 4 6 8 10 12 14 16 18 20
Seconds per Task
Task No. 1 2 4 8 10 20
Figure 4.6: Polaris+ to Hutt at 1 Gbps with multiple tasks, and 32MB file size.
Client Server No. of Tasks Throughput (Mbps) Standard Deviation (Mbps) 1.7 GHz 700 MHz 1 180.521 0 1.7 GHz 700 MHz 2 197.34 0.72 1.7 GHz 700 MHz 4 195.87 8.83 1.7 GHz 700 MHz 8 178.58 16.56 1.7 GHz 700 MHz 10 177.22 14.21 1.7 GHz 700 MHz 20 173.16 7.08
Table 4.3: Polaris+ to Hutt at 1 Gbps with multiple tasks, and 32MB file size.
reflect the writing of ten separate files for each task this number quickly grows to 6,710MB. A cache benefits from frequently accessed areas, and accesses that are temporally close, not long term large requests such as these. Hence from these tests, we have learned that we should use tests in the following experiments that either transfer large files or many different files to truly assess communication speeds without caching effects.
4.3
Loopback
Up to this point all of the tests were conducted over a switched Ethernet network, with 100 Mbps and 1 Gbps line speeds. One of the bottlenecks that may be hampering the performance of NFS is the NIC, and NIC driver performance. The easiest way to eliminate this variable is to configure a host to run in loopback.
In loopback, the host acts as both the client and server, and mounts its own exported filesystem. When using loopback a packet still travels through the TCP/IP stack, but the data-link and physical layer are removed1
. When a packet reaches the network layer it is placed in the loopback driver, essentially an IP input queue. The IP input queue is a temporary holding place used until the transport layer retrieves the packet. Once the packet is retrieved it travels up through the stack to the application layer.
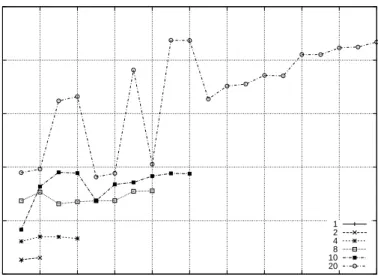
The tests with multiple tasks were run again with a file size of 1MB and 32MB. The results can be seen Fig. 4.7 and Fig. 4.8 respectively. The results
1
are also presented in total throughput for each different set of task in Table 4.4, and Table 4.5. 0 50 100 150 200 250 0 2 4 6 8 10 12 14 16 18 20
Seconds per Task
Task No. 1 2 4 8 10 20
Figure 4.7: Polaris+ Loopback with multiple tasks, and 1MB file size
Host No. of Tasks Throughput (Mbps) Standard Deviation (Mbps)
1.7 GHz 1 524.29 0 1.7 GHz 2 524.29 0 1.7 GHz 4 621.38 0.26 1.7 GHz 8 1,206 0.56 1.7 GHz 10 3,830 0.21 1.7 GHz 20 760.70 0.88
Table 4.4: Polaris+ Loopback with multiple tasks, and 1MB file size.
The results from the loopback tests strongly implicate the NIC and driver as causing the major bottlenecks in NFS, as it can be seen NFS is able to achieve higher throughput when not hampered by the network. The through-put achieved by using 1MB files is almost 4 Gbps at its peak. This number is highly sensitive to the cache, and the average throughput with 32MB files is a more realistic metric. The average of 32MB files was approximately 300
0 0.5 1 1.5 2 2.5 3 3.5 4 0 2 4 6 8 10 12 14 16 18 20
Seconds per Task
Task No. 1 2 4 8 10 20
Figure 4.8: Polaris+ Loopback with multiple tasks, and 1MB file size
Host No. of Tasks Total Throughput (Mbps) Standard Deviation (Mbps)
1.7 GHz 1 244.03 0 1.7 GHz 2 374.26 1.31 1.7 GHz 4 321.52 2.05 1.7 GHz 8 300.95 5.01 1.7 GHz 10 323.20 16.76 1.7 GHz 20 318.00 46.67
Mbps. Recall that the host must do twice the work in loopback therefore; the expected performance of NFS in a host-to-host configuration is greater than 600 Mbps if no execution costs or bandwidth restrictions were associ-ated with the NIC and NIC driver This is clearly higher then our current performance in host-to-host peformance. In fact, the maximum throughput achieved thus far was between Polaris+ and Hutt with a measurement of 197 Mbps (Table 4.3) - more than three times slower.
4.4
Network Latency
Another possible effect on the performance of NFS is network latency. All client server configurations tested go through a single switch (Table 2.1) when creating a network connections2
. As a result of this minimal distance with respect to the number of intermediary nodes, it is expected that not all NFS servers have the luxury of clients being one hop away, and this section determines if network latency does in fact play a role in performance.
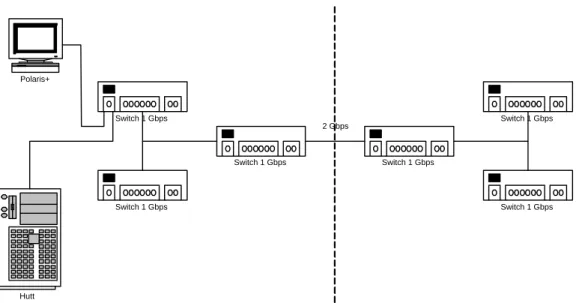
The network configuration for the test can be seen in Fig. 4.9. The client, Polaris+ in this case is connected to the NFS server Hutt, via a single network switch. That switch together with the switch directly below it serves all computers within the ECE department at WPI. The switches to either side of the dashed line are used to interconnect buildings via a 2 Gbps link. This topology is reflective of all tests conducted thus far. The test as seen in Fig. 4.9 wass repeated again, but the topology was changed to that as seen in Fig. 4.10.
The topology Fig. 4.9 yields a ping time of 0.2 ms. The alternative topology yielded a time of 0.6 ms.
After Polaris+ was moved such that it now had to traverse multiple switches to reach Hutt, the basic tests from Connectathon were executed again. The results can be see if Fig. 4.11.
Fig. 4.1 represents the same client and server for the standard topology. These results when compared to those of Fig. 4.11 show that network latency does not have an affect on the performance of NFS. The alternative topology produced write times that were slightly faster the standard topology. They went from 0.544 seconds to 0.518 seconds as a result of switching to a different topology, with a higher latency. This translates into 154 Mbps, and 162 Mbps respectively.
2
Polaris+ Switch 1 Gbps Switch 1 Gbps Switch 1 Gbps Switch 1 Gbps Switch 1 Gbps Switch 1 Gbps Hutt 2 Gbps
Figure 4.9: Topology used for NFS network testing.
Polaris+ Switch 1 Gbps Switch 1 Gbps Switch 1 Gbps Switch 1 Gbps Switch 1 Gbps Switch 1 Gbps Hutt 2 Gbps
0 0.5 1 1.5 2 2.5 1 2 3 4 5 6 7 8 9 10 Seconds Test No. baseline 3U 2U
Figure 4.11: Polaris+ to Hutt at 1 Gbps through alternate topology. As will become evident later, these results were misleading and caused us to subsequently not identify the true basis of our performance bottleneck until some contradictory results arose later.
Chapter 5
An Interim Performance Model
5.1
Processor Bound Performance Model
A phenomenological mathematical model will now be developed from the data gathered to this point in the investigation to gain better insight into the protocol processing and packet propagation mechanisms at work in an NFS connection. The model is also used to develop a better understanding of the performance parameters of each host under test. The model accurately describes the fixed processing time of a packet, and the processing time that is dependent upon the size of the overall packet. Logically, fixed processing can be thought of as the amount of time a packet must always incur when moving through the TCP/IP stack. The variable processing time would be due to things such as calculating a packets checksum, which is shorter for smaller packets and longer for larger packets.
The model does not describe solely the amount of time it takes to process a single packet, but rather the time to process a packet, plus an associated gap between packets. The NIC places a packet on the wire. Once that occurs the NIC is able to move onto the next packet to be serviced, but before it is able to launch the next packet a small amount of time has elapsed. This elapsed time creates a small gap between transmitted packets. Fig. 5.1 illustrates this decomposition.
The loopback test demonstrated what seems to be a bottleneck associated with the action of sending a packet across the network. In loopback mode NFS was able to achieve a throughput of 524 Mbps (Fig. 4.7), while an NFS connection to another machine yielded only 221 Mbps (Table 4.1). Since
T
Figure 5.1: Packet inter-arrival times compared to packet processing times. earlier tests had shown that the NIC driver and card could sustain throughput of rates of greater than 990 Mbps, the location of the bottleneck would appear to be in the processing required to prepare the packet for launching since the loopback interface used an MTU of 16,384 bytes and the Ethernet connection used an MTU of 1,500 bytes. A likely suspect is the processing time required to fragment the 9,000 byte NFS write requests into packets that fit the specified MTU. These results suggest that performance of the NFS system is processor performance bound. If this were the case, variation of the processor load required to launch packets should have a direct and easily modeled effect on throughput. The fact that the MTU of an IP interface can be changed at will providing a simple means to vary the load associated with each NFS transaction.
The purpose of this test is to determine the processing power of the client’s TCP/IP stack, how long it takes to process a packet based on its length, and the fixed overhead experienced by every packet.
5.2
MTU Variation
The results were gathered by connecting several different hosts over NFS. We used both a network connection via Gigabit Ethernet, and a loopback connection. The Connectathon write test with 1MB files, and one task was then executed on the client with successive iterations adjusting the MTU. By using a small file size we seek to suppress disk transfer response effects and highlight protocol processing. The MTU was then adjusted to three distinct values. The first set of data used to verify our model was collected from Polaris+ in loopback mode. The overall throughput of the test, and MTU were recorded. Table 5.1 shows these results.
Using the arguments presented above, suppose the overall processing time is dependent upon the MTU size, then a fixed processing time exists. A
MTU NFS Throughput (Mbps) R = MTU/s T = 1/R (µs)
576 363 78776 12.6
1500 444 37000 27
16384 600 4577.6 218
Table 5.1: Connectathon write test on Polaris+ through loopback.
variable amount time also exists that changes as the size of the packet does. T0 represents this fixed amount of time, andαrepresents the proportionality
constant that yields a variable amount of time. M represents the size of the MTU is bytes.
T(M) =αM +T0 (5.1)
We can obtain a testable (though not optimal) model by using two of three values from Table 5.1 T0 and α can be solved.
α16384 +T0 = 218
α1500 +T0 = 27
⇒α= 0.0128325, T0 = 7.75µsec
After the two unknowns have been calculated verify the results with the first results - an MTU size of 576.
Test: α576 + 7.75 = 15.14µsec
To further verify the model, the test was run again with Polaris+ acting as an NFS client, and Hutt acting as an NFS server. The collected data for throughput for a given MTU is presented in Table 5.2.
MTU NFS Throughput (Mbps) R = MTU/Sec T = 1/R (µsec)
256 128.6 64,300 15.5
576 156.86 34,040 29.3
1000 166.67 20,825 48
Table 5.2: Connectathon write test, Polaris+ to Hutt at 1 Gbps.
⇒α = 0.0441, T0 = 3.9µsec
These values are on the order of those found with Polaris+ in loopback for the results in Table 5.1. This T0 is approximately half of what was found for loopback (7.75), which is as one would expect because a machine in loopback has to do twice the amount of work.
The outcome of this test seems to verify the conjecture that performance is processor bound and related to a large cost which is proportional to the number of MTUs processed. Furthermore, the MTU proportional cost is significantly increased by the process of passing datagrams from the IP stack to the transmitted NIC hardware and back again at the receiver.
Further tests were conducted with matched and higher speed clients and servers to confirm this hypothesis. We ultimately found this model to not be correct via these tests.