Limited arbitrage and liquidity in the market for credit risk
Amrut Nashikkar∗ Marti Subrahmanyam† Sriketan Mahanti‡June 17, 2008
We acknowledge the generous support of State Street Corporation in providing the resources for conducting the research reported in this paper. We thank Craig Emrick, Gaurav Mallik, Jeffrey Sutthoff and Caroline Shi at State Street Corporation for helpful discussions and their unstinting support in putting together the databases used in this research. We thank Dion Bongaerts, George Chacko, Rainer Jankowitsch, Ahmet Kocagil, Lasse Pedersen and Mike Piwowar, for suggestions regarding the research design and comments on previous versions of this paper. We also thank participants at the 2006 NBER conference on microstructure, and the 2007 EFA meetings, and seminar participants at Universita Commerciale Luigi Bocconi, Milan, Carnegie-Mellon University, Imperial College, London, London Business School, University of Melbourne, Northwestern University, Singapore Management University, and Universita Ca’ Foscari, Venice. All errors remain our own.
∗
email: anashikk@stern.nyu.edu; Tel: +1 212 998 0718. Amrut Nashikkar is a PhD candidate at the Stern School of Business, New York University.
†
email: msubrahm@stern.nyu.edu; Tel: +1 212 998 0348. Marti Subrahmanyam (the corresponding author) is on the faculty at the Stern School of Business, New York University.
‡
email: sriketan@idomail.com; Tel: +1 508 517 2636. Sriketan Mahanti is a Principal at the Orissagroup and was formerly Vice President, State Street Global Markets.
Limited arbitrage and liquidity in the market for credit risk
June 17, 2008
Abstract
Recent research has shown that default risk accounts for only a part of the total yield spread on risky corporate bonds relative to their risk-less benchmarks. One candidate for the unexplained portion of the spread is a premium for liquidity. We investigate this possibility by relating the liquidity of corporate bonds to the basis between the credit default swap (CDS) price of the issuer and the par-equivalent corporate bond yield spread. The liquidity of a bond is measured using a recently developed measure calledlatent liquidity, which is defined as the weighted average turnover of funds holding the bond, where the weights are their fractional holdings of the bond. We find that bonds with higher latent liquidity are more expensive relative to their CDS contracts, after controlling for other realized measures of liquidity. However highly illiquid bonds with high default risk are also expensive, consistent with limits to arbitrage between CDS and bond markets, due to the higher costs of “shorting” illiquid bonds. Additionally, we document the positive effects of liquidity in the CDS market on the CDS-bond basis. We also find that several firm-level variables related to credit risk affect the basis, indicating that the CDS price does not fully capture the credit risk of the bond.
JEL Classification: G100 (General Financial Markets)
1
Introduction
Corporate bonds are amongst the least understood instruments in the US financial markets. This is surprising given the sheer size of the US corporate bond market, about 3.6 trillion dollars out-standing as of March 2008, which makes such bonds an important source of capital for US firms. These bonds carry a risk of default, and hence command a yield premium or spread relative to their risk free counterparts. However, the academic literature in finance has been unable to explain a significant component of corporate bond yields/prices in relation to their Treasury counterparts, despite using a range of credit risk pricing models and calibration techniques.
Prior studies have noted that although default risk is an important determinant of the yield spread, there are other factors such as liquidity, taxes, and aggregate market risk variables (other than credit risk) that may also play a significant role in determining the spread. Of these other factors, it has been conjectured that liquidity effects have an important role to play in the pricing of corporate bonds, and are reflected in the non-default component of their yields, i.e. the portion of the corporate bond yield that cannot be explained by factors related to default risk.1 Unfortunately, the non-default component of corporate bond yields/prices has been inadequately studied, largely due to the paucity of data. In particular, the absence of frequent trades in corporate bonds makes it difficult to compute trade-based measures of liquidity relying on quoted/traded prices or yields to measure liquidity, as has been done in the equity markets. It is difficult, therefore, to measure the liquidity of corporate bonds directly. Consequently, it is a challenge todirectly study the impact of liquidity on corporate bond yields and prices, thus leaving the discussion of corporate bond spreads somewhat incomplete.
In recent years, the credit default swap (CDS) market has emerged as the barometer of the market’s collective judgment of the credit risk of the bonds issued by an obligor. The CDS price is thus a proxy for the premium attached to credit risk, although it may itself be affected by market frictions, as discussed later on in the paper.2 In this paper, we study the CDS-bond basis, the difference between the CDS price of the issuer and the par-CDS equivalent spread of the bond, as a (somewhat imperfect) measure of the non-default component of the bond yield.3 In this paper, we relate the CDS-bond basis, which is a noisy measure of the non-default component of bond yields, to bond liquidity and other variables such as the bond characteristics, firm-level credit risk effects and liquidity in the CDS market itself. There are several significant contributions we make in this study.
1
See, for example, the discussion below on papers by Longstaff et al. (2005), Elton et al. (2001), Eom et al. (2003) and others.
2The CDS price is often referred to buy market participants as the CDS “spread” since it is seen to be analogous
to a spread over LIBOR.
3The par CDS-equivalent spread is the spread of a hypothetical CDS contract that has the same default probability
and recovery rate as implied by the price of the bond, and more accurately captures the economic value of the basis, than the simple difference between bond yield spreads and the CDS price, which could be affected by coupon payments and the level of the risk free rates.
First, we use and further validate a new measure of bond liquidity, called latent liquidity, proposed by Mahanti et al. (2007), which is based on the holdings of bonds by investors, and thus does not require a large number of observed trades for its computation. This measure weights the turnover of the funds that own the bond by their fractional holdings; thus, it is a measure of the accessibility of a bond to market participants. The attractive feature of this measure is that it circumvents the problem of non-availability of transaction data for corporate bonds, and yet provides a reasonable proxy for liquidity. We show that our measure has explanatory power for the liquidity component of the CDS-bond basis, even after controlling for trading volume and other bond characteristics such as age, coupon and issue size, that have been associated with bond liquidity.
Second, we show that even after controlling for credit risk using the price of the CDS contract, corporate bond prices are still affected by factors related to the default risk in the firm. Since the CDS contract is essentially a derivative contract on the reference corporate bonds, the presence of such effects is indicative of frictions between the corporate bond market and the CDS market. We find that the effect is one sided - when firms are riskier, their corporate bonds tend to be relatively expensive. Furthermore, it is the illiquid bonds of riskier firms that are more expensive relative to their CDS contracts. Our interpretation is that this conclusion is due to the effects of limits to arbitrage. Agents participating in the CDS market and the corporate bond market may have different valuations for the credit risk of the obligor. However, arbitrageurs who try to profit from this difference may find it difficult to sell corporate bonds short, because of limited supply in the borrowing and lending market for corporate bonds.
Third, we show that the liquidity of the CDS contract influences both the liquidity of the bond and the bond price itself. We use bid-ask spreads, both in basis points and as a percentage of the mid-quote, as measures of CDS liquidity. Bonds of issuers whose CDS contracts enjoy greater liquidity tend to be more expensive (have lower yields) in the cross-section, compared with their less liquid counterparts, after adjusting for various bond characteristics. This is evidence of some spillover effects from the CDS market to the corporate bond market.
Fourth, we demonstrate the effect of individual bond characteristics, such as the presence or absence of covenants and differences in tax status, once bond prices after credit risk in the form of the CDS price is controlled for. To our knowledge, this is the first study that studies the effect of bond covenants on bond valuation, using the CDS price as a control for credit risk.
In addition to the points mentioned above, we analyze and confirm several relationships doc-umented in the literature about the effect of factors like coupon, amount outstanding and age on the liquidity of bonds, using a much more current and extensive data-set than has been used in previous studies.
The novel bond-liquidity measure that we use in this paper is related to the theory proposed by Amihud and Mendelson (1986) according to which, in equilibrium, assets with the lowest transaction
costs are held by investors with the shortest trading horizon, and have higher prices. Our metric can thus be thought of as a direct measure of the activity of funds holding a particular bond. It is also related to the literature on liquidity and asset prices, most notably Vayanos and Wang (2006), who use a search-based model to provide for an endogenous concentration of liquidity in particular assets. This concentration leads to active investors participating in these assets, thus lowering transaction costs and leading to higher prices at the same time. In this sense, our measure can be thought of asdirectly measuring the extent of search frictions when the marginal holders of a particular bond wish to trade.
Our bond price data come from transacted prices and volumes as reported on the Trade Re-porting And Compliance Engine (TRACE) system assembled by the Financial Industry Regulatory Authority (FINRA)(formerly known as the National Association of Securities Dealers (NASD)). Introduced in the second quarter of 2002, TRACE has, over time, come to represent the most comprehensive database of all (TRACE-eligible) corporate bonds that are traded in the U.S. mar-ket. Our CDS price data are obtained from two different sources, Credit Market Analytics (CMA) DataVision and GFI Group Inc. We use the CDS bid and ask prices as reported on Bloomberg by CMA DataVision, after October 1, 2004, when they became available from this source. In order to extend the series backwards to the extent possible, prior to October 1, 2004, we use data from GFI Group Inc., the largest institutional broker in the CDS market. We conduct tests to ensure consistency between the two series, in the period where there was an overlap between them, as discussed in section 3 below. We compute latent liquidity using a database of corporate bonds assembled by State Street Corporation (SSC), one of the largest custodians in the global markets. This paper is divided into the following sections. Section 2 reviews the literature from the point of view of our measure. Section 3 describes our data sources. Section 4 discusses the latent liquidity measure proposed by Mahanti et al. (2007) and the manner in which we compute the CDS-bond basis. Section 5 discusses the results of our study explaining the basis in terms of liquidity metrics of the bond and CDS markets, as well as firm and bond characteristics. Section 6 concludes.
2
Literature Review
This paper is related to the considerable volume of literature that attempts to describe the effect of liquidity on asset prices. Most of this literature relates to the concept of liquidity costs and associated liquidity premia in stocks, although there is a some recent literature that deals with corporate bonds. While a comprehensive survey of this literature is beyond the scope of this study, we touch upon a few contributions that underpin the prevailing academic perspective on the effects of liquidity on asset prices.4 In an early contribution in this area, Amihud and Mendelson (1986) argue that transaction costs result in liquidity premia in equilibrium, reflecting the differing
4
The literature on liquidity effects in the broad context of asset pricing is too vast for us to detail here. See Amihud et al. (2006) for a comprehensive survey.
expected returns for investors with different trading horizons who have to defray their transaction costs. There is an implicit clientele effect due to which securities that are more illiquid, and are cheaper as a result, are held in equilibrium by investors with longer holding periods. This work has been extended and modified in different directions over the years.5
A closely related branch of literature has to do with modeling liquidity costs in corporate bonds. The earliest study of this nature is by Fisher (1959), who uses the amount outstanding of a bond as a measure of liquidity, and the earnings volatility as a measure of the credit risk of the firm, and finds that yield spreads on bonds with low issue sizes (illiquid bonds) are higher. Also notable is a recent paper by Chen et al. (2007), who provide a method for estimating transaction costs in the corporate bond market and apply it to corporate bonds. Our paper uses more detailed data on the institutional holdings of bonds to construct an alternative measure of liquidity, called latent liquidity, which can be used even in the absence of transaction data. The relationship between this measure and transaction costs as well as market impact has been demonstrated by Mahanti et al. (2007).
There have also been several attempts to decompose the yield spread on corporate bonds in terms of the component that is related to the defaultable nature of these securities, as opposed to other factors. For instance, Eom et al. (2003) and Huang and Huang (2003) use structural models to explain the spreads on corporate bonds and find that most structural models are only able to explain about half of the corporate bond spreads for a range of reasonable parameters assumed for the firm value process. Elton et al. (2001) find evidence of a significant coupon effect in corporate bonds which they attribute to the differential treatment of coupons on corporate bonds relative to Treasury securities.
An important related paper in this strand of the literature is by Longstaff et al. (2005), who fit a common model of credit risk to both corporate bonds and to credit default swaps. Assuming that the CDS price completely captures the default-related part of the corporate bond yield, they find evidence of a significant non-default component in the yield spread and are able to relate it to the coupon as well as variables that are related to the liquidity of a bond, such as the amount outstanding (in the cross-section), bid/ask spreads, and the liquidity premium for on-the-run treasury securities in the time series. Blanco et al. (2005) take another approach to the problem by studying the co-integration relationship between corporate bond spreads and CDS spreads. They document the presence of a strongly mean-reverting, non-default component in corporate bond yields. They also find, based on their model of information flows, that the CDS market leads the corporate bond market, and that most of the corrections introduced by this lead-lag relationship take place through the non-default component of corporate bond yields. Our paper adds to this literature by examining the role of liquidity more closely. We also examine whether frictions in the arbitrage process between bonds and the CDS contracts cause the CDS contract to
5
capture the underlying credit risk less than completely.
Another strand of the literature that is pertinent to our research here is the work on measures of liquidity that are appropriate for the corporate bond market. Some papers that study liquidity effects using transactions based data on bonds include Chakravarty and Sarkar (1999), Hong and Warga (2000), Schultz (2001) and Hotchkiss et al. (2002). More recently, Houweling et al. (2005) use liquidity-sorted portfolios in the European market, constructed using nine proxies for liquidity including issued amount, listing, currency, on-the-run or not, age, whether there are missing prices, yield volatility, the number of quote contributors, and yield dispersion. However, it is not clear that these approachesdirectly control for the credit risk of the bond, as efficiently as the CDS market.
The concept of latent liquidity that is used in this paper draws from Mahanti et al. (2007). La-tent liquidity is simply the weighted average turnover of the funds holding a particular bond, where the weights are the fractions of the outstanding amounts of the bond that are held by any given fund. They introduce this measure of liquidity and relate it to bond-specific characteristics, such as maturity, age, coupon, rating, the presence or absence of put/call options and other covenants. They also show that latent liquidity has explanatory power for both transaction costs and market impact.
3
Data Sources
Our primary source of data for prices and realized liquidity measures for the corporate bond market is the Trade Reporting and Compliance Engine (TRACE) database of FINRA. We first calculate the volume-weighted average price of a bond on any given day after eliminating cancellations and trade reversals from our data. In order to limit contamination by off-market trades, we consider only days when the total traded volume is greater than USD 100,000. We obtain details of bond characteristics such as coupon, issue date, maturity and issue size from Bloomberg, and match them with the TRACE data by their Committee on Uniform Securities Identification Procedures (CUSIP) number. We confirm the reported yield on the bond by performing our own yield computation and eliminating those observations for which our calculations and the reported yields differ substantially. Unlike Longstaff et al. (2005), who restrict their sample to bonds around a five-year maturity, we include bonds of all maturities but include a control for maturity in our computations. From the TRACE data, we also compute the number of trades in a quarter, the number of traded days in a quarter and the total dollar amount of any bond traded within a given quarter.
In order to compute our measure of latent liquidity, we use the corporate bond holdings and transactions database of the State Street Corporation (SSC), one of the largest custodians in the global financial markets. A custodian provides trade clearance, asset tracking, and valuation service support to institutional investors. The client of the custodian is the fund, i.e., the owner of the asset, which may deal with diverse broker-dealers. All these trades are cleared through the custodian, who thus has access to information about a larger number of trades than an individual
broker-dealer. In addition, custodians have access to information on whoholds the corporate bonds, and these data permit the construction of the latent liquidity measure that we employ in this research. Our database contains the end-of-quarter holdings information on all the bonds in our sample, based on which the latent liquidity measure is computed. The database covers around 15% of all bonds traded in the US markets and is reasonably representative of the overall US corporate bond market, as we show below.6 A brief description of the construction of the latent liquidity measure is presented in section 4.
Our CDS data are derived from two separate sources. Prior to October 2004, we use CDS prices supplied by GFI Group Inc, the leading broker in the CDS market.7 The database covers over 1,000 leading corporate names on which credit protection is bought or sold on a fairly regular basis. It includes daily prices for CDSs for the period from April 1999 to July 2005. Since October 1, 2004, a much wider coverage of CDS names is available from CMA DataVision via the Bloomberg data service, in a reliable fashion. These data cover over 2,000 issuers on whom CDS contracts are traded, and subsequent to this date, we, therefore, use these quoted CDS prices (both bid-, ask-and mid-) for our basis computation. During the period in which the two data sources overlap, we confirm that they are substantially in agreement. This gives us confidence that our results prior to October 2004 are comparable to those after October 2004. We also confirm this conclusion by performing robustness checks by conducting our empirical analysis on the sub-sample after October 2004. (This evidence is presented in table 10.)
There are several advantages to using our combined data-set relative to the those used in prior research:
• Our dataset covers a longer time period than has been covered by previous studies. Most notable amongst these studies is the one by Longstaff et al. (2005), which uses a proprietary database of CDS prices that covers 52 firms over a much shorter time period (from March 2001 to October 2002). The data-set used by Blanco et al. (2005) covers only 33 firms from Jan 2001 to June 2002. Our combined database covers 1,167 firms and 4,972 bonds over the period July 2002 to June 2006, with a total of 33,000 bond-quarters.
• There have been significant changes in the market for corporate bonds with the advent of hedge funds and credit derivatives over the last ten years. Our data-set covers the latter half of this period, and thus, includes more recent data. This is in contrast to the data used by many of the previous studies on corporate bond yields, which are, in many cases, based on the Warga (1997) Fixed Income Securities Database, which contains data prior to 1996, and has data on about 700 bonds.8
6For a detailed exposition and analysis of the representativeness of the database, please refer to Mahanti et al.
(2007).
7More information about GFI and their CDS database is available at http://www.gfinet.com. 8
• Our data-set contains quotes by a large number of CDS market-makers, and is thus quite inclusive and reliable.
Data on interest rates, such as swap rates and treasury rates, are obtained from Datastream. These data are also matched by date with those for corporate bond and CDS trades in our data-set. In order to focus on the pricing of corporate bonds relative to the CDS contract, we restrict our attention to data on days on which we observe at least a quote, if not a trade, inboththe CDS market and trades in the corporate bond market. This eliminates, as far as possible, timing mismatches in the data, and accurately captures the effect of time variation in the default risk inherent in the bond. For each bond, we also obtain data on the corresponding bond characteristics, such as coupon, rating, outstanding volume, and bond-specific features such as covenants, tax status and issuance methods from Bloomberg.9
Additionally, we match the firms in the Compustat quarterly database by ticker and name with the bonds available in the TRACE database. This allows us to compute firm-level financial ratios such as leverage and the proportion of tangible assets that we might expect to have a significant bearing on the credit risk of the firm. In cases where data are not available quarterly, we use data available as of the previous financial year. In order to account for reporting delays and ensure that the information is available to the market participants at the time of the trade, we use data from the quarterprior to the one for which we compute the basis and the liquidity measures.
Table 2 shows the decomposition of the sample by credit rating. The sample is reasonably representative of the overall composition of the corporate bond market. It also shows the rating distribution in the holdings database as well as the overall universe. The top four rating categories account for around 74% of all corporate bonds outstanding, which suggests that the sample is biased toward investment grade issues. The sample is broadly similar to the samples used in prior studies of the corporate CDS market, but with many more observations, both cross-sectionally and over time.10
4
Methodology
4.1 Latent Liquidity
In this section, we describe in brief the methodology used to compute the latent liquidity measure. In simple terms, latent liquidity is the weighted average turnover of the investors holding a particular bond, the weights being the fractions of the total outstanding amount of a bond held by various funds at the beginning of the month.11 The argument behind this computation is that since there
9
In the empirical estimations, we follow the numerical scheme used by Compustat to assign numbers to ratings, where AAA is coded as 1, AA+ is coded as 2 and so on.
10
See, for example, Blanco et al. (2005) and Longstaff et al. (2005).
11For a more detailed description of the computation, as well as the relationship between latent liquidity and bond
is considerable persistence in turnover, bonds that are held by investors that have a larger turnover are likely to be more accessible and hence more highly traded. Mahanti et al. (2007) show that this measure of latent liquidity is correlated with other transaction-based measures of liquidity, such as trading volume and bid-ask spreads, in the relatively liquid segment of the market where reliable micro-structure based data are available. However, the advantage of the latent liquidity measure is that it does not require trade-based information, and is thus available ex-ante for a broader cross-section of bonds.
Letπj,ti denote the fractional holding of a bond i,i= 1,2, ...I, by fund j,j= 1,2, ...J, at time t. Let Tj,t denote the average portfolio turnover of a fund in the months from t to t−12, where turnover is defined as the ratio of the dollar trading volume of the fund between timetandt−12 to the value of the fund at timet. The latent liquidity measure for bond iat timet is simply defined as: Lit= J X j=1 πj,ti Tj,t (1)
We use equation 1 to compute a quarterly value for the latent liquidity of each bond in our sample, expressed in annual turnover terms. Note that, in this sense, the latent liquidity of the bond indicates the average trading frequency of the agents holding the bond, and consequently, the ease with which it may be traded in the presence of search frictions.
4.2 The Basis between CDS prices and Bond Prices
The recent academic literature on corporate bond pricing has attempted to isolate the component of corporate bond yields that isnot attributable to default risk (the non-default component). Most of the earlier papers in this area use an explicit model for pricing credit risk.12 However, the advent of the CDS market makes it possible to isolate default risk in corporate bonds issued by a certain issuer without relying too heavily on a particular model of credit risk and a specific parameterization, since a direct reading of the market’s pricing of credit risk is available. Most CDS contracts specify a particular reference asset, but allow for settlement by physical delivery of other similar obligations of the same issuer.13 Hence, since CDS contracts price default risk explicitly, they are a good benchmark for the pure credit risk of the firm, and hence apply to all its traded obligations. Indeed, as argued by Duffie (1999), to a first-order approximation, there is an equivalence between the CDS price and the spread on the floating rate obligation of a similar maturity issued by a firm. It must be noted that most corporate bonds issued by firms tend to be
12For example, see papers by Huang and Huang (2003) and Eom et al. (2003). 13
There are some recent moves to switch to cash settlement, rather than physical delivery, to avoid the possibility of a squeeze on the reference bond.
fixed-rate bonds, and thus, this equivalence does not hold exactly. More importantly, as shown by Longstaff et al. (2005), the pure corporate bond spread is a biased measure.
This equivalence is further complicated by differing definitions of the CDS contract, especially in the early years of our sample period. However, with the increasing use of standard International Swaps and Derivatives Association (ISDA) agreements between counter-parties, this is less of a problem in recent years. Even so, the problem of delivery terms remains. In case of a default, a typical CDS contract requires the delivery of the reference obligation (or a similar obligation) in exchange for face value. However, if the deliverable bonds are illiquid, the buyer of the CDS protection who needs to deliver them may incur an additional liquidity cost to source the bonds in the market. This is particularly true when there are frictions in the arbitrage mechanism between the CDS contract and the bond, primarily due to the costs of “shorting” the bond. In addition, the bond that is deliverable into the CDS contract would be the cheapest among the candidate bonds; hence, the other bonds would trade at a price premium or yield discount to the cheapest-to-deliver bond.14
Subject to the above caveats, there are different approaches to isolating the non-default part of the corporate bond spread, which could then be related, at least in part, to liquidity effects. One possible approach is to use the difference between the CDS price and the simple corporate bond yield as a model-independent (albeit noisy) proxy for the non-default component of the corporate bond yield spread. However, this approach may lead to errors for two reasons. The first is due to the definition of the CDS contract, which offers protection equivalent to the difference between the post-default market value of the bond and the face value of the bond. Thus, a bond that is trading substantially below or above par before default cannot be effectively hedged by a single CDS contract. Also, the protection buyer has the option to deliver the cheapest of several candidate bonds, which may affect the CDS-bond basis of the other deliverable bonds. The second is because of market frictions, particularly relating to the costs of short selling a bond, which may render the CDS price a noisy, and perhaps even biased, measure of credit risk.
A second approach, proposed by Longstaff et al. (2005), is to apply a theoretical model of credit risk to price both the CDS and the corporate bonds simultaneously. This latter method has the advantage that any potential biases are addressed explicitly. However, the procedure is dependent on the choice of the credit risk model. The literature on credit risk models demonstrates that there remain significant pricing errors in all the models that have been used so far.15
Most market participants use a third method called the par-equivalent CDS spread of the bond, in order to compute the basis. This method adjusts for deviations of the bond value from par value so as to make the spread of the bond comparable with a CDS contract. We use this method in
14This problem exists even with cash settlement, since the settlement price is established based on polling dealers
for quotes. See Jankowitsch et al. (2007) for details.
this paper.16 The method is model-independent in the sense that it does not require the explicit calibration of a model of credit risk because it assumes that the term structure of credit spreads is flat. While this assumption could affect our results, CDS contracts are often not available for a maturity point other than five years for many of the issuers in our dataset. Hence, controlling for the slope of the term structure using CDS contracts of other maturities would involve a drastic reduction in the size of the sample by biasing it toward the most actively traded issuers. Instead, we control for maturity effects by including a control for maturity in our regressions. Details of the methodology for computing the par CDS equivalent spread are provided in Appendix A. According to our methodology, the CDS-bond basis is defined by the following equation:
Basis=CDSactual−CDShypothetical
whereCDSactualis the actual market spread of a CDS contract on a given issuer, andCDShypothetical is the spread on a hypothetical CDS contract at par that has the same default risk and recovery rate as implied by the price of a risky corporate bond issued by the same issuer.
Following Grinblatt (2001) and Longstaff et al. (2005), as well as standard market practice, we use the USD-LIBOR swap curve as a measure of the risk-less rate in our par-equivalent spread computation, i.e., the spread between the yield on a par-equivalent bond and the benchmark rate.17 This curve is available from Datastream. We linearly interpolate between points on the swap curve to obtain the corresponding discount factors at semi-annual intervals, for the purpose of computing the par-equivalent spreads.
An important issue for us to address here is the issue of shorting costs. When the CDS-bond basis is negative, an appropriate arbitrage strategy would involve holding the bond and buying protection on it through the CDS contract to maturity. This has the effect of hedging away the credit risk in the bond, while earning the non-default component, absent liquidity costs. On the other hand, if the basis is positive, the arbitrage strategy involves “shorting” the bond and selling protection on it through the CDS contract. Selling corporate bonds short is costly because corporate bonds are difficult to “find” in the securities borrowing and lending market.18 Typically, a rebate rate is paid on the cash collateral that is used to borrow a bond, and if this rebate rate is less than the repurchase rate on general collateral in the market, it constitutes a cost to an agent that shorts
16We ignore differences between day count conventions between corporate bonds and the CDS contracts. Accrued
interest on corporate bonds is usually computed using the NASD’s 30/360 convention, while that on CDS contracts is computed with an actual/360 convention. This difference is, on average, less than 1 basis point and applies to all corporate bonds. Thus, it would be absorbed in the constant term in our regressions. In any event, the coefficients of the independent variables in our regressions will not be systematically biased due to this approximation.
17In previous drafts of the paper, we used both the swap curve and the US Treasury curve as benchmarks. While
the results for the two alternative benchmarks are qualitatively similar, liquidity effects in the Treasury curve may themselves affect our results. The disadvantage of using the swap curve as a benchmark is that swaps themselves carry some credit risk, and hence, may slightly underestimate the credit spread implied in the corporate bond yield. We believe that the latter is likely to be a smaller effect than the liquidity effect in the US Treasury curve.
18
a bond. The shorting cost is priced into the bond, and constitutes a price premium.
From the above discussion, it would be useful to account for shorting costs, particularly when the basis is positive, in our analysis. We were able to obtain access to a data-set for realized borrowing costs; unfortunately this data-set covers only a small part of our sample period and our analysis was somewhat restricted. However, in this limited sample, we find that “shorting” corporate bonds is almost always costly, with an average shorting cost of 0.31% (calculated as the difference between the general collateral (GC) rate and the rebate rate on a bond). Shorting costs are typically high when there are supply constraints, due to lack of deliverable bonds in the face of a large “shorting” demand, which might occur when firms are in distress and have high CDS spreads. Since these costs can be quite high, we would expect the basis to be incorporated into the yield, and hence the CDS-bond basis, ex-ante.
Since we do not have data on shorting costs for our entire sample, it is difficult to directly analyze the impact of shorting costs on the CDS-bond basis. Instead, we present indirect evidence that these costs may be significant, especially for illiquid bonds that are risky. Since illiquid bonds are likely to be difficult to sell short, illiquid bonds issued by firms that are close to default are likely to be more expensive than bonds that are liquid. In section 5.5 we show that this is indeed the case when we measure risk using a number of variables related to default risk. concerned.
4.3 Liquidity in the CDS market
As argued earlier, the CDS price-bond yield spread basis may reflect the relative liquidity of the corporate bond versus the corresponding CDS. To the extent that the absolute liquidity of the bond market is what gets priced into the corporate bond yields, it is necessary to account for the liquidity in the CDS market. As stated earlier, the intuition behind this argument is that the negative CDS-bond basis represents an investor’s expected return from a strategy that involves holding a long position in the bond and buying protection on the issuer in the CDS market. Such an investor is exposed to potential illiquidity in both the CDS and bond markets; for unwinding the trade, the investor has to find a counter-party to sell the bond and the CDS. Therefore, in order to account for the liquidity of the CDS market, we study measures of CDS market liquidity that have an indirect effect on the corporate bond prices, in addition to bond-specific liquidity. The reason the CDS liquidity has an indirect effect on the bond price is because when the CDS market is illiquid, it is difficult to execute a negative basis trade. This would reduce the demand for a bond, which investors would have bought in a negative basis trade and potentially reduce its price, and decreasing the basis further.
Since the CDS market is fairly liquid, we are able to use transactional measures of liquidity. One measure of CDS market liquidity is the bid-ask spread. The other is the bid-ask spread normalized by the CDS mid-price. These two measures have somewhat different implications for transaction costs. If the bid-ask spread is highly correlated with measurement errors in the CDS prices, it is
likely to lead to a spurious coefficient when used by itself. On the other hand, the percentage bid-ask spread is likely to ignore potentially important relationships between CDS prices and liquidity. We use both the absolute and the percentage bid-ask spreads in our estimation. Additionally, when the credit markets are highly volatile, there is a considerable amount of arbitrage risk involved in a CDS-bond trade. As a proxy for this risk, we use the standard deviation of CDS price changes during the quarter as a CDS market volatility measure that might affect the basis.
4.4 Firm-Specific Effects
If there are no frictions in the CDS and the bond markets, all information regarding default and recovery rates should be incorporated in both the CDS price and the bond yield spreads. Hence, we would not expect the CDS-bond basis to depend on firm-specific variables. However, there are significant frictions in the bond market. On an average, bonds trade with much lower frequencies than the CDS contracts, and as shown by Blanco et al. (2005), changes in bond yield spreads lag changes in CDS spreads. While this statement applies to the yield spreads and hence the basis on any given date, we expect the effects of these lags to be mitigated when we study theaverage basis over any long term horizon such as a quarter.
On the other hand, if there are structural reasons which cause the basis to be biased in one direction, we could expect variables related to credit risk to affect the basis, even over a longer period. There are four possible structural reasons that might lead to a persistent bias in the CDS-bond basis:
• The first has to do with the definition of the contracts. Since a buyer of CDS protection gets a payoff equal to the face value of the bond on default, he stands to lose or gain depending upon whether the bond is trading at a premium or a discount. This means that relative to the market values of those bonds, recovery rates on those bonds are implicitly different. The computation of a par-equivalent CDS yield spread for the bond mitigates this problem to some degree. Hence, we would not expect the basis to be systematically affected by whether a bond is trading at par, or is at a premium or a discount, or by firm-level variables.
• The second stems from the fact that the arbitrage between the bond and the CDS contract is frictionless only in one direction; while it is easy to buy protection and take a long position in a bond, sellers of protection through the CDS contract can only hedge their exposures through a costly process of “shorting” the corporate bond, driving to a wedge between the corporate bond yield spread and the CDS spread. This is likely to be exacerbated just prior to default, because the demand for the bond from those intending to deliver it into the CDS contract may outstrip supply, particularly during times of financial distress. This effect, together with normal “shorting” frictions are likely to make “shorting” even more difficult. Since investors rationally anticipate this, the price of the bond relative to the CDS contract
is likely to be high. Moreover, we would expect the basis itself to be higher during times when default becomes more likely. This is one possible mechanism through which firm-level credit variables can be expected to affect the basis. A variable that proxies for higher default risk is likely to cause the bond to be more expensive relative to the CDS, thus increasing the basis. Additionally, we would expect that firms that face less uncertainty about their recovery values in the event of default, such as firms with high levels of tangible assets, would have lower shorting costs, and hence, a lower CDS-bond basis.
• A third explanation, which is somewhat related to the above point about shorting costs is that diverse agents operate in the two markets and can become capital-constrained at different times.19 Economically, selling protection through a CDS contract is equivalent in terms of
risk exposure to buying the bond. If a default event causes sellers of protection to become capital-constrained to a greater extent than investors that typically have a long position in the corporate bond, then “shorting” frictions will make it impossible for prices between the two markets to equalize. If investors anticipate this ahead of time, bond prices will again be higher than those implied by CDS prices. Note, however, that the difference between this and the previous explanation is aboutwhich market correctly incorporates information about default risk and recovery rates. However, both explanations have the same implication for the CDS-bond basis.
• The fourth reason is that there is typically a cheapest-to-deliver option implicit in the CDS contract. The price of the cheapest-to-deliver bond is likely to track the CDS price most closely.20 Since, by definition, other bonds are more expensive, their bases are positive, relative to the cheapest-to-deliver bond. Bond prices may have a wider dispersion when there is greater heterogeneity in investor beliefs about firm value, particularly just prior to default, and for firms that have lower levels of tangible assets. Even with respect to the cheapest-to-deliver bond, the CDS price may be higher, reflecting the optionality available to the buyer of protection. Thus, for all bonds, this optionality again has the same implication for the CDS-bond basis as the above three other explanations.
If the above factors are true, it is possible that firm-specific variables will also affect the basis. To test this hypothesis, we use firm-specific data relating to the issuer of the bonds. We collect data on firm-specific characteristics by matching the available bonds in our sample by their ticker symbol with firms in the Compustat quarterly database. A wide variety of firm variables have been used in the literature on default and recovery rates.21 If markets were frictionless, we would
19
See, for example, the detailed arguments developed by Brunnermeir and Pedersen (2006)
20For an exposition on issues related to the pricing of the cheapest-to-deliver option in CDS contracts, refer to
Jankowitsch et al. (2007)
21While an exhaustive list of these effects is beyond the scope of this study, the reader is urged to refer to Acharya,
not expect these variables to affect the basis, since the CDS price is a more direct proxy of credit risk than a lagged financial ratio. If, on the other hand, the basis reflects residual credit risk not captured by the CDS spread for structural reasons, these financial ratios may have an effect on the basis. The firm-specific variables that we use in our study, also used commonly in credit analysis, to proxy for the likely frictions in the arbitrage process in the process of “shorting” the bond are:
1. Leverage: The firm’s financial leverage measures the fixed obligation of the firm and is a likely predictor of financial distress. We define the leverage as the ratio of the book value of debt to the sum of the book value of debt and the average market value of equity during a quarter.
2. Tangible Assets: Recovery rates on firms with a higher proportion of tangible assets are believed to be higher than those with a lower proportion of tangible assets.22 Accordingly, we include the proportion of property, plant and equipment to total assets in the firm as the proxy for the tangibility of a firm’s assets. A higher level of tangible assets implies a higher recovery value in case of default.
3. Current Ratio: Leverage is associated with the long term credit risk of the firm. However, firms may default on their obligations because they are unable to meet their liabilities in the short term. To control for this effect, we use the current ratio - the ratio of current assets to current liabilities (including any debt maturing within the year). A higher current ratio implies a lower likelihood of default, and higher recovery rates, in the short run.
A point to note here is about financial firms, which are regulated and have high levels of leverage. An important element of the regulatory framework in financial markets is the implicit obligation by regulators to step in when a financial crisis unfolds, to prevent financial contagion. This implicit guarantee makes financial firms different from firms in other industries in so far as the high levels of leverage do not necessarily have the same impact on the credit risk of financial firms compared with firms in other industries. In regressions that use firm-specific variables, we exclude firms in the financial services industry from our sample, using their SIC classification. This corresponds to reducing the size of our sample by about 50%.
4.5 Covenants and other bond characteristics
The presence or absence of specific covenants in the bond has an important implication for the basis. In a frictionless market, the CDS market should price in the effect of the covenants on the cheapest-to-deliver reference obligation issued by the entity. However, different bonds issued by the same obligor may vary in terms of the extent of protection they offer in case of default, due to the presence or absence of covenants. Hence, these convenants may affect the relative prices of the
22
bonds. Additionally bonds with different levels of protection may behave quite differently in the case of non-default corporate events such as a leveraged buy-out or an acquisition. For example, leveraged buy-outs hurt sellers of protection on the CDS contract because they make default more likely. However, holders of bonds may be protected in terms of their seniority vis-a-vis new debt issued by the acquirer. There may also be features like special put options which allow investors to sell back the bonds to the issuer in case of an acquisition.23
In addition to covenants, there may be other bond characteristics that might cause differences in their tax-status and/liquidity. For instance, exchange-listed bonds may be more liquid than those that are unlisted. In addition, they may be subject to additional regulatory oversight. Alternatively, some bonds, such as those subject to the European Union savings tax directive may have a different tax status compared to others.
To address these issues, we obtain an extensive list of covenants and other binary bond char-acteristics from Bloomberg, and use them in the form of dummy variables for the presence or absence of a specific covenant. The dummy variables we use, along with their definitions are listed in Appendix A. We also include a column for the likely effect we expect these dummy variables to have on the basis, and a brief explanation for why we expect such an effect.
4.6 Summary Statistics
Table 3 presents the summary statistics for the sample of bonds that we obtain after the filtering process, averaged at the level of the bond. The variables are grouped under three categories: bond variables, CDS variables, and firm variables. It can be seen that there is considerable variation in both the latent liquidity measure and the trading volume of the bond (the two main liquidity variables that we use in the bond market), as well as the CDS-bond basis. The latent liquidity of bonds in our sample varies between 0 and 10.78. The mean latent liquidity is 0.32 per year, with a standard deviation of around 0.47 per year. The number of trades per quarter ranges from a minimum of one trade to a maximum of around 28,000 trades, with a mean of 226 trades per quarter. The bonds in our sample range from newly issued bonds to twenty-year old bonds, with an average age of around four years and an average maturity of around seven years, while the ratings range from the highest grade (AAA) to bonds that have defaulted or are no longer rated.
There is significant variation in the CDS bid-ask spreads, ranging from almost zero to around 29%, indicating that there can be severe liquidity constraints in the CDS market. The firms in our sample range from those that have no leverage in the previous quarter, to those that are highly levered with a leverage ratio of almost 1. On an average the firms are financed by about 36% debt. We also see a significant variation in the current ratio, from 19% to 1,182% and the proportion of the firm’s fixed assets, from firms that have virtually no fixed assets to firms that almost entirely
23The presence of such covenants may also create situations where the CDS contract is “orphaned” due to the
consist of fixed assets (94%).
5
Results
5.1 Bond Characteristics, Latent Liquidity and Other Liquidity Metrics
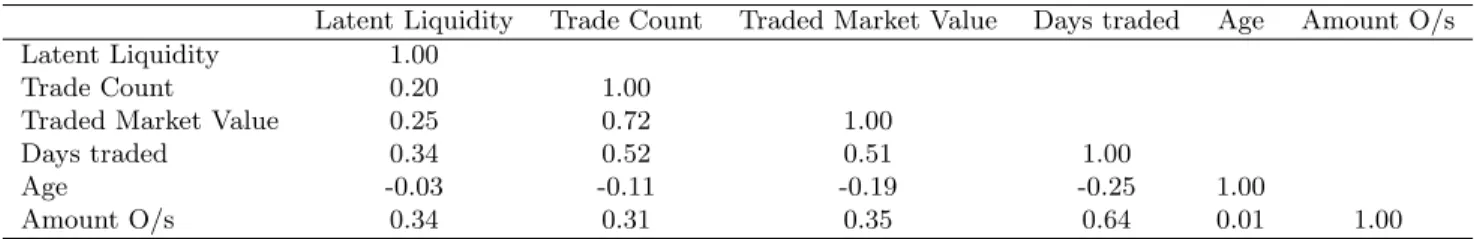
In order to study the relationship between latent liquidity and other bond-specific variables, we first look at the correlations between latent liquidity and other liquidity-related metrics such as the trading volume of the bond in any quarter, the number of days on which it is traded, and the number of trades in the bond, in addition to its issue size and age. The main aim of this exercise is to confirm that these empirical estimates agree with those presented in Mahanti et al. (2007) who use a much larger sample of bonds, many of which do not have CDS contracts associated with them. The correlations between these liquidity measures are shown in table 4.
We find that the age of the bond is negatively correlated with all the other liquidity metrics -as a bond gets older, its liquidity decre-ases. The correlations between the number of days traded, the number of trades and the volume traded are quite high, as is to be expected, since these are all measures of realized trading activity. The latent liquidity at the beginning of the quarter is also positively correlated with the measures of realized trading activity in the following quarter. In other words, the latent liquidity of a bond at the beginning of a period appears to predict the transaction-based measures of liquidity in the subsequent period.
Additionally, we perform pooled regressions using bond-quarter observations to study how latent liquidity is affected by bond-specific variables such as coupon, amount outstanding, rating, age, maturity, as well as CDS market-related variables such as the CDS price (to account for the effect of credit risk on the latent liquidity) and the CDS bid-ask spread (to account for the relationship between CDS market liquidity and bond market liquidity).
Table 5 shows the determinants of average latent liquidity for the bonds in our sample. It shows that the age of the bond is strongly negatively related to latent liquidity - older bonds have poorer latent liquidity. There are also some clear coupon effects. Higher coupon bonds seem to have higher latent liquidity as compared to lower coupon bonds. At the same time, bonds with poorer credit ratings tend to have higher latent liquidity. However, when we control for CDS market liquidity and firm-specific ratios related to credit risk, it appears that a poorer rating in itself leads to lower latent liquidity. We can also see that bonds with higher issue sizes tend to be more liquid, which is intuitively reasonable. Overall, our results confirm the findings of Mahanti et al. (2007), albeit for a smaller sample of bonds with CDS contracts traded on the issuer.
We next analyze thepercentage bid/ask spreads on the CDS contract, in order to investigate if cross-sectional differences in bond liquidity are driven by CDS market liquidity. We find that the percentage bid-ask spread on the CDS contract has some explanatory power for the latent liquidity of the bond. When the percentage bid-ask spread of the CDS contract is higher, the
bonds themselves tend to be less liquid. This is over and above the bond-specific liquidity variables that we mention above. Interestingly, leverage seems to be a strong determinant of latent liquidity. Bonds issued by highly levered firms tend to be held more by active investors than bonds of firms with lower leverage, indicating that there are credit clientele effects related to the trading activity of the agents holding those bonds. This could be because highly levered firms are generally financial firms, with large amounts of liquid debt outstanding.
5.2 Time-series Behavior of the Aggregate Average Basis
We first examine the behavior of the aggregate average basis across bonds in our sample and compare it with the aggregate average latent liquidity (the simple average of the latent liquidity of bonds included in our sample in any quarter) at the beginning of the period.24 This analysis helps us make qualitative statements about relationships between our various liquidity variables and the CDS market liquidity, at the aggregate level over time. This is equivalent to treating our sample as a portfolio and computing the average basis for every quarter, and similar averages of the other measures. An advantage of this approach is that errors in the measurement of latent liquidity for individual bonds are unlikely to be correlated across bonds. Hence, portfolio-level average latent liquidity is significantly less noisy than the latent liquidity of individual bonds.
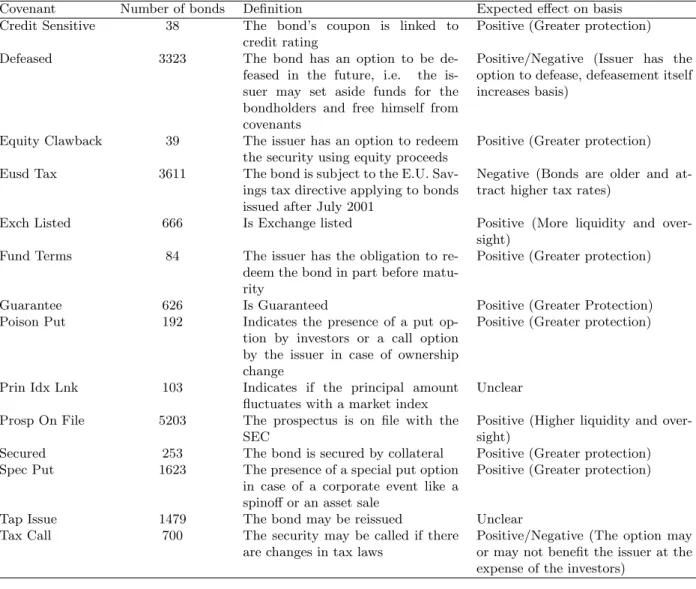
In this analysis, we restrict ourself to the data after January 1, 2003. This is because prior to this, the coverage of TRACE extends to only the most liquid bonds in the market, because of which average liquidity numbers for bonds are inflated. Additionally the standardization of the CDS contract definitions by the International Swap Dealers Association (ISDA) took place in January, 2003 and led to a significant increase in CDS market liquidity, and a consequent reduction in bid-ask spreads in CDS contracts. In our dataset, we observe this significant decrease, and therefore, do not include data before January 1, 2003.
Figure 1 shows the variation in the aggregate average basis over time, along with the average latent liquidity of the bonds in the sample at the beginning of the period, for each quarter July 1, 2002 to June 30, 2006. It shows that the average basis of bonds in our sample decreased over
24This measure has an intuitive interpretation in terms of the average turnover of funds. Summing equation 1
over all bondsi,i= 1,2, ...I, gives us:
Lt= PI i=1 PJ j=1π i j,tTj,t I = PI i=1 PJ j=1π i j,tTj,t I = PJ j=1Tj,t I (2) This is equal to the average turnover of funds under the assumption that the ratio of the number of funds to the number of bonds stays constant over time. It is a measure of aggregate corporate bond market liquidity. However, this does not necessarily hold for a sub-sample of bonds, such as ours.
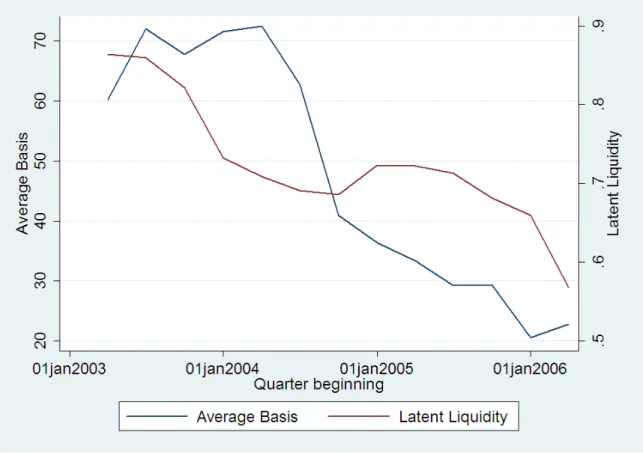
time, and so has the average latent liquidity of the bonds. The graph suggests that there is a positive correlation between the aggregate latent liquidity and the aggregate average basis of the bonds in our sample: when the aggregate average liquidity in the market is high, the bonds trade at lower yield spreads, relative to the corresponding CDS prices. Figure 2 shows the variation in the aggregate average basis in relation to the aggregate average trade count of bonds in a given quarter in our sample. While the figure suggests that there is a positive correlation between trading activity and the basis, the relationship seems to be less clear-cut for trade count than that for latent liquidity, suggesting that the latter variable is more informative about bond prices and yields.
5.3 Determinants of the CDS-Bond Basis
Section 5.2 suggests that there is a positive relationship between the aggregate average basis and aggregate average latent liquidity. Since latent liquidity is measured at a quarterly frequency, it is difficult to perform a time-series analysis separately for each individual bond, over a four-year period, especially when there are missing observations for some of them. Instead, we pool all the observations across bonds and quarters. In order to perform the regressions, we compute the average quarterly basis for each bond and match it with its latent liquidity at the beginning of the quarter, along with other bond-specific variables for that quarter. This gives us about 29,000 bond-quarter observations, with all bond-specific variables included, a small reduction in our sample, from the approximately 33,000 bonds we had prior to merging the bond-specific characteristics into our data-set. The pooled regression estimates are consistent as long as the standard errors are adjusted for residual correlations within each bond group. To incorporate this adjustment, we use standard errors, clustered by bond.
5.4 Bond Liquidity
We first perform univariate pooled regressions of the average CDS-bond basis of each bond, during the quarter, on variables related to the liquidity of the bond, namely its latent liquidity at the beginning of the quarter, the number of days it traded during a quarter, the number of trades during the quarter, the logarithm of the traded market value during the quarter, the issue size of the bond, and the age of the bond at the beginning of the quarter. (The standard errors are adjusted to account for clustering within bonds.) The results are presented in Table 6.
We find that each of these explanatory variables is statistically significant. An increase in latent liquidity by one standard deviation leads to an increase in the basis (and a decrease in the yield of the bond) by ten basis points. An increase in the number of trades by one standard deviation leads to an increase in the basis by about nine basis points. An increase of one standard deviation in the number of days traded per quarter leads to an increase of eight basis points in the average basis. An increase of one standard deviation in the quantity traded leads to an increase of five basis points in the basis. As bonds age, their basis reduces, leading to higher yields and lower
prices. An increase of one standard deviation in the age leads to a reduction of about 16 basis points in the basis. Surprisingly, although issue size by itself leads to an increase in the basis, it is not statistically significant.
While the univariate relationships are as expected, it is important to see which of these liquidity variables are significant, once other variables have been accounted for. Specifically, we are interested in examining if latent liquidity has explanatory power for the CDS-bond basisover and above other realized liquidity-related variables. We next proceed to investigate this issue in detail. In doing so, we confirm several empirical findings from the literature and generate new findings of our own.
Table 7 shows the relationship between the CDS-bond basis of individual corporate bonds, the bond-specific characteristics and liquidity for a range of alternate specifications that include latent liquidity and other bond-specific liquidity measures, CDS market-specific effects and firm-level financial variables. In all the specifications presented in the table, latent liquidity has significant explanatory power for the basis, even after the inclusion of realized trading activity. This finding indicates that the liquidity premium of a bond is determined not only by theactual trading activity in the bond, measured by transaction metrics, but also by the pattern of investors holding the bond in terms of theirpotential trading activity, as proxied by the latent liquidity measure. This evidence provides strong support for the hypothesis that there is extra information related to liquidity in the latent liquidity measure, and that it is priced in the corporate bonds. On an average, an increase of one standard deviation in the latent liquidity seems to increase the basis by 10 bps, or reduce bond yields by around ten bps. Between the most liquid decile and least liquid decile of bonds in our sample, this indicates a difference of 1% in yield, an economically significant difference.
The significant coefficient of the coupon rate variable persists even after the inclusion of a large number of liquidity-related variables. Traditionally, as in Elton et al. (2001), this relationship has been explained as a tax effect. However, as has been argued more recently by Longstaff et al. (2005), the tax treatment on coupon income and swap rates is the same, and therefore, one would not expect to find a tax effect the difference between corporate bond yields and the swap rates. The fact that part of the coupon effect remains even when swap rates are used as the benchmark indicates that this explanation can only be partly true, at best.25 In addition, there is anecdotal evidence that many of the participants in the corporate bond markets, such as long term pension funds, are tax-exempt. Even hedge-funds, which in recent years have become significant players in the CDS and Collateralized Debt Obligations (CDO) markets, as well as the corporate bond market directly, tend to be tax-neutral between income and capital gains. Given the large sizes of these two segments of the market, it is difficult to conclude that the marginal investor in the corporate bond market has a strong tax preference.
25The values of the coefficient of the coupon rate in the case of swap and treasury rates are similar as documented
by Longstaff et al. (2005), as well as in empirical tests using our dataset (not reported here), with swap and treasury rates as benchmarks. This evidence casts doubt on the conventional explanation of the coupon effect as being due to differential taxation of corporate versus treasury bonds.
A larger amount outstanding of a bond tends to increase the CDS-bond basis, and makes the bond more expensive, thus increasing the CDS-bond basis. This is because bonds with larger issue sizes are likely to be more liquid relative to bonds with smaller issue sizes, even after controlling for latent liquidity, and hence have lower transaction costs. Older bonds are likely to be less liquid than newer bonds. The typical explanation for this is that older bonds get “locked up in the portfolios of passive investors. Since latent liquidity is a far more direct measure of this effect, we expect that after controlling for latent liquidity, we should not expect age to have a significant effect on the basis. The results lend support to this hypothesis. Although the coefficient of age in the first two regressions is positive, its sign changes after the inclusion of firm level effects, indicating that age, in itself, is not a good measure of liquidity, and that latent liquidity is a better measure of the “locking-away” effect than is age.
The relationship between the basis and the number of trades in the bond is also significant. Note that the number of trades is a measure of the realized liquidity of the bond. As expected, it has a positive coefficient in the first two regressions. It should be noted that for every time period, latent liquidity is available ex-ante, whereas the realized trading volume is an ex-post measure of liquidity. Thus, latent liquidity can be used topredict the non-default component in the bonds, as opposed to trading volume, which is only availableex-post or, at best contemporaneously, with the basis.
5.5 Interaction between bond-liquidity and default risk
Our hypothesis is that the expected costs of selling a bond short are important drivers of the CDS-bond basis, especially for firms that are close to default, when uncertainty about the value of the bonds is greater. Since illiquid bonds are also expected to be difficult to sell short, we expect illiquid bonds issued by firms with a high level of credit risk to be expensive, relative to more liquid bonds. In other words, while liquidity serves to increase the price of bonds in most cases, we expect the opposite to hold true for the most illiquid bonds belonging to highly risky firms. To examine whether this is indeed the case, we perform “double sorts” on our portfolio along the liquidity and default risk dimensions. Specifically, for every quarter in our data, we form twenty-five groups of bonds, using liquidity and a variety of other variables - including the leverage of the firm, the average spread on the CDS contract, and ratings related to default risk as the sorting variable - and examine the average basis in each bucket. The results for these “double sorts for four combinations, involving two liquidity variables and two default risk variables, are presented in tables 11, 12, 13 and 14.
Table 11 shows the average basis, along with the standard estimate of the mean average basis for that subgroup when the sample is sorted along the dimension of latent liquidity and rating class. In order to construct this table, for each quarter, we first sort the observations in our dataset into quintiles by latent liquidity. Next, we create subgroups for each quintile on the basis of
rating-class, and pool the sub-groups across quarters. We estimate the mean basis in each sub-group and the standard error for the estimate. The standard errors are clustered to reflect the fact that each sub-group contains multiple observations for the same bond, from different quarters. Two phenomena are apparent from the results. First, as we go toward progressively worse ratings, the CDS-bond basis increases. This means that bonds become more and more expensive relative to the CDS contracts. Moreover, for rating classes up to BBB, an increase in the latent liquidity of the bonds leads to an increase in the basis - that is, liquid bonds are more expensive. This also follows from the results of the pooled regressions mentioned above. Second, for poorer credit rating classes, which indicate that the firms are closer to default, the illiquid bonds have a substantially higher basis than the liquid bonds. The most illiquid bonds for the riskiest firms (those belonging to latent liquidity quintile 1) are expensive. As liquidity increases, the bonds tend to become cheaper, and finally the most liquid bonds of the riskiest firms (those belonging to latent liquidity quintile 5) are again more expensive relative to less liquid bonds (e.g. those belonging to latent liquidity quintile 4). In other words, in the poorer rating classes, liquidity serves to make the bond cheaper relative to the CDS contracts.
Table 12 shows the results of a similar analysis when the trading volume of the bonds is used as a measure of liquidity. Table 13 show the results when bonds are sorted according to latent liquidity on the liquidity dimension and the leverage of the firms issuing the bonds on the default risk dimension. Table 13 shows the result when trading volume for the quarter is used as a measure of liquidity and leverage is used as a measure of default risk. In all these cases, the conclusion can be drawn that while liquidity serves to increase the price of a corporate bond relative to the CDS contract, illiquid bonds of highly risky firms are also more expensive.
In order to ensure that the results of the double sort are robust to the inclusion of other variables, we also perform regressions using two interaction variables. Table 9 presents these results. In addition to the bond and firm specific variables that are used in subsection 5.4, we include the following two interaction dummies. The first takes a value of 1 if the bond lies in the lowest latent liquidity quintile referred to in table 11 and the highest quintile of risk as measured by the CDS spread. The second dummy variable takes a value of 1 if the bond lies in the lowest liquidity quintile as measured by trading volume and the highest quintile of default risk. Both interaction dummies turn out to have positive and statistically significant coefficients, both when taken independently and when taken together. In general, illiquid bonds of highly risky firms tend to have a CDS-bond basis that is higher by 60 basis points than would be expected if the interaction terms were not included.
Our explanation for this finding is market segmentation and limits to arbitrage. A lower latent liquidity implies that a particular bond is held by buy-and-hold investors, and is less likely to be “in the market.” The valuations of these investors may not be the same as that of a typical participant, in the CDS market for the same bond, who is likely to have a short term horizon, and thus, have a
valuation that is more sensitive to short term fluctuations in default risk. Since illiquid bonds can also be expected to be difficult to sell short, arbitrageurs are unable to correct for the difference in valuations between the corporate bond market and the CDS market, thus making illiquid bonds of highly risky firms more expensive than more liquid bonds. The observed pattern in the CDS-bond basis and liquidity for risky firms mirrors the pattern for the costs of short selling documented in Nashikkar and Pedersen (2007), although for a different sample of bonds.
5.6 CDS Market Effects
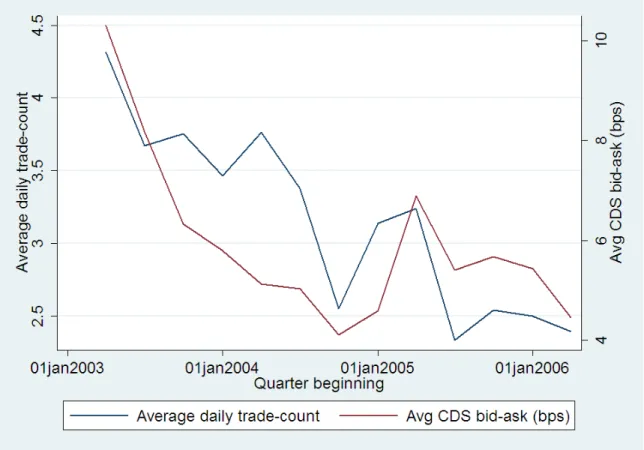
In addition to bond-specific liquidity effects, we find that the bid-ask spread in the CDS market has explanatory power for the basis, over and above the liquidity of the bond in itself. This is noteworthy, because it indicates that liquidity in the CDS market affects the prices of bonds in the cross-section. This is a phenomenon that has not been documented in the previous literature. Our results show that both bond market and CDS market liquidity variables have a strong effect on the CDS-bond basis. In fact, an increase by one basis point in the CDS bid-ask spread leads to an increase of two basis points in the CDS-bond basis. This indicates that bonds are relatively more expensive compared to the CDS contracts, when the CDS market liquidity is low. There are two possible explanations for this. First, less liquidity in the CDS market is likely to drive investors toward the corporate bond market, making bonds relatively more expensive. There is some support for this explanation. Figure 3 shows the relationship between the average bid-ask spread in the CDS market and the average trade count of bonds in our sample in any given quarter. It is apparent from the figure that as the CDS market has become more liquid, average trading volume in the bond market has actually decreased. Second, episodes of poor liquidity in the CDS market are often connected with negative news about the issuers on whom the CDS contracts are traded. It is generally difficult to “short” corporate bonds, which leads to corporate bonds becoming more expensive relative to the CDS contracts on the respective issues particularly during illiquid periods, in the market as a whole. Unfortunately, in the absence of detailed data on shorting costs, we have no clear way of distinguishing between these two hypotheses.
We find, however, that a higherpercentage bid-ask spread on the CDS contract leads to a lower basis. However, this effect seems to be related to the credit risk of the issuer, as the inclusion of firm-level financial ratios eliminates the explanatory power of the percentage bid-ask spread. The above results are interesting because they show that the CDS market liquidity has explanatory power for bond yield spreads, over and above bond-specific liquidity variables, thus providing evidence of a liquidity spill-over effects from the CDS market into the bond-market.
We include the CDS market volatility as a control for the riskiness of the CDS market. We find that the basis is negatively related to CDS market volatility, after controlling for other factors. Higher volatility in the CDS market makes a bond cheaper relative to the CDS contract, indicating that a strategy of buying the bond and buying protection on it in the CDS market has higher