Report to the
Congress on the
Availability of Credit
to Small Businesses
Board of Governors of the Federal Reserve System
October 2007
Report to the Congress
on the Availability of Credit
to Small Businesses
Submitted to the Congress pursuant to section 2227 of the Economic Growth and Regulatory Paperwork Reduction Act of 1996
Executive Summary ... 1
Flows and Terms of Business Credit... 7
Aggregate Business Financing... 7
Financing by Nonfinancial Corporations... 7
Financing by Small Business... 10
Credit Use by Small Businesses ... 19
Small Business: Definition and Background ... 19
Risks of Lending to Small Businesses ... 21
Credit Use ... 22
Types of Traditional Credit Used...23
Alternatives to Traditional Credit ...29
Summary of Credit Use ...33
Credit Application Experience... 34
Providers of Credit Lines, Loans, and Leases to Small Businesses... 37
Overview... 37
Lending by Depository Institutions ... 38
Commercial Banks...39
Savings Institutions...49
Special Issues ... 53
Credit Scoring ... 53
Securitization of Small Business Loans... 59
Process of Securitization...59
Securitization Activity ...61
Community Reinvestment Activities... 62
Community Reinvestment Act...63
Bank-Controlled Financing Vehicles...63
Government-Sponsored Vehicles ...65
Emerging Trends...68
Appendix: The 2003 Survey of Small Business Finances ... 71
Section 2227 of the Economic Growth and Regulatory Paperwork Reduction Act of 1996 requires that, every five years, the Board of Governors of the Federal Reserve System submit a report to the Congress detailing the extent of small business lending by all creditors. The act specifies that the study should identify factors that give policymakers insight into the small business credit market, including the demand for credit by small businesses, the availability of credit, the range of credit options available, the types of credit products used, the credit needs of small businesses, the risks of lending to small businesses, and any other factors that the Board deems appropriate.1
Since 2002, the year of the previous report on the availability of credit to small
businesses, financing flows to both large and small firms have generally increased along with economic activity. From 2002 through June 2007, credit conditions were favorable for small and large firms, and there is no evidence that creditworthy borrowers faced substantial credit supply constraints during that period.2 More recently, financial markets have been volatile, but financing conditions for small businesses appear to have held up fairly well. The demand for credit by small businesses generally tracked the pattern of debt growth for nonfinancial businesses: Indicators of small business financing needs suggest that demand picked up in 2004 from low levels in 2003 but moderated in 2006 and early 2007. Equity financings, although well below their record pace of the late 1990s, have been solid and have steadily increased since 2003.
Small businesses--generally defined as firms having fewer than 500 employees--contribute significantly to the strength and vigor of the U.S. economy. Together they employ more than one-half of private-sector workers and produce more than one-half of the private-sector output. Large and successful companies often begin as smaller firms that prosper and grow. Likewise, most of the new firms that form and help the economy adapt to change start as small businesses.
The concerns of the Congress and other policymaking bodies about small business financing stem from the perception that small firms have more difficulty gaining access to credit sources than do large businesses or other types of borrowers. The source of this difficulty may be that lending to small businesses is generally considered riskier and more costly than lending to larger firms. Small businesses are much more affected by swings in the economy and have a much higher failure rate than larger operations.
1
As required by the law, in preparing this report, the Board consulted with the Director of the Office of Thrift Supervision, the Comptroller of the Currency, the Administrator of the National Credit Union Administration, the Administrator of the Small Business Administration, the Board of Directors of the Federal Deposit Insurance Corporation, and the Secretary of Commerce.
2
Comprehensive data that directly measure the financing activities of small businesses do not exist. However, several sources of information can be used to proxy small business activity and identify patterns of small business financing. This report focuses on the period from 2002 through June 2007 and does not reflect developments since then.
In addition, lenders historically have had difficulty determining the creditworthiness of applicants for some small business loans. The heterogeneity across small firms, together with widely varying uses of borrowed funds, has impeded the development of general standards for assessing applications for small business loans and has made evaluating such loans relatively expensive. Lending to small businesses is further complicated by the fact that reliable information on the creditworthiness of a small business is often difficult to obtain because little, if any, public information exists about the performance of most small businesses. Small businesses rarely have publicly traded equity or debt securities, and many small businesses also lack detailed balance sheets and other financial information often used by lenders in making underwriting decisions.
Financial institutions, especially commercial banks, are often portrayed in the economics literature as having an advantage in dealing with information problems. Through
interactions with a firm that uses its financial services, the lending institution can obtain additional information about the firm=s activities, ownership, financial characteristics, and prospects that is important in deciding whether to extend credit. Employing what is often called “relationship financing,” lenders can use information gathered over time through long-term relationships with business owners and other members of the local community to monitor the health of the business and to build appropriate incentives into loan
agreements.
The 2003 Survey of Small Business Finances (SSBF) provides the most comprehensive and up-to-date information on small business finance available.3 The survey shows that among small businesses, larger firms were more likely than smaller firms to use each of the traditional credit types: credit lines, capital leases, motor vehicle loans, mortgages, equipment loans, and other loans.4 However, whether this pattern reflects a greater need for credit at larger firms or whether lenders are simply more willing to extend credit to larger firms is unclear. The relationship between firm age and credit use is similar to the relationship between size and use--that is, younger firms use fewer of the credit products.
Patterns of credit use by small businesses observed in data from the 2003 SSBF were similar to the patterns in the 1998 SSBF. The most significant difference was the greater use of lines of credit in 2003 than in 1998, which could be due in part to some financial institutions relying more heavily on credit scoring to evaluate certain loan applications.
3
The 2003 SSBF gathered data for fiscal year 2003 from 4,240 firms selected to be representative of small businesses operating in the United States in December 2003 (Mach and Wolken, 2006, pp. 188-89). The survey gathered details on the characteristics of each business and its top three owners, the firm’s income statement and balance sheet, and details of the use and sources of financial services. It also obtained information about the firm’s recent borrowing and credit application experience, the use of trade credit, and capital infusions. The previous survey had been conducted for fiscal year 1998 using a sample of 3,561 firms. Although the small business survey was called the National Survey of Small Business Finances before 1998, it is referred to as the Survey of Small Business Finances in this report for all years.
4
The term “traditional” type of credit is used in this report to help distinguish credit lines, loans, and leases from other products that have certain credit-like features.
Besides having access to traditional sources of credit, small businesses have alternative means of financing available, including credit cards, trade credit, and owner loans. Among these alternatives to traditional credit products, only business credit cards
registered an appreciable increase in usage between 1998 and 2003. Although most small firms used credit cards and trade credit, the rapid payment of outstanding balances by a large percentage of these firms suggests that much of the use of these products was for convenience rather than for longer-term financing of expenses.
Some small businesses may have wanted to use more credit than was reflected on the 2003 SSBF but were unable to obtain it. Credit application behavior and denial and approval patterns provide information on the credit demands of small firms. According to the 2003 SSBF, slightly more than one-fifth of small businesses applied for new credit between 2000 and 2003. Larger firms were more likely than small firms to apply for new credit and were more likely to have their applications approved. Application rates for younger and older firms were similar, but younger firms were more likely than older firms to be denied credit. The finding that smaller and younger firms have their loan applications denied more frequently is consistent with the conventional wisdom that these firms are riskier, have shorter credit histories or less collateral to pledge as security, and are more informationally opaque.
Some firms that may have wanted additional credit may not have applied because they expected that their applications would be denied. In fact, 18 percent of the SSBF
respondents indicated that, between 2000 and 2003, they had forgone applying when they needed credit because they expected to be turned down. The survey data show that younger and smaller firms were more likely to forgo applying for credit, a sign that the demand for credit at such firms may have been higher than the data on credit use indicate. However, some firms that failed to apply at some point between 2000 and 2003 were not shut out of the credit market because they often applied for, and sometimes received, credit at other times.
Small businesses obtain credit from a wide range of sources, including commercial banks, savings institutions, credit unions, finance companies, nonfinancial firms, and individuals such as family members or friends. According to the 2003 SSBF, of these sources, commercial banks are the leading provider: They supplied credit lines, loans, and leases to slightly more than two-thirds of small firms that obtained a traditional form of credit from any source. Banks were also the most common source of credit lines, mortgages, and equipment loans, and they were the second most common source, after finance companies, of automobile loans.
Because banks are the leading source of traditional credit to small business, much
attention has been paid to developments in banking that may influence credit availability. The substantial consolidation of the banking industry over the past twenty years is one such development. Mergers and acquisitions have dramatically reduced the number of banks, thereby increasing the importance of large institutions and the concentration of
industry assets. These changes to the structure of the industry have raised concerns about possible reductions in the availability of credit to small businesses. Although larger banks supply the majority of bank loans to small businesses, they tend to be
proportionately less committed than smaller banks to small business lending.
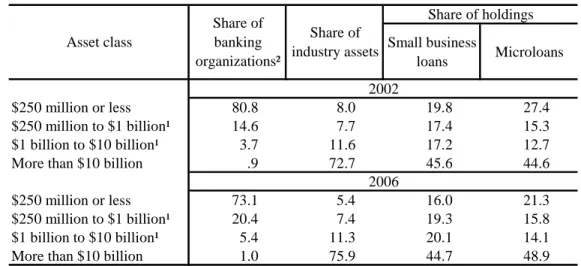
The evidence suggests that the thousands of small banks still in operation continue to account for a meaningful share of small business lending activity--measured by holdings of business loans equal to or less than $1 million and equal to or less than $100,000--despite their declining numbers and the commensurate fall in their share of industry assets.5 For example, in 2006, banks with assets of $250 million or less accounted for 73.1 percent of all banking organizations but only 5.4 percent of all banking assets. However, they held 16 percent of bank business loans of $1 million or less and 21.3 percent of such loans of $100,000 or less. In addition, the results of studies that directly analyze the relationship between bank consolidation activity and the availability of credit to small businesses tend to suggest that although mergers and acquisitions may sever existing bank-firm relationships and may introduce some short-term uncertainty, overall they have not reduced credit availability to small businesses. After a merger, any
reduction in small business lending by the newly consolidated bank is generally offset by an increase in small business lending by other banks.
Analysis of patterns within local areas is likely to capture the relevant structural
conditions that face small firms seeking credit and that influence the level of competition in the market for small business loans. Data from the SSBF indicate that small
businesses tend to obtain loans, leases, and lines of credit from providers located near them. For example, in 2003, the median distance between a small business and its lender was 11 miles, and in 66 percent of all business lending relationships the lender was located within 30 miles of the firm’s headquarters. Among lending relationships with banks and thrifts of all sizes, the median distance between a small business and its
depository institution was 4 miles, and 83 percent of lenders were located within 30 miles of the firm’s headquarters. The proximity offers small firms convenient access to their lenders and suggests that credit providers focus their lending activities on entities with which they are familiar, partly because such entities are nearby.
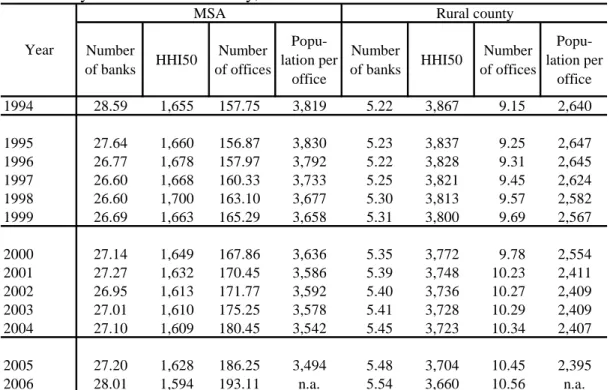
Measures of the concentration of local banking markets are used to assess the likely competitive conditions that face small businesses seeking credit. In 2006, the average urban market was moderately concentrated with respect to banking deposits and had an
5
Analysis of the small business lending activities of commercial banks and savings institutions is based on midyear Reports of Condition and Income (Call Reports) and midyear Thrift Financial Reports, which are filed by commercial banks, savings banks, and savings and loan associations. These reports include information on the number and amount of business loans of $1 million or less.
average of twenty-eight banks with 193 offices.6 The average rural area had fewer banks and was highly concentrated. However, comparing these statistics with those of earlier years, we find that despite the significant amount of consolidation in the banking industry, local banking markets do not appear to have become less competitive.
Generally, in both rural and urban markets, the number of banks and offices has remained constant or increased somewhat, whereas the concentration measures have either
remained constant or decreased somewhat. Modest deconcentration, in conjunction with a small increase in the number of banks, suggests that the availability of credit from commercial banking organizations probably has not declined in recent years.
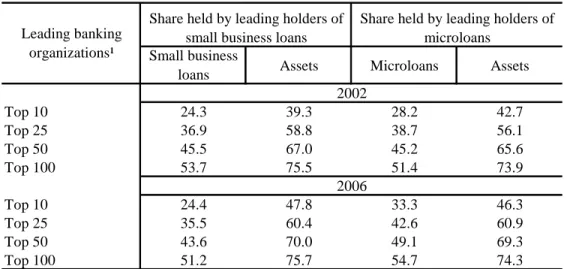
Savings institutions, defined as savings banks and savings and loan associations, provide much less credit to small businesses than do commercial banks. The differences between the lending volumes of the two groups of institutions reflect both the disparity in overall size between the two groups and the lower proportion of small business lending
conducted by the typical savings institution. Among savings institutions, the most active, or leading, lenders to small businesses were not necessarily the largest institutions in terms of assets. A comparison of the shares of small business lending by thrifts for 2002 with the corresponding data for 2006 indicates that the leading savings institutions in terms of small business activity have been accounting for an increasing share of
outstanding business loans in both loan-size categories of interest--equal to or less than $1 million and equal to or less than $100,000--while the share of industry assets for these institutions has remained relatively constant. This finding suggests that although some thrifts have increasingly specialized in small business lending, they are not predominantly the largest institutions.
Credit scoring may lead to an increase in the availability of credit for small businesses, in part because it may increase the consistency, objectivity, and speed of credit evaluations while lowering the cost of gathering relevant information. In addition, it may have the potential to increase a lender’s ability to accurately predict loan performance and may increase access to capital markets. Credit scoring has been used for more than thirty years in underwriting consumer loans but only since the early to mid-1990s in small business lending (Board of Governors, 2007).
Except for a few banks that have developed proprietary models, most organizations use scoring models obtained from outside vendors, the largest of which is Fair Isaac
Corporation. The reliance by a large proportion of the industry on one vendor’s model has raised concerns that the resulting problems could be widespread if the model performs poorly. It is not clear how small business credit-scoring models perform relative to traditional reviews of such loans, especially during a major economic
6
Under the horizontal-merger guidelines of the U.S. Department of Justice and the Federal Trade
Commission, a market in which the deposit-based Herfindahl-Hirschman Index (HHI) ranges from 1000 to 1800 is considered moderately concentrated. In 2006, the average deposit-based HHI for commercial banks in metropolitan statistical areas was about 1600.
slowdown. However, users of the models generally report that, after their adoption, (1) the riskiness of the small business portfolio either remains about the same or declines and (2) the quality of the typical credit decision increases.
Evidence regarding the effect of credit scoring on credit availability is consistent with proponents’ claims that the use of scoring models increases the availability of credit to some small businesses. However, concerns have been raised that the continued adoption of credit-scoring techniques may reduce the availability of credit for small firms that find it hard to qualify for loans based only on a formal credit score. At this time, it is unclear how often creditworthy firms that would not qualify for credit-scored products would be able to obtain financing from a lender that relied on traditional methods of loan
evaluation. Nonetheless, community banks and other local lenders are likely to continue to provide this valuable service to many small firms that would not qualify for credit-scored loans, especially if loans are priced appropriately.
The securitization of small business loans is a development that could substantially influence the availability of credit. Potential benefits exist for lenders, borrowers, and investors. However, the obstacles to securitizing loans to small businesses are large, especially with loans not backed by a guarantee from the Small Business Administration. Securitization has so far remained modest, and recent developments suggest that the volume of securitized small business loans is unlikely to increase substantially over the next several years.
Community reinvestment activities help financial institutions meet the financing needs of small businesses. Beyond conducting lending programs that are part of a bank’s normal operating process, banks often develop or work with specially created entities focused on providing credit in underserved communities. Some of these entities operate wholly within a bank’s legal structure, some are partnerships with other service providers, and still others are standalone organizations in which banks invest. These programs encourage capital to flow where it otherwise might not.
Numerous trends in the community development field either are just beginning to
significantly influence the delivery of capital to small businesses by financial institutions or have the potential to do so in the near future. Some of these trends--for example, the proliferation of financial literacy and outreach programs--are due primarily to the actions of financial services firms themselves. Others are due to the actions of government--such as the New Markets Tax Credit--to stimulate more lending. Still other trends involve new hybrid partnerships among banks and nonbank entities such as local microloan funds. These trends, should they continue, are likely to result in improved access to credit and capital for small businesses.
Flows and Terms of Business Credit
Since 2002, the year of the previous report on the availability of credit to small businesses, business financing flows to both large and small firms have generally increased along with economic growth. Credit conditions have been favorable for small and large firms, and there is no evidence that creditworthy borrowers have faced
substantial credit supply constraints.7
A
GGREGATEB
USINESSF
INANCINGThe recession of 2001 was marked by sharp reductions in the rate of real investment. Investment began to rebound in 2003 and has continued to rise since then, in part because of favorable credit conditions. Growth in total nonfinancial business debt, which
mirrored these developments, surged from an annual rate of about 3 percent in 2002 and 2003 to a rate of 9 percent in the first quarter of 2007 (figure 1). As a result, the ratio of total nonfinancial business debt to gross domestic product (GDP) has increased to about 68 percent, the highest level in more than two decades.
Gross equity issuance by nonfinancial firms has also risen since 2002 (figure 1). Public equity issuance, through both initial and seasoned offerings, has maintained a steady but moderate pace by historical standards. In contrast, private issuance, boosted by the recent wave of leveraged-buyout transactions, has risen sharply from an annual rate of about $60 billion in 2002 to a pace of about $150 billion in the first quarter of 2007. Even so, net equity issuance, already negative in 2002, became even more negative over the period because of a surge in retirements of equity through cash-financed mergers (including leveraged buyouts) and share buybacks.
F
INANCING BYN
ONFINANCIALC
ORPORATIONSGrowth in total nonfinancial corporate debt has risen steadily in the past five years (figure 2). It increased from an annual rate of a bit above zero in 2002 to a pace of about 9 percent in the first quarter of 2007. Corporate debt growth in 2003 and 2004 was weak; the small increase was due mainly to bond issuance, as decreases were recorded in bank loans extended without real estate as collateral and in commercial paper. Since then,
7
Data used in this section are from the flow of funds accounts published by the Board of Governors of the Federal Reserve System, Consolidated Reports of Condition and Income for banks, and surveys of lenders and of small businesses. Information from the flow of funds accounts relates to organizational type rather than to size of firm. A business can be organized as a corporation (C type or S type), a proprietorship, or a partnership. Most proprietorships and partnerships are small businesses. Large, publicly traded firms are C corporations, subject to corporate income taxes and securities laws. The S type of corporation is designed primarily for small businesses and generally is not subject to corporate income taxes.
Figure 1
Total Debt and Equity of Nonfinancial Businesses, 1980-2007
Note. Data are annual.
1. Includes venture capital, buyouts, corporate finance, mezzanine, and other private equity investments.
Source. Top and middle panels are from the Federal Reserve Board, flow of funds accounts. The bottom panel is from the Securities Data Company, the Private Equity Analyst, and the Venture Capital Association MoneyTree Survey.
1980 1983 1986 1989 1992 1995 1998 2001 2004 2007 -6 -3 0 3 6 9 12 15 18 Percent Q1
Percentage Change in Total Debt
1980 1983 1986 1989 1992 1995 1998 2001 2004 2007 45 50 55 60 65 70 Percent Q1
Ratio of Nonfinancial Business Debt to GDP
1980 1983 1986 1989 1992 1995 1998 2001 2004 2007 0 50 100 150 200 250 300 Billions of dollars
Equity Issuance by Nonfinancial U.S. Firms
Total gross issuance
Public issuance
Private issuance1
Note. Shaded bars indicate periods of recession.
Figure 2
Total Debt of Nonfinancial Corporate Businesses
Source. Federal Reserve Board, flow of funds accounts.
Level of Debt, 2002-07 2002 2003 2004 2005 2006 2007:Q1 Type of debt Billions of dollars Total debt... Trade debt... Bonds ... Mortgages... Bank loans ... Commercial paper... Other loans ... 1 2 3 2,710 450 636 120 665 4,581 1,457 2,869 507 561 85 667 4,689 1,403 2,946 553 563 102 684 4,848 1,500 3,006 638 624 94 723 5,084 1,565 3,227 755 690 117 742 5,531 1,638 3,295 789 707 130 745 5,666 1,651 Memo:
Note. Debt outstanding at end of period. 1. Industrial revenue bonds and corporate bonds. 2. Extended without real estate as collateral.
3. Loans from finance companies and all other nonmortgage loans that are not extended by banks.
Source. Federal Reserve Board, flow of funds accounts. Seasonally adjusted data.
1980 1983 1986 1989 1992 1995 1998 2001 2004 2007 -16 -12 -8 -4 0 4 8 12 16 20 24 Percent Total Q1 Bank loans Annual
nearly all components of corporate debt growth have expanded because of robust merger and acquisition activity and rising outlays for investment goods.
Improving financing conditions for firms in public capital markets and at banks may also have contributed to the increases in corporate debt growth since 2002. Default rates on corporate bonds and on commercial and industrial loans fell substantially to near-historic lows (figure 3). Yields on BBB-rated and high-yield corporate bonds also declined, and their spreads to yields on comparable-maturity Treasury securities remained at the low end of their historical ranges through the first half of 2007. Bond spreads have risen noticeably in recent months but are still far below their peaks in 2002. Relatively narrow yield spreads are consistent with strong overall corporate balance sheets.
F
INANCING BYS
MALLB
USINESSComprehensive data that directly measure the financing activities of small businesses are nonexistent. However, various sources of information can serve as proxies for small business activity and can be used to identify patterns of small business financing. These sources suggest that financing flows to small firms weakened a bit in 2003 but have generally been robust since then.
Total small business debt, estimated as the total debt of partnerships and proprietorships, reached $3.1 trillion in the first quarter of 2007 (figure 4).8 Growth in small business debt declined to about 4 percent in 2003, but it rose to about 12 percent in 2005 before moderating a touch over the next two years. Growth in two of the three components of total small business debt--mortgage debt and bank loans extended without real estate as collateral--followed a roughly similar pattern. Commercial bank loans (both with and without real estate as collateral) with principal less than or equal to $1 million, often extended to small firms, have shown modest but steady growth since 2003 (table 1).
Indicators of small business financing needs suggest that demand picked up in 2004 from low levels but moderated in 2006 and 2007. The demand for small business financing can be inferred from small business investment plans, as reported in surveys conducted
8
In this section, data on partnerships and proprietorships are from the flow of funds accounts published by the Federal Reserve Board, and total small business debt is defined as unincorporated nonfinancial business debt from the flow of funds accounts. These data may include some large proprietorships and partnerships, which would not be considered small businesses. According to the 2003 Survey of Small Business Finances, partnerships and proprietorships make up just more than half of small businesses and tend to be smaller than small corporations.
Figure 3
Corporate Credit Conditions, 1990-2007
1991 1993 1995 1997 1999 2001 2003 2005 2007 0 1 2 3 4 5 6 7 Percent
Default and Delinquency Rates
C&I loan delinquency rate1
Bond default rate2
Q2
1. Quarterly rate, from the Call Report.
2. Six-month moving average, from Moody’s Investors Service.
1991 1995 1999 2003 2007 6 8 10 12 14 16 Percent
Yields on Corporate Bonds
Monthly
10-year BBB 10-year high yield
Aug.
Note. Yields from smoothed yield curves. Source. Merrill Lynch, Moody’s Investors Service.
1991 1995 1999 2003 2007 2 4 6 8 10 Percent
Spreads on Corporate Bonds
Monthly
10-year BBB 10-year high yield
Aug.
Note. Measured relative to comparable-maturity Treasuries. Source. Merrill Lynch, Moody’s Investors Service.
Note. Shaded bars indicate periods of recession.
Figure 4
Total Debt of Partnerships and Proprietorships
Source. Federal Reserve Board, flow of funds accounts.
Level of Debt, 2002-07 2002 2003 2004 2005 2006 2007:Q1 Type of debt Billions of dollars Total debt... Trade debt... Mortgages... Bank loans ... Other loans ... 1 2 2,107 1,550 430 127 281 2,199 1,625 442 132 255 2,443 1,844 466 133 277 2,769 2,118 516 135 310 3,090 2,370 571 149 337 3,159 2,422 585 152 343 Memo:
Note. Debt outstanding at end of period. 1. Extended without real estate as collateral.
2. Loans from finance companies and all other nonmortgage loans that are not extended by banks. Source. Federal Reserve Board, flow of funds accounts.
1980 1983 1986 1989 1992 1995 1998 2001 2004 2007 -16 -12 -8 -4 0 4 8 12 16 20 24 Percent Total Bank loans Q1 Annual
Size of loan and year All Commercial and industrial
Nonfarm nonresidential real
estate
Small business loans ($1 million or less) 2002 471.6 239.0 232.6 2003 482.5 234.7 247.8 2004 504.2 239.4 264.8 2005 523.6 244.1 279.6 2006 549.8 250.8 299.0 2003 2.3 -1.8 6.5 2004 4.5 2.0 6.9 2005 3.8 2.0 5.6 2006 5.0 2.7 6.9 Microloans ($100,000 or less) 2002 120.0 89.2 30.9 2003 115.9 86.5 29.4 2004 113.1 85.2 27.9 2005 112.7 85.2 27.5 2006 115.2 89.2 26.0 2003 -3.4 -3.0 -4.9 2004 -2.4 -1.5 -5.1 2005 -.4 .0 -1.4 2006 2.2 4.7 -5.5
Source. Call Reports (June 30), various years.
Table 1. Small business loan and microloan holdings of U.S. commercial banking organizations, by type of loan, 2002-06
1. Change is from June of preceding year to June of year indicated.
Note. Small business loans are business loans of $1 million or less; microloans, a subset of small business loans, are for $100,000 or less. U.S. commercial banking organizations are insured U.S. domestically chartered banks excluding credit card institutions and U.S. branches and agencies of foreign banks. Details may not sum to totals because of rounding.
Amount outstanding, June 30 (billions of dollars)
Change¹ (percent)
Amount outstanding, June 30 (billions of dollars)
Change¹ (percent)
by the National Federation of Independent Business (NFIB).9 According to the surveys, the net percentage of firms that planned capital outlays and the net percentage that anticipated business expansions were low by historical standards in 2002 and 2003, rose
9
Each month the NFIB polls a random sample of its members to assess business conditions and the availability of credit for small businesses. For the first month of each quarter, roughly 7,000 firms receive questionnaires, and about 1,100 typically respond; for the remaining two months of each quarter, about 2,500 questionnaires are mailed, with around 500 responses. About 90 percent of the respondents have fewer than forty employees.
Figure 5
Demand for Small Business Credit
Note. Data are quarterly.
1. Percent of firms planning capital outlays in the next six months.
2. The proportion of respondents that consider the next three months a "good time to expand" less the proportion that do not consider the next three months a "good time to expand."
Source. Top and middle panels are from the National Federation of Independent Business, and the bottom panel is from the Federal Reserve Board Senior Loan Officer Opinion Survey on Bank Lending Practices.
1991 1993 1995 1997 1999 2001 2003 2005 2007 25 30 35 40 Percent
Firms Planning Capital Outlays, 1990-20071
Q2 1991 1993 1995 1997 1999 2001 2003 2005 2007 0 5 10 15 20 25 30 Percent
Outlook for Small Business Expansion over the Next Three Months, 1990-20072
Q2 1991 1993 1995 1997 1999 2001 2003 2005 2007 -60 -40 -20 0 20 40 60 Percent Q2
to above-average levels in 2004 and 2005, but then reverted to low levels in 2006 and 2007 (figure 5). Data on demand for commercial and industrial loans, as reported in the Federal Reserve’s Senior Loan Officer Opinion Survey on Bank Lending Practices, show a similar up-and-down pattern over the period.
Credit conditions at banks for small businesses have been favorable, for the most part, since 2002. Results from the Senior Loan Officer Opinion Survey indicate that lending standards for small borrowers were tightened a bit in 2002 and 2003, were loosened substantially in each of the subsequent three years, and were about unchanged in the first part of 2007 (figure 6). Responses to other questions in the survey suggest that the general easing of standards since 2004 is due mainly to the favorable economic outlook and the increased competition among banks and other nonbank lenders. Since 2002, the net percentage of NFIB respondents reporting that credit had become more difficult to obtain remained low through the first half of 2007 by historical standards, even as the average short-term interest rate paid by NFIB respondents increased from a low of
6 percent in 2004 to about 9 percent in the first half of 2007.10
Although well below its record pace of the late 1990s, financing to small business with the potential for significant growth has been solid since 2002. Venture capital
investments edged down a bit from $22 billion in 2002 to $20 billion in 2003, have steadily increased since then, and are on pace to reach $28 billion in 2007 (figure 7). Financing of firms at very early stages of development followed a similar pattern.
10
Results from NFIB surveys in July and August (not shown) indicate that credit conditions have not materially tightened in recent months.
Data on small business loan prices (interest rates and fees) are not publicly reported or widely available. Therefore, the analysis and discussion of pricing in this report are limited.
Figure 6
Credit Availability to Small Businesses, 1990-2007
Note. Data are quarterly.
1. Firms with annual sales of more than $50 million are considered "large."
2. Of borrowers who sought credit in the past three months, the proportion that reported difficulty in obtaining credit less the proportion that reported more ease in obtaining credit.
Source. Top and bottom panels are from the National Federation of Independent Business, and the middle panel is from the Federal Reserve Board Senior Loan Officer Opinion Survey on Bank Lending Practices.
1991 1993 1995 1997 1999 2001 2003 2005 2007 6 7 8 9 10 11 12 13 Percent
Average Short-Term Loan Rate
Q2 1991 1993 1995 1997 1999 2001 2003 2005 2007 -30 -15 0 15 30 45 60 Percent Large firms Small firms Tightening Easing Q2
Net Percentage of Banks Tightening Credit Standards on C&I Loans, by Firm Size1
1991 1993 1995 1997 1999 2001 2003 2005 2007 -2 0 2 4 6 8 10 12 Percent
Credit More Difficult to Obtain Than Three Months Ago (Net)2
Figure 7 Venture Capital
Note. Data are at an annual rate.
Source. Top and bottom panels are from PriceWaterhouseCoopers / Venture Capital Association / MoneyTree Survey.
1995 1996 1997 1998 1999 2000 2001 2002 2003 2004 2005 2006 2007 0 20 40 60 80 100 120 Billions of dollars Investments, 1995-2007 Q1
Amount and Number of Investments, 2002-07
2002 2003 2004 2005 2006 2007:Q1
Development Stage
Venture Capital
Seed, Start-up, Early Stage Investments ($B)... Number of deals... Average deal size ($M)....
Investments ($B)... Number of deals... Average deal size ($M)....
21.8 7.1 3,083 1,025 4.2 4.1 19.7 6.8 2,895 970 3.9 4.0 22.1 7.3 3,031 1,060 4.4 4.2 22.8 7.3 3,100 1,018 4.5 4.4 25.5 7.5 3,416 1,176 5.0 4.2 28.2 9.1 3,112 1,036 4.5 4.4
Credit Use by Small Businesses
This section examines the composition andborrowing behavior of small firms to identify characteristics that are associated with important patterns of credit use. It also discusses the special role that small business plays in the U.S. economy and the unique challenges they face in obtaining credit.
S
MALLB
USINESS:
D
EFINITION ANDB
ACKGROUNDDefining what is meant by “small business” is the first step in conducting a policy-relevant analysis of the financing needs of small business; it is also difficult. The financing needs are very different for a “mom and pop” grocery store, a microenterprise in the inner city, a start-up high-tech firm, a business that is ready to expand from early-stage growth to the next higher level, or a business that has neared the point of issuing public debt or equity. Yet the term “small business” encompasses all of these.
According to a broad guideline used by the U.S. Small Business Administration (SBA), a small business is a firm or enterprise with fewer than 500 employees. This definition encompasses more than 99 percent of all businesses in the United States.
The vast majority of small businesses are modest in size. The 2003 Survey of Small Business Finances (SSBF), which is representative of more than 6.3 million nonfarm, nonfinancial businesses with fewer than 500 workers, estimates that more than 91 percent of these businesses have fewer than twenty employees (including working owners) and that three-fifths have fewer than five (table A.1).
Just more than half of the small businesses were organized as proprietorships (44.5 percent) or partnerships (8.7 percent) in 2003. The remainder were organized as either S corporations (31 percent) or C corporations (15.7 percent). The primary difference between the two types of corporations is that C corporations are subject to corporate income tax. However, S corporations are legally constrained to have no more than seventy-five shareholders, are restricted to one class of stock, and to avoid income tax liability, must pass all income to the owners at the end of each fiscal year. In recent years, the S corporation organizational form has become more popular. Between 1998 and 2003, the share of firms organized as S corporations increased from 24 percent to 31 percent, while the share organized as C corporations and that organized as proprietorships declined, respectively, from 20 percent to 15.7 percent and from 49 percent to 44.5 percent.
Two other organizational forms gained legal status in several states during the latter 1990s: the limited liability corporation (LLC) and the limited liability partnership (LLP). LLCs share many characteristics of partnerships but also have the limited liability of a corporation. LLPs are partnerships in which an investor’s liability is limited to his or her
initial investment. In this report, LLCs and LLPs are classified as partnerships,
corporations, or proprietorships according to the way they file their taxes. LLCs may file taxes as partnerships, sole proprietorships, or corporations, and LLPs may file as either partnerships or corporations.
Small businesses operate in every major segment of the U.S. economy. The most common industry for small businesses in 2003 was business services, which accounted for one-fourth of small firms (table A.1). Another fourth of small businesses were in the retail (18.4 percent) and wholesale (5.9 percent) trade sectors. The remaining half of small businesses were involved in professional services (20.6 percent), construction and mining (11.8 percent), insurance and real estate (7.2 percent), transportation (3.8
percent), and manufacturing (7.1 percent).
In 2003, 94 percent of the small businesses in the United States had owners who actively participated in the firm’s management, 85.9 percent had a single office, and 79.4 percent were located in urban areas. Geographically, small businesses were widely dispersed throughout the nation, with 19.8 percent in the Northeast, 21.1 percent in the Midwest, 24.4 percent in the West, and the remaining 34.7 percent in the South. A demographic breakdown of the universe of nonfarm, nonfinancial small businesses in the United States according to the 2003 SSBF appears in table A.1.
Small businesses contribute significantly to the strength and vigor of the U.S. economy. According to the SBA, firms with fewer than 500 employees employ more than one-half of private-sector workers and produce more than one-half of the private-sector output. They account for 99.9 percent of all firms. Large and successful companies often begin as smaller firms that prosper and grow. In 2005, the latest year for which data are available, the estimated number of employer firm births, at 671,800, was higher than the number of deaths, at 544,800, for a net change of 127,000 new employer businesses (a net annual growth rate of 2.2 percent). Firms with fewer than 500 employees accounted for 99.9 percent of all firm births and deaths (U.S. Small Business Administration, 2006, p. 10).
The concerns of the Congress and other policymaking bodies about small business financing stem from the perception that small firms have more difficulty gaining access to credit sources than do large businesses or other types of borrowers. The source of this difficulty may be the greater riskiness of small firms and the associated high costs of evaluating and monitoring credit risks, or it may be inefficiencies in markets that hinder pricing of risk or impede the effective pooling of risks. To the extent that private-market impediments or inefficiencies are the source of any difficulties for small business
financing, policymakers may focus on changes that reduce these constraints. In this case, no one policy prescription would likely work for all, and no one definition of small business would be appropriate. As discussed in this report, credit needs and borrowing sources differ widely among small businesses.
R
ISKS OFL
ENDING TOS
MALLB
USINESSESLending to small businesses is generally considered riskier and more costly than lending to larger firms. Small businesses tend to be much more affected by swings in the
economy and have a much higher failure rate than larger operations.11 In addition, lenders historically have had difficulty determining the creditworthiness of applicants for some small business loans. The heterogeneity across small firms, together with widely varying uses of borrowed funds, has impeded the development of general standards for assessing applications for small business loans and has made evaluating such loans relatively expensive.
Lending to small businesses is further complicated by the "informational opacity" of many such firms. Obtaining reliable information on the creditworthiness of a small business is often difficult because little, if any, public information exists about the performance of most small businesses. Small businesses rarely have publicly traded equity or debt securities, and public information on such firms is typically sparse. Many small businesses also lack detailed balance sheets and other financial information often used by lenders in making underwriting decisions.
The cost to the lender does not end with the decision to grant a loan. Small business lenders typically have had to monitor the credit arrangement with individual borrowers. For very small firms, a close association between the finances of the business and those of the owner may increase loan-monitoring costs.
Historically, the relatively elevated costs of evaluating small business applications and the ongoing costs of monitoring firm performance have made loans to small businesses less attractive for some lenders, especially because, when expressed as a percentage of the (small) dollar amount of the proposed loan, these non-interest costs are often quite high relative to loans to middle-market or large corporate borrowers. Financial
institutions, especially commercial banks, are believed to have an advantage in dealing with information problems. Through interactions with a firm that uses its financial services, the lending institution can obtain additional information about the firm=s
activities, ownership, financial characteristics, and prospects that is important in deciding whether to extend credit.12 Lenders can use information gathered over time through long-term relationships with business owners and other members of the local community to monitor the health of the business and to build appropriate incentives into loan
11
About one-third of businesses with employees fail in the first two years, and 56 percent fail within four years (Knaup, 2005).
12
Banks typically provide multiple products to small businesses that borrow from them. The 2003 SSBF indicates that small firms that obtained at least one product at a commercial bank averaged 2.1 products at that bank. The comparable average number of products at nonbanks was 1.2. Small firms with at least one product at a bank had one or more other products at that bank at least 60 percent of the time. In contrast, 83 percent of small firms that had a product with a nonbank provider obtained no other products from the nonbank.
agreements.13 The role of relationship lending will likely continue to be significant, even as developments such as automated banking, credit scoring, and bank consolidation influence the competitive structure of the banking industry.14
C
REDITU
SEUp-to-date and comprehensive information about the universe of small businesses is sparse, and most evidence about financing needs and sources is derived largely from surveys. Researchers have learned a great deal about the financing of small businesses from various data sources and studies, particularly from the SSBF. This survey, which was conducted most recently for year-end 2003, provides the most comprehensive and up-to-date information available on small business use of financial services and providers.15
The 2003 SSBF gathered data from interviews with 4,240 small businesses between June 2004 and January 2005. The firms were selected to be representative of for-profit,
nonfarm, nonfinancial small businesses operating in the United States in December 2003. The survey gathered details on the characteristics of each business and its top three
owners, the firm=s income statement and balance sheet, and the use and sources of financial services. It also obtained information about the firm=s recent experiences in borrowing and applying for credit, the use of trade credit, and capital infusions. The previous survey had been conducted for fiscal year 1998 using a sample of 3,561 firms.
Data from the 2003 SSBF describe patterns of credit use by small businesses. Although this information is influenced by both demand and supply factors, it is nonetheless very useful in developing a picture of the demand for credit by small businesses. The data reveal patterns at both the aggregate and the firm levels.16
Although recent economic developments may have altered small business behavior from that reported in the 2003 SSBF, past surveys suggest that the 2003 results should still provide a good picture of current small business behavior because patterns in the use of credit by small businesses change slowly. When significant differences exist between the
13
A detailed description of the process of relationship lending and the way it differs from nonrelationship lending is provided by Berger and Udell (2002). Boot (2000) and Berger and Udell (1998) include detailed discussions of the costs and benefits of relationship lending, including a review of the literature.
14
Recent information on community banks and relationship lending is in Critchfield and others (2004) and Avery and Samolyk (2004).
15
More information on the 2003 SSBF is in Mach and Wolken (2006). Bitler, Robb, and Wolken (2001) report on the 1998 SSBF.
16
In this report, many of the figures based on data from the 1998 and 2003 SSBFs are presented in tables. However, some figures are computed from the survey data but not reported in tables. In such instances, the SSBF is cited as the source of the information.
1998 and the 2003 data, these differences are discussed to highlight potentially important trends in the use of credit by small businesses.
Types of Traditional Credit Used
Most small businesses use traditional types of credit, including loans taken down under lines of credit, mortgages used for business purposes, equipment loans, motor vehicle loans, capital leases, and Aother loans.@ In 2003, 60.4 percent of small businesses used one of these traditional forms of credit (table A.2). This incidence is slightly higher than the 55 percent that reported using traditional forms of credit in 1998.
Among all small businesses in 2003, several patterns in credit use are apparent from the figures in table A.2. Larger firms were more likely than smaller firms to use at least one of the traditional forms of credit. A large majority (94 percent) of firms with between 100 and 499 employees used credit, whereas about two-fifths of firms with fewer than two employees did. Among firms that used a traditional credit product, use increased with firm size. The median credit-using firm with between 100 and 499 employees had four credit lines, loans, or leases with a total outstanding balance of more than $870,000 (table 2). These figures are substantially higher than those for the median credit-using firm with fewer than two employees, which had one credit line, loan, or lease with a combined balance of $17,000.
Although these data reveal a strong association between firm size and the extent of borrowing, they cannot measure how much of the association may be due to relatively greater capital needs of larger firms and how much may be due to the greater difficulty that smaller firms have in obtaining credit. The relative demand for credit likely
increases with firm size because credit needs tend to expand with the scope of operations and inventories that a firm needs to hold. Size also tends to be associated with various characteristics of the firm that could affect its ability to gain access to credit from external sources. For example, larger firms tend to have more assets for collateral, are likely to be more diversified, and frequently have longer performance histories.
The share of small firms in each industry that used credit was highest for firms in
transportation (79.1 percent), construction and mining (70.7 percent), and manufacturing (70 percent). It was noticeably lower in the service sectors (56.4 percent in business services and 54.1 percent in professional services), which rely less on inventories or machinery (table A.2).
Different patterns of credit use among various firms exist not just for all credit lines, loans, and leases but for the individual products in this group as well. Patterns for each product are discussed below. Much of the data illustrating differences come from the 2003 SSBF and are presented in the appendix. Specifically, table A.2 reports the percentage of each firm type that used each of the traditional credit products, and table
Dollars except as noted Num-ber Balance Num-ber Balance Num-ber Balance Num-ber Balance All firms 2 38,983 1 15,030 1 108,487 1 20,000 Number of employees¹ 0-1 1 17,000 1 5,000 1 83,000 1 17,500 2-4 1 24,000 1 12,000 1 79,200 1 16,000 5-9 2 41,600 1 19,840 1 96,000 1 20,000 10-19 3 102,300 1 33,000 1 215,000 2 28,000 20-49 3 190,900 1 36,560 1 283,200 2 33,960 50-99 3 464,728 1 90,200 1 600,000 3 51,200 100-499 4 873,000 1 130,000 2 937,643 2 78,896
Standard Industrial Classification
Construction and mining (10-19) 2 40,000 1 10,400 1 78,000 1 25,000 Manufacturing (20-39) 2 60,000 1 20,000 1 181,000 1 20,000 Transportation (40-49) 2 70,000 1 18,120 1 65,000 2 30,000 Wholesale trade (50-51) 2 70,000 1 26,000 1 105,000 1 20,441 Retail trade (52-59) 2 50,000 1 20,073 1 133,600 1 20,000 Insurance and real estate (60-69) 2 75,120 1 20,000 1 164,838 1 15,200 Business services (70-79) 2 27,759 1 10,600 1 100,000 1 17,188 Professional services (80-89) 2 28,680 1 15,793 1 121,529 1 18,000
Source. 2003 Survey of Small Business Finances.
Table 2. Median number of accounts and median outstanding balances of traditional types of credit used by small businesses, by selected category of firm and credit type, 2003
Vehicle loan Any Credit line Mortgage loan
Category of firm
Note. Data are weighted to adjust for differences in sampling and response rates and reflect population rather than sample measures.
1. Number of owners working in the business plus number of full- and part-time workers.
A.8 reports the share of total outstanding balances in each of the traditional credit products by firm type.17 In addition, table 2 shows the median balances outstanding for each credit product. Figures from each of these three tables are cited in the discussion of specific credit products.
Credit Lines
As was true in 1998, credit lines were the most common traditional form of credit used by small businesses in 2003. Between 1998 and 2003, use of credit lines increased. In 1998, 28 percent of firms reported using credit lines; in 2003, more than one-third of all firms reported doing so. Credit lines accounted for 31.7 percent of the total dollar value
17
In this section, the terms share of outstanding credit and share of traditional credit outstanding are used interchangeably. In both instances, the denominator is the total dollar amount of outstanding traditional credit.
Table 2. --Continued Num-ber Balance Num-ber Balance Num-ber Balance All firms 1 20,663 1 8,080 1 40,400 Number of employees 0-1 1 15,600 1 3,600 1 17,000 2-4 1 6,200 1 5,560 1 18,712 5-9 1 21,000 1 6,800 1 38,800 10-19 1 36,000 1 14,800 1 100,000 20-49 1 62,000 1 20,000 1 140,800 50-99 1 156,728 2 65,000 1 310,000 100-499 2 506,546 2 69,000 2 900,000
Standard Industrial Classification
Construction and mining (10-19) 2 43,000 1 20,000 1 39,000 Manufacturing (20-39) 1 39,000 1 15,000 1 80,000 Transportation (40-49) 1 69,000 2 38,000 1 42,000 Wholesale trade (50-51) 1 16,000 2 14,839 1 84,000 Retail trade (52-59) 1 12,331 1 5,940 1 50,000 Insurance and real estate (60-69) 1 15,000 1 5,000 1 91,146 Business services (70-79) 1 16,582 1 10,374 1 20,078 Professional services (80-89) 1 12,228 1 6,000 1 30,000
Category of firm
Equipment loan Capital lease Other credit
of traditional credit outstanding. Among firms with lines of credit, the median firm had one line of credit with a credit limit of $50,000 and a balance of $15,030.
Substantial variation exists in the use of credit lines across industries. Credit lines were most important to firms involved in wholesale trade. In this industry, 49.4 percent of small firms used credit lines, which accounted for 55.3 percent of the value of all
traditional credit outstanding at these firms. Firms in the manufacturing industry and the construction and mining industry were also frequent users of lines of credit. Figures for the share of firms that used lines of credit and their share of traditional credit outstanding were 47.8 percent and 44.2 percent in manufacturing, and 44.6 percent and 27.3 percent in construction and mining. Heavy use by firms in these industries may be explained by the need to maintain large inventories, which is expensive and generally requires
financing. In contrast, among professional services firms, for which inventory may not be as important, only 29.4 percent of firms used lines of credit, a share that accounted for 21 percent of all outstanding traditional credit.
The use of credit lines was less common among younger firms than among older firms. Among firms with fewer than five years under current ownership, 30.2 percent used credit lines, compared with 39.3 percent of firms with twenty-five or more years under current ownership. At the same time, however, the share of traditional credit accounted
for by firms with open lines did not vary much with firm age. Credit lines accounted for about 30 percent of outstanding credit at both the youngest firms (those in operation fewer than five years) and the oldest firms (those in operation twenty-five years or more). Comparing firms with credit lines, the credit limit of the average firm with fewer than five years under current ownership was less than half the credit limit of older firms. The balances on the credit lines of these younger firms were also noticeably lower than those at the older firms, though the difference was not as large as the difference between the credit limits.
Credit-line use increased with firm size: Smaller small firms used this type of credit less frequently than larger small firms. This difference may reflect the lower credit needs of smaller firms, a reduced ability of young and small firms to obtain credit due to the greater information opacity, or the higher risks and costs associated with lending to such firms.
The SSBF data on credit lines provide additional insight into the demand and availability of small business credit. Table 3 shows the ratio of credit-line balance to credit limit for each firm type--that is, the percentage of available credit that each firm used in 1998 and 2003. These percentages increased somewhat for most categories of small businesses between 1998 and 2003, perhaps because of an increased demand for credit in 2003. However, in 2003, most types of small businesses reported using less than half of their available credit lines. Thus, while credit lines were used somewhat more intensively in 1998 than in 2003, most firms with credit lines apparently had additional credit available from unused lines.
Motor Vehicle Loans
Motor vehicle loans continue to be the second most commonly used type of traditional credit. In 1998, 20 percent of firms reported one or more motor vehicle loans. By 2003, more than one-fourth of all firms had reported outstanding motor vehicle loans. These loans, however, accounted for only 5.1 percent of the total amount of traditional credit outstanding because motor vehicle loans are small compared with the other types of credit. Of firms with motor vehicle loans, the median firm had one such loan with a balance of $20,000.
Motor vehicle loans were most frequently used in the construction and mining industry (43.9 percent) and in the transportation industry (42.9 percent), where these loans accounted for 14.4 and 11.5 percent of outstanding balances respectively. The median firm in the transportation industry that used this type of loan had two motor vehicle loans outstanding with a combined balance of $30,000, which was more than 50 percent larger than the median amount in any industry other than construction and mining.
Mortgage Loans
Approximately 13.3 percent of all firms had mortgage loans for business purposes, making this the third most commonly used type of credit. In terms of dollar amount,
Percent Category of firm 1998 2003 All firms 38.6 45.5 Number of employees¹ 0-1 37.1 48.7 2-4 41.1 40.7 5-9 50.5 50.8 10-19 34.3 38.3 20-49 29.9 41.4 50-99 43.4 46.0 100-499 39.6 48.4
Standard Industrial Classification
Construction and mining (10-19) 29.7 33.2 Manufacturing (20-39) 40.1 45.2 Transportation (40-49) 39.7 47.0 Wholesale trade (50-51) 29.2 47.2 Retail trade (52-59) 58.2 56.0 Insurance and real estate (60-69) 38.9 39.9 Business services (70-79) 47.6 50.0 Professional services (80-89) 27.9 31.0
Years under current ownership
0-4 46.8 53.6 5-9 47.5 46.5 10-14 39.2 50.1 15-19 32.1 44.7 20-24 30.3 43.3 25 or more 39.9 39.9 Organizational form Proprietorship 33.7 40.5 Partnership 39.1 38.0 S corporation 41.9 46.1 C corporation 35.9 47.7
Source. 2003 Survey of Small Business Finances.
Table 3. Percent of credit-line limits used by small businesses, by selected category of firm, 1998 and 2003
1. Number of owners working in the business plus number of full- and part-time workers.
Note. Data are weighted to adjust for differences in sampling and response rates and reflect population rather than sample measures.
mortgage loans were the largest form of credit, accounting for 39 percent of traditional credit outstanding. These figures do not represent a significant change from the results of the 1998 survey, which showed that mortgages were used by 13.2 percent of small
businesses and accounted for 35 percent of outstanding credit. Among the 13 percent of firms with mortgages, the median firm had one mortgage with a balance of $108,000.
The proportion of firms with mortgage loans used for business purposes increased with firm size. Only 5.6 percent of firms with fewer than two employees reported outstanding mortgages, whereas more than one-fourth of firms with 100 to 499 employees did so. In contrast, the proportion of traditional credit accounted for by mortgages fell with firm size. By organizational form, partnerships were the most likely to have outstanding mortgages, which accounted for nearly 68.3 percent of all outstanding credit.
Mortgage loans were the most important form of finance in the insurance and real estate industry. Mortgages were used by almost one-fourth of the small firms in the industry, and they accounted for 70.1 percent of the outstanding credit balances. Among firms in the industry that used mortgages, the median outstanding mortgage balance was
$165,000, which was about $60,000 more than the median outstanding mortgage for all firms.
Capital Leases
Capital leases, which are leases on equipment that are often provided by the manufacturer of the equipment or a subsidiary, were used somewhat less frequently in 2003 than in 1998. Between 1998 and 2003, the share of small businesses that used leases fell from 10.3 percent to 8.7 percent. The lease share of total outstanding traditional credit also fell from 5.8 percent in 1998 to 3.2 percent in 2003. Among firms that used capital leases in 2003, the median firm had one capital lease with an outstanding balance of roughly $8,000.
Capital leases, which include automobile and equipment leases, were most heavily used in transportation industries. These leases were used by 9.3 percent of firms in
transportation, a share that accounted for more than 20 percent of total outstanding credit. The median transportation firm had two leases, and the median outstanding balance of $69,000 was almost twice that for any other industry. Even though leases were
somewhat more common for firms in the manufacturing (10.9 percent) and professional services (13.5 percent) industries, their share of traditional credit outstanding was only a modest 2.6 percent in manufacturing and 3.2 percent in professional services. Of the firms in these industries with a lease, the median firm had a single lease.
Equipment Loans and Other Types of Credit
Equipment loans were used by 10.3 percent of all firms and accounted for 7.2 percent of outstanding credit. Among firms that had at least one equipment loan, the median firm had one such loan with a balance of $21,000.
Not surprisingly, equipment loans were most significant in industries that rely heavily on equipment: construction and mining (12.6 percent of balances), manufacturing (15.2 percent), and transportation (18.4 percent). They were also somewhat important in wholesale trade, in which they accounted for 11.3 percent of outstanding loan balances, but in all other major industries, equipment loans accounted for less than 10 percent of outstanding balances.
Finally, unspecified other types of credit were used by 10.1 percent of small businesses and accounted for 13.7 percent of outstanding credit. The median firm with at least one
Aother@ loan had one such loan outstanding with a balance of $40,000. Most of these loans were unsecured term loans. Approximately equal proportions of these loans were made by financial intermediaries or by family and friends.
Alternatives to Traditional Credit
Small business owners may turn to alternative forms of credit if they find themselves unable to obtain traditional forms or if they find the terms of these other products more favorable. Three such alternativesCcredit cards, trade credit, and owner loansCcan be examined using data from the 1998 and 2003 SSBFs. Widely used, these alternative forms of credit may be important both in financing small businesses and, as substitute products, in influencing the demand for traditional credit by small firms. According to the 2003 SSBF, 60.4 percent of small firms used a credit line, loan, or lease, but almost 89 percent used an alternative form of credit. Nearly 93 percent of small firms used either a traditional type of credit, a credit card, trade credit, or an owner loan.
Credit Cards
Credit cards can serve as a convenient alternative to paying expenses by cash or check if a business pays balances on time and in full each month. They can also substitute for traditional forms of credit when balances are carried month to month. Survey evidence suggests that credit cards are used primarily for convenience and that, despite a large increase in the use of credit cards between 1998 and 2003, small businesses have not substantially increased their use of credit cards as an alternative to traditional forms of credit.
Credit cards used for business purposes can be issued to the firm itself or to the owners of the firm, who may also use their personal credit cards for business expenses. Table 4 shows the percentage of small businesses that used personal credit cards, business credit cards, or either personal or business credit cards to pay for business expenses in 1998 and 2003. The use of credit cards by small businesses increased substantially between 1998 and 2003. In 2003, more than 77 percent of small businesses used either a business or a personal credit card to pay for business expenses--an increase of 9 percentage points over the 1998 percentage of firms using credit cards.
Percent
Any¹ Personal Business Paid
balance² Any¹ Personal Business Paid balance² All firms 68.0 46.0 34.1 76.3 77.3 46.7 48.1 70.7 Number of employees³ 0-1 59.0 45.6 20.0 75.2 69.5 48.6 32.0 69.6 2-4 65.3 47.1 28.8 72.5 76.4 48.1 45.7 65.9 5-9 73.4 45.4 43.2 76.5 81.0 47.8 56.8 68.5 10-19 80.0 51.5 50.8 78.5 85.0 45.6 59.7 79.4 20-49 81.9 41.7 56.9 88.5 81.5 34.4 61.7 85.2 50-99 75.2 31.3 58.6 94.1 81.9 34.6 63.5 93.9 100-499 76.8 23.7 62.5 97.5 82.9 32.2 71.4 92.4
Standard Industrial Classification
Construction and mining (10-19) 65.3 40.8 33.4 80.5 76.9 44.7 52.1 75.1 Manufacturing (20-39) 73.8 48.7 39.3 73.2 81.7 47.1 54.8 71.6 Transportation (40-49) 72.2 44.1 45.5 79.9 74.6 41.4 51.8 70.8 Wholesale trade (50-51) 75.1 45.8 46.3 80.8 81.3 46.7 54.4 76.2 Retail trade (52-59) 59.4 41.0 29.9 70.6 75.1 47.9 45.0 64.8 Insurance and real estate (60-69) 68.7 41.5 36.3 88.3 72.6 47.4 43.0 85.2 Business services (70-79) 64.4 47.0 28.3 70.2 76.3 45.2 47.0 66.4 Professional services (80-89) 76.8 53.9 36.2 80.5 80.0 48.8 47.1 71.7
Years under current ownership
0-4 66.4 46.0 28.7 68.9 73.7 45.2 46.6 67.5 5-9 72.5 48.7 38.2 74.0 77.3 44.6 49.7 63.4 10-14 68.2 46.6 34.3 79.1 80.9 49.8 48.7 72.2 15-19 67.7 43.7 37.5 78.7 79.5 48.5 52.3 71.9 20-24 66.5 46.2 34.2 84.1 79.6 46.9 50.7 74.9 25 or more 64.6 42.8 32.5 80.9 75.2 46.6 43.1 78.6 Organizational Form Proprietorship 62.3 49.6 21.9 71.7 73.0 52.3 35.1 66.6 Partnership 59.6 37.0 30.4 71.9 73.0 41.7 46.9 70.9 S corporation 77.4 44.2 47.3 80.0 83.4 43.5 61.6 70.4 C corporation 73.9 42.3 49.7 82.3 79.7 39.6 58.9 81.9
1. Percentage of firms that used either a personal or business credit card.
3. Number of owners working in the business plus number of full- and part-time workers. Source. 2003 Survey of Small Business Finances.
Table 4. Use of credit cards by small businesses, by selected category of firm, 1998 and 2003
1998 2003
2. Percentage of firms using either a personal or business credit card that paid off their credit card balances each month.
Category of firm
Note. Data are weighted to adjust for differences in sampling and response rates and reflect population rather than sample measures.