Value Creation in Private Equity
Have Norwegian Private Equity companies created value in
their portfolio companies?
Martin Andresen and Even Sandnes
Advisor: Carsten Bienz
Major: Financial Economics
NORGES
HANDELSHØYSKOLE
This thesis was written as a part of the Master of Science in Economics and Business Administration program - Major in International Business. Neither the institution, nor the advisor is responsible for the theories and methods used, or the results and conclusions drawn, through the approval of this thesis.
Table of Contents
TABLE OF CONTENTS ... 2 LIST OF FIGURES ... 4 ABSTRACT ... 5 1. INTRODUCTION ... 6 2. INDUSTRY PRESENTATION ... 82.1 WHAT IS PRIVATE EQUITY? ... 8
2.2 DIFFERENT TYPES OF PRIVATE EQUITY... 8
2.3 ORGANIZATION OF THE PE FUND ... 10
2.4 THE BUYOUT PROCESS ... 11
2.5 THE EVOLUTION OF PE ... 14
3. THE NORWEGIAN PE MARKET ... 16
3.1 FUNDRAISING ... 16
3.2 INVESTMENTS ... 17
3.3 DIVESTMENTS ... 18
3.4 THE CURRENT SITUATION AND FUTURE TRENDS/DEVELOPMENT ... 19
3.4.1 Europe in general ... 19
3.4.2 Norway ... 21
4. VALUE CREATION IN BUYOUT TRANSACTIONS ... 23
4.1 DIRECT DRIVERS ... 23
4.1.1 Revenue expansion ... 24
4.1.2 Cost-cutting and margin improvements ... 25
4.1.3 Improved asset utilization ... 26
4.1.4 Financial engineering ... 27
4.2 INDIRECT DRIVERS OF VALUE CREATION ... 29
4.2.1 Management incentives ... 30
4.2.2 Change in Corporate Governance ... 31
4.2.3 Reducing agency cost of free cash flow ... 32
4.2.4 Restoring entrepreneurial spirit ... 33
4.2.5 Advising and enabling ... 34
4.3 VALUE CREATION IN THE ACQUISITION AND NEGOTIATION PROCESS ... 35
4.3.1 Information Asymmetries and Market Inefficiency ... 35
4.3.2 Acquisition and Negotiation Skills ... 36
4.3.3 Changes in market valuation ... 37
4.3.4 Optimization of scope ... 37
5. PREVIOUS RESEARCH AND HYPOTHESES ... 38
5.1 PREVIOUS RESEARCH ... 38
5.2 HYPOTHESES ... 42
5.2.1 Hypothesis 1 (Revenue expansion) ... 43
5.2.3 Hypotheses 4-7 (Improved asset utilization) ... 44
5.2.4 Hypotheses 8-11 (Financial engineering) ... 44
5.2.5 Hypotheses 12 and 13 (Employment) ... 45
6. KEY RATIOS ... 47
6.1 LIQUIDITY RATIOS ... 47
6.2 SOLVENCY RATIOS ... 48
6.3 GROWTH RATIOS ... 49
6.4 PROFITABILITY AND EFFICIENCY RATIOS ... 49
6.5 OTHER RATIOS ... 51
7. DATA ... 52
7.1 IDENTIFYING THE PEFUNDS AND THE BUYOUT TRANSACTIONS ... 52
7.2 DATA GATHERING ... 53
7.3 PROBLEMS ... 54
7.4 SAMPLE DISTRIBUTION ... 55
8. PREPARATION AND METHODOLOGY ... 56
8.1 TIME PERIODS AND FINANCIAL INFORMATION NEEDED FOR TESTING ... 56
8.2 PEER GROUPS ... 56
8.3 ADD-ONS AND DIVESTITURES ... 57
8.4 STATISTICAL METHOD ... 58
9. RESULTS AND TESTING ... 60
9.1 REVENUE EXPANSION ... 61
9.2 COST REDUCTION/MARGIN IMPROVEMENTS ... 62
9.3 IMPROVED ASSET UTILIZATION ... 63
9.4 FINANCIAL ENGINEERING ... 66
9.5 EMPLOYMENT... 68
10. LIMITATIONS OF STUDY AND AREAS OF FUTURE RESEARCH ... 70
11. CONCLUSIONS ... 71 REFERENCES ... 73 LITERATURE: ... 73 INTERNET LINKS: ... 75 DEFINITIONS: ... 75 OTHER REFERENCES: ... 76 APPENDICES ... 77
APPENDIX I:ACCOUNTING VARIABLES ... 77
APPENDIX II:BO COMPANIES ... 77
APPENDIX III:PE COMPANIES ... 78
APPENDIX IV:COMPANIES PROVIDING ANNUAL REPORTS ... 78
List of figures
Figure 2.1 Classification of PE investments according to maturity of the target companies ... 9
Figure 2.2 Overview of the structure of a generic private equity fund ... 10
Figure 2.3 Characteristics of the Ideal LBO Candidate ... 11
Figure 2.4 An overview of the buyout process ... 12
Figure 2.5 Potential investment exit strategies for a PE fund. ... 14
Figure 3.1 Fundraising (in € mill) ... 17
Figure 3.2 Investments (in € mill) ... 18
Figure 3.3 Divestments/Exits (in € mill) ... 19
Figure 3.4 Volume and value of European Private Equity Backed Buyouts ... 20
Figure 4.1 Kraus and Litzenberger’s Tradeoff theory of Capital Structure ... 28
Figure 7.1 Sample distribution ... 55
Figure 9.1 Revenue Expansion (H1) ... 61
Figure 9.2 Cost reductions/Margin improvements (H2 and H3) ... 62
Figure 9.3 Improved capital productivity (H4-H7) ... 64
Figure 9.4 Financial Engineering (H8 and H9) ... 66
Figure 9.5 Financial Engineering (H10 and H11) ... 67
Abstract
This paper investigates value creation in 31 private equity-owned companies in Norway between 1993 and 2007. Its purpose is to find evidence on increased value capturing for these companies relative to non-private equity-owned companies. We have looked at the development of companies that have been engaged in a full leveraged buyout process with Norwegian private equity firms from entry to exit.
Value creation is made through several different drivers, which are thoroughly presented in this thesis. The empirical analysis in our thesis has been focusing on value creation through direct drivers since these drivers may easily be analyzed using publicly available data. By doing statistical tests on ratios that help explaining these drivers, we were able to present evidence on whether private equity-owned companies have been able to outperform their comparables during the private equity firms’ holding period.
Our results suggest that private equity firms have been successful in obtaining significant revenue expansion and cost reductions/margin improvements for their portfolio companies on an isolated basis. In terms of improved asset utilization and financial engineering we are unable to provide any adequate significant results. In addition, it seems like buyout companies do not experience any significant changes in employment or changes in levels of wage expenditures.
The industry-adjusted results suggest that buyout companies do not significantly outperform their corresponding peers in regard to revenue expansion and cost reductions/margin improvements. Buyout companies seem to have a somewhat stronger improvement in capital productivity than their peers, implying an outperformance from the buyout companies. Moreover, our results do not support any significant changes in long-term debt share during the holding period of private equity firms or large differences in long-term debt levels relative to their peers at entry, exit and exit +1. Finally, industry-adjusted employment growth and changes in levels of wage expenditures do not support any categorical beliefs about massive lay-offs or drastically reduced wage expenditures during the holding period of a private equity firm.
1. Introduction
Private equity is not a new type of investment activity for the world’s economists and businessmen. It has been well known in the US for decades and in Europe since the early 90s. Norway, however, has not had an active market for private equity until recently and has experienced an increased interest for this asset class during the last ten years. Our thesis will focus on the part of private equity called leveraged buyouts (LBO). We are interested in doing research on whether the Norwegian private equity players’ impact on Norwegian companies has made these companies able to outperform the companies that have not been involved in an LBO. Hopefully, we will be able to give the reader an understanding of how value is created in a buyout process in general, how LBOs differ from the more common approaches, and if Norwegian companies involved in such a process the last 15 years have benefited from active ownership.
Our own interest for private equity was especially provoked in the course Asset Management, lectured by Thore Johnsen at NHH. As we found that there had been extensive international research on private equity, but little research on only the Norwegian market, we found it interesting to perform similar research as those done internationally limited to the Norwegian private equity market. The young market for private equity in Norway implied somewhat challenging work regarding number of observations, but nevertheless we believe that our study is able to indicate some interesting points of the growing private equity market in Norway. We would like to thank Carsten Bienz, our academic advisor, and Nicolai Nordstrand from PricewaterhouseCoopers, for useful advice and guiding throughout the working process of our thesis. We would also direct profound gratitude to Håvard Gjerde from HitecVision for giving us useful insights on how buyout transactions work in practice.
We have collected publicly available data for several buyout transactions completed in Norway for the last 15 years including data for their peer groups. From this information we will try to test different hypotheses in relation to value creation in buyout processes. Preferably, we wanted to find the total value created between entry and exit and split this into different drivers of value creation. The main topic would then have been to look at the value capturing for the private equity firm. Unfortunately, it is difficult to obtain the information we need to perform this test due to the private equity firms’ lack of will to share
the information. Our method has therefore been to test some of the drivers separately, using publicly available data for the target companies and see if value has been created for the specific driver. We were not able to perform tests for every driver, as it is very difficult to quantify all of them. However, we have presented a detailed theoretical description for each of the drivers describing how the buyout process captures value for both private equity firms and their target companies.
2. Industry presentation
2.1 What is Private Equity?
Private Equity (PE) provides long-term, committed share capital, to help unquoted companies grow and succeed1.
While there are many factors distinguishing PE from public equity, we may from the definition comment on what may be three of the most important factors. The most important difference is the role of committed share capital, also explained as active ownership. PE investors will not only contribute with capital to the target company. Contribution through experience and knowledge are also important factors in order to create value in the company. A second difference from public equity is the market in which the capital is raised. Equity can be raised either in public or private markets. Public equity is typically offered through the stock markets, while PE firms usually invest in unquoted companies2. The third difference between PE and public equity is the investment horizon. PE investments tend to have a much longer investment horizon than funds that hold publicly-traded securities. There are several reasons for this. First, an active ownership makes a PE company more committed to its investment as it takes quite some time to create value in the company targeted. Second, securities issued by private companies are highly illiquid, since they are not traded in public securities markets. In addition, the opportunities for resale to another party are highly limited.
2.2 Different types of Private Equity
PE is often used as a generic term for both venture capital and buyout investments. These classifications stem from the maturity of the target company in which the PE firms invest. In relation to this, a framework based on EVCA (2007) is presented in figure 2.1. Venture capital (VC) investments focus on the first four stages, while Buyout (BO) investments focus on mature companies.
1
”A Guide to Private Equity” – 2004 version by BVCA 2
Figure 2.1 Classification of PE investments according to maturity of the target companies3
As we are focusing on buyouts we will try to discuss this in more detail: The buyout segment is often referred to as leveraged buyouts (LBO) and occurs when a financial sponsor acquires a controlling interest in a company’s equity and where a significant percentage of the purchase price is financed through leverage. Leveraged buyouts can be further classified into Management Buyouts (MBO), in which the current management seeks support from outside providers of both debt and equity capital to take control of the equity of the company from its previous owners, and Management Buy-ins (MBI), in which an external management team funded by outside investors takes control of a given target company. In both cases, the investor typically acquires a significant portion or takes majority control in the target firm, which entails a change of ownership.
3
EVCA 2007
Maturity of the portfolio companies Venture Capital
Seed Start-up Expansion Replacement Buyout
-Funding for research and concept development
-The business has typically not been set up yet.
-Financing for product development and initial marketing -The products have not yet been sold commercially -Companies not yet generating a profit -Financing for growth and expansion (increased capacity or market/product development) -Companies breaking even or trading profitably Purchase of shares from another investor or to reduce gearing via the refinancing of debt -Typically an acquisition of a significant portion or majority control of businesses with established business plans -Value creation through expansions, consolidations, turnarounds, spinouts etc. -Investment styles can vary widely
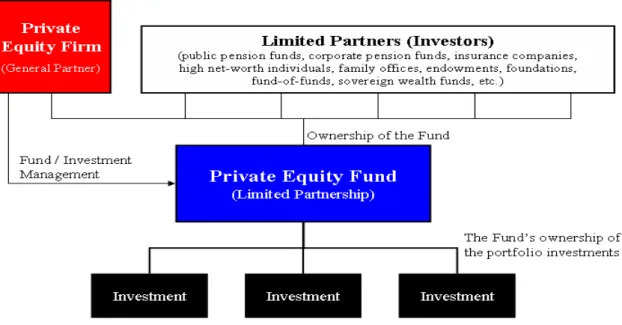
2.3 Organization of the PE fund
A PE fund is typically organized as a limited partnership and is normally intended to have an investment horizon of 10 years. Limited partnerships have evolved because few companies have the staff or expertise to invest directly into the asset class, and many who tried were not able to invest efficiently. The institutional investors act as limited partners (LP), and the investments are made by the manager, who is the general partner (GP)4. The general partners specialize in finding, structuring, and managing equity investments in closely held private companies. Because they are among the largest and most active shareholders in their portfolio companies, partnerships have significant means of both formal and informal control; they are thus able to direct companies to serve the interests of the LPs. Contracts and organizational structures are established to align the interests of both the general and limited partners. The capital provided by the LPs is either paid all at once or continuously throughout the investment period until exit. In Norway, the LPs with the largest capital bases are personal investors and parent companies5. However, since the Norwegian market for private equity investments is fairly young there is reason to believe that the Norwegian market soon will follow a similar pattern as the European market, where pension funds, banks and insurance companies act as the largest sources of capital.
Figure 2.2 Overview of the structure of a generic private equity fund
4
Ennis Knupp (2004). “Private Equity Overview” 5
2.4 The Buyout Process
The buyout process begins with a target selection phase, in which the PE firm screens the market for potential investment opportunities meeting certain rigid criteria for a successful LBO candidate as well as offering scope for value creation to meet the high levels of internal rate of return (IRR) PE fund investors demand. The criteria from which PE firms choose are many and depend on the investment style PE firms follow. Investment styles can vary widely between PE firms, ranging from “growth to value” and “early to late stage” strategies. Another PE firm investment strategy is the “buy-and-build” strategy where the important factor is to make synergies. The rationale for this strategy is that the new entity may not only generate value by exploiting synergies and cut costs, but also gaining critical mass and thereby making the company more attractive for a trade buyer or to be floated through an initial public offering (IPO). Buyout funds tend to invest in more mature companies with established business plans to finance expansions, consolidations, turnarounds and sales. The ideal LBO candidate is characterized by strong, non-cyclical and stable cash flows with significant unused borrowing capacity (Waite and Fridson 1989; Hall 1990; Lehn and Poulsen 1990). The following table summarizes key characteristics of an ideal LBO candidate:
Financial Business
Criteria
§ A history of demonstrated profitability and the ability to maintain above average profit margins
§ Strong, predictable cash flows to service the financing costs related to the acquisition
§ Readily separable assets or businesses which could be available for sale, if necessary
§ A strong management team
§ Products with well known brand names and strong market position
§ Status as a low cost producer within an industry, thereby creating the competitive advantage § Potential for real growth in the future
§ Not subject to prolonged cyclical swings in profitability
§ Products which are not subject to rapid technological change
Figure 2.3 Characteristics of the Ideal LBO Candidate6
As the majority of the transactions are privately negotiated, deals generally need to be treated highly confidentially in order to avoid the attention of competing buyers. As a
6
consequence, PE firms rely on superior contacts and industry knowledge to identify potential investment opportunities early.
The link between existing portfolio companies and potential takeover candidates is very unlike for PE firms and strategic acquirers, as PE firms do not put too much emphasis on aspects like resource relatedness or strategic fit between these (Baker and Montgomery, 1994). They would primarily rely on a set of generic criteria regarding industry-level dynamics and financial benchmarks. Even though many PE firms base their investments on the same basic criteria, there are a few of the firms that have successfully differentiated themselves from industry peers through a specification strategy. Such a specification may consist of factors like company size, geography, industry and level of acceptable technological risk.
The next step in the process is to find a suitable company to invest in, and once this is done the PE firm enters into the lengthy process of due diligence and deal structuring. During this process a detailed business plan for the proposed investment is being developed and the financial details of the transaction are negotiated with the current owner. Very often there are several PE firms trying to acquire the same company and the process may therefore look a lot like an auction where the PE firms submit their bid for the given takeover candidate. These bids do not only contain the actual proposed acquisition price, but also a detailed financial package. The package may outline level and conditions of the debt financing, details about debt service requirements and financial covenants as well as provisions regarding management co-ownership and incentive plans. It has been argued that the upfront agreed financial structure of a buyout investment determines a considerable part of the potential value creation by the PE firm (Baker and Montgomery, 1994).
Figure 2.4 An overview of the buyout process
Target selection
Due Diligence & Deal Structuring
Post-Acquisition
Management Exit
The Buyout Process: An overview
T A K E O V E R
When the future owner of the target company has been decided, the company becomes a part of the PE company’s portfolio. This is when the next phase starts, the post-acquisition management phase, in which the PE firm will start exercising its newly gained influence on managerial decisions of the target company. The post-acquisition phase is therefore considered as the most important phase for the value creation in the target company. During this phase the PE firm will determine the financial management of the target company going forward. This include things like introducing cost savings and active management of both sides of balance sheet, shifting the financial focus from earnings to cash flows, and supporting the target company’s management in their negotiations with its lenders. It is this phase we will be focusing on later when we analyze the drivers of value creation in a buyout process.
The PE firm tries not to be too actively involved in the operational management of their portfolio companies. Instead, they widely rely on the top management in the portfolio company to implement the jointly decided value creation strategies. To succeed with this strategy the PE firm puts in control a top management team of its choice at the time of the acquisition, hiring dedicated professionals if necessary. If it turns out that the new management fails the PE firm will swiftly make the necessary replacements required.
Successful private equity firms stay in business by raising a new fund every 3 to 5 years. A study of 200 public-to-private chemical buyouts by Butler (2001) shows that less than one third of the purchasers exited within five years, with an average holding period of 5.3 years7 between 1980 and 1995. If the current fund performs well, and LPs interpret the performance as a result of skill rather than luck, investors’ demand curve for the new fund will shift out, with the equilibrium conditions requiring that LPs earn their cost-of-capital after payments to the GP. In response to this demand shift, GPs may alter the terms of the new fund to earn higher expected revenue for each dollar under management. Alternatively they may increase the size of their next fund. They may also do both. Raising the size of the fund may entail additional costs, depending on the production function for the underlying private equity activities8.
7
The average holding period decreases to 4.4 if we look at 1980-2000 instead. 8
The most common exit strategies for an LBO include an outright sale of the company (trade sales or sale to another private equity house), a public offering or a recapitalization. Table 1 describes these four common exit scenarios.9
Figure 2.5 Potential investment exit strategies for a PE fund.
2.5 The evolution of PE
Private equity started developing in the United States during the second half of the 20th century. The idea behind the first professionally managed private equity investment10 was to create a counterpart to the financial institutions as the wealth distribution in the US at that time was only concentrated around these. The founders’ intention was to create a private institution that attracted institutional investors and provided capital and managerial expertise to acquired businesses.
Through the 50s, 60s and 70s the private equity industry evolved into a more professional business and the US Government passed on several new legislations in order to boost the industry. During these decades, however, venture capital was the most common way of financing, but since the number of new start ups during the 70s was quite low it forced fund managers to develop strategies for non-venture Private Equity capital allocation.
9
Center for private equity and entrepreneurship (2003). “Note on leveraged buyouts” 10
American Research and Development (ARD) in 1946.
Exit strategies Comments
Trade Sale Often the equity holders will seek an outright sale to a strategic buyer.
Initial Public Offering While an IPO is not likely to result in the sale of the entire entity, it does allow the buyer to realize a gain on its investment.
Recapitalization The equity holders may recapitalize by re-leveraging the entity, replacing equity with more debt, in order to extract cash from the company.
Sale to PE house This is probably the most popular exit strategy at the moment and is very similar to trade sale, except that the buyer is another financial player.
Consequently, large proportions of Private Equity capital were redirected to acquisitions of more established companies – the Leveraged Buyout was born.
The Private Equity industry experienced a substantial growth during the 1980s especially because of many important regulatory changes that gave the industry an increased access to capital.
In Europe, however, the development of the Private Equity industry traditionally lagged far behind the U.S. and only genuinely started making serious progress during the 1990s. The movement of assets from fixed income investments into equities and other products was accelerated in the late 1990s by the low inflation environment, with the creation of the Euro assuring free movement of capital. In addition, new capital gains tax legislation in European countries has been a recent catalyst for Private Equity investment in Europe.
3. The Norwegian PE market
The PE market in Norway is fairly small and relatively young compared to more developed European markets such as the UK and Sweden. The main reason for this is, according to Argentum, the lack of long-term institutional capital.11 Nevertheless, we have seen indications that this is about to change. During the last few years the market has experienced a boom in terms of number of funds, capital available and investment activity and this is mainly driven by increased allocation to this market by institutional investors, such as insurance companies, banks and pension funds.
According to NVCA there are 53 management companies located in Norway and in total these PE houses managed 103 PE funds in the end of 2007. At that time these funds managed a total of €5.2 billion in capital. We know that capital under management in August-October was €6.7 billion12, which represents a growth of 28.8% during the first 8-10 months in 2008. Out of these $6.7 billion, aggregated investments constituted €3 billion, while capital free for investment constituted €3.7 billion. However, the €6.7 billion managed by funds located in Norway is still only about 14% of the capital managed by funds located in Sweden. The portfolio companies of the PE funds employ over 40,000 people in Norway and generated €3.9 billion in value added in 2007. In other words, the portfolio companies to PE funds located in Norway currently accounts for 1.6% of the Norwegian GDP.
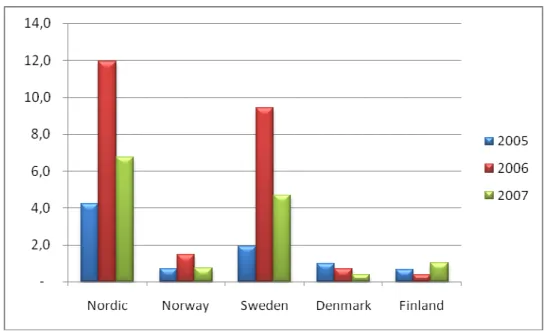
3.1 Fundraising
The Nordic countries in general accounted for 8.57% of the total fundraising to PE of €79.0 billion in Europe in 2007. The UK PE funds are by far the main contributors and hosted more than half of the 2007 fundraising by country of management. In terms of LP’s we observe that pension funds (23.0%), banks (15.6%), fund of funds (14.7%) and insurance companies (9.9%) are the top four sources of funding in Europe over the last 5 years13.
11
Argentum webpage 12
Menon Business Economics 13
Figure 3.1 Fundraising (in € mill)
An important difference between Norway and the rest of Europe is that private and corporate investors contributed with 37.66% of the new funds raised in 2007 in Norway compared to only 7.2% for Europe in total.14 Thus, even though the structure of sources of funding is about to change, the Norwegian PE market is still way much more dependent on private and corporate investors than elsewhere in Europe. As we can see from the figure above, Sweden is the main player in the Nordic region with Swedish PE funds accounting for roughly 69% of the fundraising in 2007. Norway, on the other hand accounts for 10.39% which is a lower contribution than in both 2005 and 2006.
3.2 Investments
On the investment side, we know that UK is the main platform for investments in Europe with UK PE funds accounting for 43.7% of the total investments in Europe in 2007. The fact that UK PE funds in addition are the only domestic funds that invest more abroad than home amplifies the position of UK in European PE. In Europe in general, 66.2% of the investments were made domestically in 2007, but only 40.3% of the fundraising was raised from domestic investors. The Nordic PE funds accounts for approximately 10% of the investments made in Europe in 2007 and Swedish PE funds completed 56.5% of these investments. Norway completed 13.1% of the Nordic investments in 2007, increasing from
14
8.6% in 2006. In Europe in general, 79% of the investments were done in the BO segment, while in Norway only 57.5% of the investments were done in the BO segment. This is the main difference between Norway and the rest of Europe on the investment side, but the proportion of BO is quickly catching up in Norway, increasing as much as 9.4% in 2007.
Figure 3.2 Investments (in € mill)
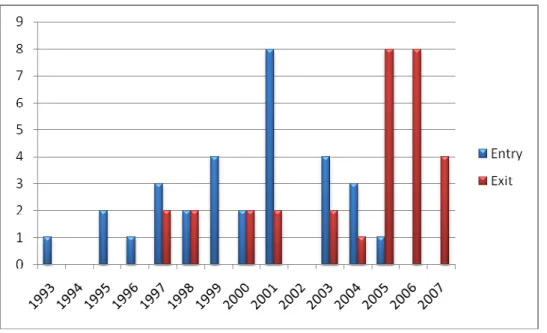
3.3 Divestments
2007 was the first year where the main exit route for PE funds in Europe was sales to other PE houses. Normally, trade sale has been the dominant one, but this exit route is now ranked second as exit channel. We observe that divestments by public offering were significantly reduced from 2006 to 2007 (from 16.2% to 9.9%) and dropped below the five-year European average. This decrease partly confirms the belief that public offering is a typically popular exit route when the market conditions are good and a less popular exit route when the market conditions are worse. Moreover, it gives us reason to believe that public offering as an exit route mostly was replaced with sales to other PE houses in 2007.
Figure 3.3 Divestments/Exits (in € mill)
For the Norwegian market however, we observed that public offering was the main exit route followed by trade sale in 2007. From the graph above we see that Norway contributed with 9.26% of the total divestments in the Nordic region.
3.4 The current situation and future trends/development
3.4.1 Europe in general
We observed a decline of 30% in total funds raised in Europe last year moving from €112.3 billion in 2006 to €79 billion in 2007. Even though this is still close to 10% above total funds raised in 2005, we have seen that the trend has continued in 2008 and further on in the beginning of 2009. While total value and volume of European Private Equity deals showed relative stability between Q4 2007 and Q3 2008, the decline only continued after the Lehman collapse in September 2008. According to the Unquote Q1 2009 barometer, total value of transactions fell by half against Q4 2008 to a shade over €4bn. Such levels have not been observed since Q3 1996, illustrating the seriousness of the situation. As we can see from figure 3.4, the picture is starkest for the buyout market and in terms of value the market is down by almost two thirds quarter-on-quarter to a little over €2.5bn.
Figure 3.4 Volume and value of European Private Equity Backed Buyouts
These numbers have not been seen since 1995 and in terms of volume we are back on the levels of 1992. Fundraising has proven to be a difficult task, especially in the wake of the credit crisis and many LPs have applied a wait-and-see approach. It may take months before LPs reach a decision on whether or not to contribute to funds, and if they eventually decide to contribute, they contribute with far less than before. According to Kimberly Romaine15 many LPs are contributing with just a fifth of their previous allocation.
The question is whether these horrific figures represent the bottom of the market. There is a predicted rise in attractive investment opportunities, coming from stressed or distressed organizations, private equity firms or public markets, which have not yet been materialized. The number of completed deals sourced from these vendor types have all dropped over the last three-month period, and the reason for this could have something to do with the uncertainty over pricing as well as leverage as there remains no visibility on trading and some vendors still have to adjust the new world order. When this begins to change, we should expect deal flow to pick up as there are still investors with cash to spend.16 When eventually the private equity activity recovers however, the industry will be a very different one from that of recent years according to Josh Lerner, professor at Harvard Business School.
15
Editor-in-chief of Unquote 16
3.4.2 Norway
Joachim Hoegh-Krohn, CEO of Argentum, stated in December 2008 that now is a good time to allocate capital to PE funds, even if risk management must be strengthened. One month later, Argentum received NOK2bn from the government in an attempt of getting others to contribute with fresh capital as well. Hoegh-Krohn said that the additional capital would go into “growth companies with the future ahead of themselves”17. However, Scandinavian PE firms have also struggled during the last exceptionally bad years. Swedish EQT is one of many PE firms which have invested in portfolio companies (Sanitec, Munksj and SPP) that have not been able to manage its debt18. The situation also applies for Nordic Capital through Thule and Plastal.
The PE firms are trying to negotiate improved conditions and write-offs of loans from their banks, but this constitutes a major problem for the banks. Many of the banks have the right to take control of the troubled portfolio companies if the situation gets too appalling, but the question is whether this is something that the banks want.19 Nonetheless, some banks are certainly willing to take this step and in May 2009 DnBNOR reported that they are taking over Kid Interiør from IK Investment Partner as a consequence of defaults on the portfolio company’s loans20.
In terms of future development in the Norwegian PE industry we see that international investors such as banks, insurance companies and pension funds today only contribute with 25% of the capital raised by funds, which is a small share compared to the rest of Europe. Most likely they will account for more of the capital raised in the years to come and there has already been a tendency of a more international approach to capital raising activities among Norwegian funds over the last years. Furthermore, PE investments by Norwegian insurance companies and pension funds account for as little as 0.7% of their total capital under management and these numbers represent a large potential for profitable portfolio diversification over the coming years.
17
”Argentum får to mrd” – Dagens Næringsliv Morgen 27.01.2009 18
”Bakrus etter oppkjøpsfest” - Dagens Næringsliv Morgen 02.03.2009 19
“Vurderer å svarteliste oppkjøpsfond” - Dagens Næringsliv Morgen 02.03.2009 20
Another interesting topic for PE investors is the major challenges an aging population represents for the economy. As an increasing number of existing owners of businesses in Norway grows old, the number of firms seeking new owners will mushroom. More than 50% of all strategic private ownership shares in Norway are owned by people older than 50 years. According to statistics NVCA has obtained21 more than 11,000 companies will search for new majority owners over the next 10 years due to aging. Many of the companies will be handed over to younger family members, but when the number of younger family members is reduced by an older population, the opportunity of out-of-family ownership change is increased. This will imply higher deal flows and potentially lower prices for PE investors, especially among more mature firms.
21
4. Value creation in buyout transactions
As mentioned earlier, our thesis will focus on value creation in the post-acquisition management phase (holding period). A further description of this phase will therefore be presented in this section. Furthermore, we will give a short presentation of value creation in the acquisition and negotiation phase.
Value creation in the holding period stems from various sources and has to be analyzed accordingly. Berg and Gottschalg (2003) differ between primary levers and secondary levers. Primary levers (direct drivers) refer to drivers which have a direct effect on the operating efficiency or relate to the utilization of assets in the target company. They are all easy to quantify since they directly affect and improve the free cash flow of the buyout company. Secondary levers (indirect drivers), on the other hand, refer to drivers which are non-operational and much more difficult to measure. Nevertheless, they will affect the overall value creation and moreover often be correlated with the primary levers. Thus, their importance should not be neglected.
In addition, PE firms may create value outside their holding period, through for instance superior acquisition and negotiation skills or information asymmetries and market inefficiencies. Berg and Gottschalg refer to this type of value creation as financial arbitrage. Financial arbitrage is mostly interesting for the PE company and not the target company, since the main purpose for the PE company basically is to push down the takeover price as low as possible. Financial arbitrage does not affect the underlying financial performance of the target company directly, but it does have a great impact on the total value creation from start to end for the PE company.
4.1 Direct drivers
We will first focus on direct drivers, which have a direct impact on the free cash flow and thus enhance the financial performance and causes real value creation for the acquired
company (Kitching 1989). A good illustration of how the enhancement of free cash flow causes value creation is the following formula22:
The value of a business is usually computed as the sum of the discounted value of future cash flows. N denotes the year of the anticipated cash flow. The direct drivers have in common that they all improve cash flow either through revenue expansion, cost-cutting and margin improvements, improved asset utilization or financial engineering.
4.1.1 Revenue expansion
Traditionally, buyouts have been viewed solely as a mean to address corporate inefficiencies (Wright 2001) and improving the operational effectiveness through the replacement of inefficient management teams (Anders 1992). However, this view has gone through a modification process along with the development of the PE industry the last decades. In order to achieve superior performance and value creation constant improvements in operational effectiveness are important, but usually not sufficient (Porter 1996). According to Singh (1990), buyout companies coming back to the capital market after a buyout phase, have experienced a significantly higher revenue growth than before the buyout. In addition, Butler (2001) emphasizes that a strong track record of either internal or external growth, significantly affects the valuation by future investors at the time of the exit through trade sale or an IPO. This implies that revenue expansion definitely should be considered as one of the drivers of value creation in buyouts. Much of the work of boosting revenue however, is related to an increase of the company’s strategic distinctiveness and a corporate refocusing.
One way PE firms accomplish higher revenue growth for its target companies is by achieving internal growth for its target company. This could be achieved through decision-making with the managers in the target company in order to increase the strategic distinctiveness and improve the competitive positioning of the company. The main intention with this work is to restore strategic focus and reduce the overall complexity (Phan and Hill
22
1995). Divisions or activities that are outside the company’s core business or do not represent a competitive advantage are often sold to another company that can utilize them in a better way. The decisions that are made range from decisions on which markets to compete in to which products to compete with and changes in pricing, product quality, customer service, customer mix and distribution channels are conducted if necessary (Muscarella and Vetsuypens 1990). This work is often done in conjunction with a strategy of increasing operational improvements and product cost awareness, so that even though revenues do not increase, each dollar of revenue that contribute to negative net income at least is eliminated (Gilbert and Strebel 1987).
Instead of boosting revenues internally, an alternative and quite common way of achieving revenue growth is to undertake add-on acquisitions of either new lines of business or to expand business scope in such areas in which distinctive competences and resources are strong compared to competition (Seth and Easterwood 1993). As stated in 2.4 many buyout transactions are intended to accomplish a “buy-and-build” strategy, in which a medium or large company with a strong management is bought and later, smaller (‘add-on’) targets in the market are bought and added to the existing platform. By doing so, the PE firm develop a large business with a significant market share and a strong position in the market place23. The rationale for these strategies is that synergies and economies of scales may be realized through consolidation and target companies may also reach the critical mass to be floated on a stock exchange, which could have been difficult, if not impossible, on a standalone basis.
4.1.2 Cost-cutting and margin improvements
Even though the traditional view of buyouts has been altered the last decades, the main drivers that have been associated with these transactions are still present today. According to Kaplan (1990) LBOs increase operating efficiency without massive layoffs or big cuts in R&D. Kaplan’s findings show that average operating earnings increase by 42% from the year prior to the buyout to the third year after the buyout and that cash flows increase by 96% over the same period. Other studies by Smith (1990a) and Lichtenberg and Siegel (1990) prove significant improvements in profit margins, sales per employee, working capital, inventories and receivables as well. Smith (1990a) also proves reductions in capital
23
expenditures, advertising expenditures and R&D expenditures. Jensen (1989a) suggests that organizational changes play the most important role for these efficiency gains and claim that this is the primary source of value creation from buyouts. Jensen’s view is partly supported by Smith (1990b), who shows a significant relationship between improvements in operating cash flows and buyout-induced changes in debt ratio and ownership structure. Typical organizational changes that are accomplished include tighten the control of corporate spending (Kaplan 1989b), initiation of cost reduction programs (Muscarella 1990) and reduction of corporate overhead costs through developing a less bureaucratic structure (Butler 2001).
4.1.3 Improved asset utilization
While the first two drivers focus on improvements in the P&L statement, the last two drivers are focusing on improvements directly in the balance sheet. It is quite common to increase capital productivity and reduce capital requirements in order to increase the overall operational effectiveness of the portfolio company. This is often achieved by making more efficient use of existing corporate assets, for example through an improved management of working capital, as the above mentioned research of Smith (1990a) proved. The PE firms are in many cases more capable of negotiating better terms with customers and suppliers and also implementing more efficient routines for their portfolio companies. Consequently, we would often see an acceleration of the collection of receivables, a reduction in inventory holding period and in some cases also an extension of payments to suppliers (Muscarella 1990). Simultaneously, the cash flows of the portfolio company are further enhanced through reduced capital expenditures, which lead to fewer unsound investment programs and divestments of unnecessary and underutilized assets (Phan and Hill 1995). In turn this results in a consolidation and reorganization of production facilities and an increase in operational performance and total factor productivity on one hand and additional cash flow to service debt on the other hand (Seth and Easterwood 1993).
According to the logic behind the market for control, inefficient management teams may cause companies to perform poorly24. Hence, companies that perform poorly because of inefficient management have been proposed as attractive takeover candidates, since
24
replacing inefficient management teams with more efficient management teams could remove the cause of such underperformance (Jensen 1983). Buyout companies may thus benefit from the appreciation in company value due to the performance increase. Moreover, the presence of a PE firm could lead already inefficient management teams to become more efficient from the risk of losing their jobs. They know that the PE firm is capable and willing to replace them if they continue to be inefficient and, together with establishing appropriate incentive programs for the managers, this apprehension would lead managers to divest low-synergy assets and cease spending cash on poor investment decisions with unattractive returns.
4.1.4 Financial engineering
In short terms, financial engineering refers to the optimization of capital structure and minimization of after-tax cost of capital of the portfolio company. Financial engineering is one of the most recognized ways of creating value in a buyout transaction.
We know that capital structure is the firm’s mix of debt and equity financing. There are many different flavors of debt, at least two flavors equity (common versus preferred), plus hybrids such as convertible bonds and the firm attempts to find the right combination of these to maximize its overall market value.
Modigliani and Miller (MM), who showed that payout policy does not matter in perfect capital markets, also showed that financing decisions do not matter in perfect markets (no transaction costs, taxes, bankruptcy costs, or asymmetric information). Their famous Proposition 1 states that a firm cannot change the total value of its securities just by splitting its cash flows into different streams: The firm’s value is determined by its real assets, not by the securities it issues. Thus capital structure is irrelevant as long as the firm’s investment decisions are taken as given.
Few financial managers, however, would accept this conclusion. The reason for this is that the MM theorem assumes perfect markets, and therefore, ignores things like taxes, bankruptcy costs, and potential conflicts between the firm’s security holders. The theorem also ignores the information problems that favor debt over equity when cash must be raised
from new security issues, and ignores the incentive effects of financial leverage on management’s investment and payout decisions. This knowledge may indicate that the mix of debt and equity financing actually do matter, and that a level of optimal debt for a company may exist. Kraus and Litzenberger’s figure below perfectly illustrates this belief. A typical target company for a PE firm is assumed to be on the left side of the point of optimal amount of debt.
Figure 4.1 Kraus and Litzenberger’s Tradeoff theory of Capital Structure
In addition, LBOs are normally carried out by borrowing a significant percentage of the purchase price from commercial banks, insurance companies and other financial institutions. The PE firm typically applies its knowledge of capital market mechanisms during the acquisition process and after the acquisition it shares its financial expertise with the target company (Anders 1992). Prior to the buyout, the PE firms are able to use their excellent contacts in order to negotiate the best available terms for the financing. After the buyout they continue to assist the target company in negotiating bank loans, bond underwritings, initial public offerings and subsequent stock sales and thus the portfolio company is able to negotiate terms which they would not have achieved on a standalone basis (Kaufman 1993). The PE firms are involved in these processes repeatedly and by being so, they gain a reputation as high profile clients and profitable borrowers at stake and lenders are more likely to deal at easier terms with them (Cotter and Peck 2001). The application of financial engineering skills helps the portfolio company to manage its balance sheet through an optimal use of capital markets and furthermore secures an optimal capital structure for the
company. Since this often implies an increase of debt for the portfolio company, buyout transactions are often referred to as leveraged buyouts.
A natural consequence of increased debt is large corporate tax savings and it has been argued that this should be identified as one of the main sources of value creation in buyout transactions. Kaplan (1989) argues that the increase in debt makes high-deductible interest payments necessary and provides a tax shield with a positive impact on cash flows, although the impact will vary across countries and time depending on tax regulations. The logical assumption however, is that the companies find themselves on the left side of the point of optimal amount of debt. If that is not the case, it is more likely that bankruptcy costs exceed the present value of interest tax shields.
4.2 Indirect Drivers of Value Creation
In addition to value creation from direct drivers, there are also other non-operational drivers of value creation which play an important role in the process. These drivers are called indirect drivers because they do not affect performance directly, but rather amplify the performance effects attributed to the direct drivers. Indirect drivers are related to the changes in the organizational, corporate governance and ownership structure. Research has shown that agency conflicts are highly relevant in the buyout context (Opler and Titman 1993), and buyouts are widely described as creating value through a reduction of agency costs (Jensen 1989a). By changing the organizational and ownership structure in a buyout transaction the PE firm becomes able to take advantage of the mechanisms around reduced agency costs, which in turn will lead to improved operating performance (Smith 1990a).
Agency conflicts may be explained by a well known theory called the Principal-agent theory25. The theory describes the problem that arises when a principal compensates an agent to perform certain duties which are useful to the principal and costly to the agent when experiencing information asymmetry, uncertainty and risk. Here, principals do not know enough about whether (or to what extent) a contract has been satisfied. The solution to the
25
information problem is to ensure the provision of appropriate incentives so that agents act according to how the principal wants.
The primary agency relationships in business theory are those (1) between stockholders and managers and (2) between debt holders and stockholders. A corporation’s managers may have personal goals that compete with the owner’s goal of maximization of shareholder wealth. Since the shareholders authorize managers to administer the firm’s assets, a potential conflict of interest exists between the two groups. Agency theory suggests that managers will seek to maximize their own utility at the expense of corporate shareholders. Agents have the ability to operate in their own self-interest rather than in the best interests of the firm because of asymmetry and uncertainty. Evidence of self-interested managerial behavior includes the consumption of some corporate resources in the form of perquisites and the avoidance of optimal risk positions, whereby risk-averse managers bypass profitable opportunities in which the firm's shareholders would prefer they invest. Managers may be encouraged to act in the stockholders' best interests through incentives, constraints, and punishments. These methods, however, are effective only if shareholders can observe all of the actions taken by managers.
We will clarify the mechanisms related to indirect drivers throughout section 4.2.
4.2.1 Management incentives
Buyouts increase the incentive alignment between shareholders and managers through a combination of a “carrot” and a “stick” mechanism (Cotter and Peck 2001). First, managers' share ownership significantly increases, giving them incentives to work harder (the “carrot”). Second, firms borrow heavily to finance the purchase of publicly held stock. The ensuing heavy debt burden forces managers to efficiently run the company to avoid default (the “stick”). Thus, a high debt level could provide benefits that outweigh the higher expected bankruptcy and agency costs normally associated with high debt levels26. In addition, third-party investors often acquire a large equity stake in the LBO, giving these investors incentives to motivate and monitor managers. Managers are encouraged (if not forced) to increase their share in equity ownership in the company to a significant level. It is expected
26
that this increase in the equity stake of the management directly increases the personal costs of inefficiency (Smith, 1990b) and reduces their incentives to shirk (Smith 1990a). Furthermore, the change in status, from manager to co-owner could increase financial performance because it gives managers a positive incentive to look for efficiency gains and smart strategic moves. Their equity participation gives them a greater stake in any value-increasing actions that are taken and thus leads to better operating and investment decisions. As the equity investment is un-diversifiable and the managers’ human capital will be locked into the company by this construction it gives them a double-lock that should boost a strong motivation to safeguard their position (Wright, Thompson et al. 1992a).
A potential drawback for increased managerial ownership in equity can be that financial performance decreases due to managerial risk aversion and a potential under-diversification of managers’ wealth (Fama and Jensen 1985). Furthermore, a concentrated managerial ownership of equity may lead to inefficient discipline mechanisms such as the market for corporate control and managerial labor markets, which then will result in a decline in performance as well (Demsetz 1983).
In addition to the change in managerial incentives, buyouts may increase the incentive alignment for employees as well through so-called pay-to-performance schemes. New incentive systems are being implemented and employee contracts are being adapted in order to step up motivation to achieve the key goals of the organization, including changes in the way employees get evaluated and compensated (Baker and Wruck 1989). These employee incentive schemes are not necessarily only restricted to upper and middle management, but they make the rewards to managers and employees highly sensitive to the performance of their particular business unit. The use of incentives is consistent with the view that they favor the owners and reduce managerial opportunism. This belief is supported by Wright and Robbie (1996), who empirically demonstrated that incentives were negatively related to MBO failure.
4.2.2 Change in Corporate Governance
The change of incentives in buyouts is usually closely linked to a transformation and improvement of corporate governance structures that increase the possibilities of reducing
agency conflicts through monitoring and controlling the company management (Singh 1990). The greater concentration of equity in the hands of active investors encourages closer monitoring and leads to a more active representation in the board of directors (Lowenstein 1985). An active investor may be described as a person or party who “monitors management, sits on boards, is sometimes involved in dismissing management, is often intimately involved in the strategic direction of the company and on occasion even manages” (Jensen 1989a). One advantage of monitoring and increasing involvement of the board would be the opportunity to obtain direct access to confidential information about the company. Another advantage is the possibility of regularly evaluate the portfolio company’s management.
4.2.3 Reducing agency cost of free cash flow
The use of significant amounts of debt in a buyout transaction does not only represent an important factor for the financing structure of the transaction, but also limits managerial discretion. It has been emphasized that debt used to finance the buyouts helps to limit the waste of free cash flow by compelling managers to service debt payments rather than spend it inefficiently within the firm (Jensen 1989a and Jensen 1989b). It will also reduce managers’ discretion over corporate expenditures27 (Grossman and Hart 1982) and limit possible non-value maximizing behavior (Newbould and Chaffield 1992). Therefore, the debt burden forces managers to efficiently run the company in order to avoid default.
Bankruptcy is costly for managers, as they lose the benefits of control and reputation, including their jobs. Consequently, high leverage and increased default risk can create an incentive for managers to work harder, consume fewer perquisites and make better investment decisions, and such behavior reduces the probability of bankruptcy.
Another positive effect is the role of the financial lenders as they have strong incentives to monitor the managements’ actions and make sure that the company is able to fulfill its duties. The debt covenants and repayment requirements serve as a sort of operating budget for the buyout company and provide clear constraints for the management (Baker and Wruck 1989; Baker and Montgomery 1994).
27
A number of empirical studies have shown that expenditures decline following a leveraged buyout (Bull 1989; Kaplan 1989; Kitching 1989; Muscarella and Vetsuypens 1990; Smith 1990a).
However, it is worth mentioning that high leverage can have its downsides as well. One of the main arguments against high leverage is the increased exposure to external shocks (e.g., increase in interest rates, shortfall in demand) and financial distress (Singh 1990). As noted in 3.4.2, a number of portfolio companies to different PE firms have experienced serious difficulties due to the current economic downturn. However, even though the consequences are less severe, the increased financial leverage can make a firm short-term oriented because of its vulnerability to financial distress, leading to a decline in long-term competitiveness (Palepu 1990).
Moreover, significant financial leverage could lead to non-value maximizing project selection decisions by managers due to managerial risk aversion: high leverage could cause risk-averse managers to alter their investment decisions. For example, decrease the risk of the assets of the firm in order to reduce the likelihood of default (Myers 1984). Conversely, Jensen (1989a) argues that the risk of insolvency of buyout firms and the associated costs of financial distress are much lower than proclaimed, since financial innovations and the interest of all parties of a successful workout process reduces bankruptcy risk considerably (referred to as “privatization of bankruptcy”).
4.2.4 Restoring entrepreneurial spirit
Lack of entrepreneurial spirit is something that many acquired companies in buyout transactions suffer from. There are several reasons for this and some of them include cases where non-core units of large corporations do not receive the necessary attention or resources from corporate headquarters to pursue innovative strategies or where risk-aversion lead to an unfavorable climate for entrepreneurial activities. By giving the management of the portfolio companies sufficient freedom to develop and realize innovative ideas, the PE firm may contribute to the restoration of an entrepreneurial climate. The changed governance and new institutional structure make managers of post-buyout companies feel released from corporate bureaucracy and of central importance, as many PE companies reduce their interference with day-to-day operational issues to a minimum, as long as financial targets are met. Wright et al (2001) highlighted that managers of pre-buyout organizations were discouraged if their divisions provided profitable and innovative investment opportunities but were limited in their discretion because of the fact that the division was not regarded
central to the parent organization. According to Singh (1990) “buyouts provide the imagery as a creative way to reintroduce an entrepreneurial drive in the publicly held firm”, as management feels and acts as entrepreneurs under the new organization, relived from constraints of corporate headquarter and thus encouraged to make independent decisions (Jensen 1989a). Researchers describe this effect as “LBO fever” or “adrenalin”: energized and highly motivated management teams are willing to take nearly any action to make their buyout a success (Samdani et al 2001). This includes taking unpopular and difficult decisions like cutting jobs and disposing businesses.
4.2.5 Advising and enabling
Another important aspect relates to the constructive interaction between BO company managers and PE firm, which is often facilitated through direct and less bureaucratic communication channels (Kester and Luehrman 1995). In practice, decisions can be taken much more freely and independently by BO management as they are well aware of strategic direction and the responsible PE firm partner is just a phone call away from discussing and signing off more difficult decisions. While the investment managers in the PE firm typically stay free of day-to-day operations, they are still much closer to operations and management than conglomerate headquarters or the board of directors in traditional organizations (Bull 1989).
Furthermore, PE firms transfer substantial additional knowledge into the BO company, such as management expertise and industry experience acquired in previous transactions in which they have participated (Baker and Smith 1998). This cross-utilization of managerial talent may represent a valuable and not otherwise readily available resource to the target company. In addition, the PE firm frequently recruits outside advisors with industry expertise into the company. Their network with financial services and the investor community helps the company to get better access to financial markets and prepares it for an eventual exit through an IPO or trade sale.
4.3 Value Creation in the Acquisition and Negotiation
Process
So far we have only discussed value creation related to the post-buyout period. However, value in leveraged buyout is often already created before signing the share purchase agreement, since a lot of value can be captured during the acquisition and negotiation process. These value drivers can be related to information asymmetries and capital market inefficiencies or superior negotiation skills. Haspeslagh and Jemison (1991) have put it this way: “A PE firm’s ability to capture value through buyout acquisitions rests largely on the skills of a small but highly experienced cadre of legal and financial experts and operating managers with well-developed expertise in analysis and deal-making”. These sources of value creation are rather indirect in nature, but from a direct perspective they mainly relate to the transaction multiple arbitrage between entry and exit multiple. The process prior to takeover usually creates more value for the PE investors than for the target company since this value creation relates to the price the PE firm has to pay and not to operational improvements for the target company.
4.3.1 Information Asymmetries and Market Inefficiency
Leveraged buyouts have been widely criticized for exploiting inside information to create value in the transactions. The reason for the apparent controversy is that managers are subject to severe conflicts of interest in buyout transactions, because they cannot simultaneously act as both buyer and agent for the seller (Jensen 1989a). It is therefore especially leveraged buyouts involving management buyouts that have been scrutinized by research. Lowenstein (1985) reports a range of insider techniques and options that pre-buyout management has available to depress the valuation of the company. Because the management is the essential source of the business plan for the acquired company, an opportunistic management team could take advantage of their insider information and misrepresent the future business and earnings development of the company. This will result in wealth being transferred from selling shareholders to management (acquirer) as a result of inside information. Effectively, management would buy a company for less than a similarly informed bidder would be willing to pay, and informed owners would be willing to accept.
However, there are various arguments to support the fact that information asymmetries are not a major source of value creation in buyouts, but rather contribute to managers’ motivation to initiate a buyout (Lee 1992). A way of addressing the conflict of interests is through court decisions where open auctions and the use of independent committees on the board of directors as well as an independent external council are present (KKR 1989). Moreover, the use of limited auctions for the acquisition process regularly involves extensive disclosure requirements prepared by outside advisors, which lowers the opportunity for managers of buyout targets to systematically conceal information about business and earnings prospects from the acquiring party (Lowenstein 1985). If we assume somewhat efficient capital markets, the exploitation of inside information should be prevented by increasingly educated investors and the open auction’s monitoring routines (Jensen 1989b). As a result of these counter-arguments to information asymmetry as source of value creation, Singh (1990) concludes that “the pure managerial opportunism argument implies a higher level of manipulation of superior information by management teams than is feasible in a competitive acquisition environment”. This is also to some extent demonstrated by the decreasing returns for LBO transactions experienced over the recent years as competition for deals among PE firms has intensified (Reyes and Mendell 2004).
4.3.2 Acquisition and Negotiation Skills
Financial buyers have consistently paid less than the strategic buyers for their acquisitions during the 1990s (Butler 2001). This may be explained from the more dispassionate approach financial buyers have compared to strategic buyers, as they screen dozens of deals for every one they execute and strategic buyers are restricted to their respective industry and a few targets. Strategic buyers tend to overestimate synergies or get carried away in the auction of the prize of the asset (Butler 2001), so PE firms may therefore often choose to avoid too competitive auctions as they already know that the competitive bidders are going to pay too much. Another explanation for why PE firms pay less is that they have developed excellent deal negotiation skills. They are tough negotiators and tend to negotiate downward from prices which in principle had been accepted earlier during the due-diligence phase. Especially if they find themselves as the sole bidder, they are skilled at finding problems in