Is the job satisfaction of primary care
team members associated with patient
satisfaction?
Joachim Szecsenyi,
1,2Katja Goetz,
1Stephen Campbell,
1,3Bjoern Broge,
2Bernd Reuschenbach,
1Michel Wensing
1,4Background:Previous research has shown a correlation between physician job satisfaction and patient satisfaction with quality of care, but the connection between job satisfaction of other primary care team members and patient satisfaction is yet unclear. Objective:To evaluate whether there is an association between patient satisfaction and job satisfaction of the members of patient care teams.
Design:The study was based on data from the European Practice Assessment and used an observational design.
Setting:676 primary care practices in Germany. Participants:47 168 patients, 676 general practitioners (practice principals), 305 physician colleagues (trainees and permanently employed physicians) and 3011 non-physician practice members (nurses, secretaries). Main outcome measures:Patient evaluation was measured using the 23-item EUROPEP questionnaire. Job satisfaction was measured using the 10-item WarreCookeWall job satisfaction scale and further items relating to practice structure. Bivariate correlations were applied in which factors of patient satisfaction and practice structure were compared with physicians and non-physicians satisfaction.
Results:Patient satisfaction correlates positively with the general job satisfaction of the non-physician (r¼0.25, p<0.01) and no significant correlation was found for the general job satisfaction of practice principals and physician colleagues. Patients’ satisfaction with the practice organisation correlates positively with the general job satisfaction of the non-physicians (r¼0.30, p<0.01) and their view of practice structure (r¼0.29, p<0.01).
Conclusions:The correlation between non-physician team member satisfaction and patient satisfaction was higher than the correlation between satisfaction of physicians and patients. Patients seem to be sensitive to aspects of practice structure.
INTRODUCTION
An important issue in healthcare is the rela-tion between job satisfacrela-tion of primary care
team members and patient satisfaction. Traditional job satisfaction relates to the feeling an individual has about his/her job. It is distinguished between intrinsic (recogni-tion, work itself or responsibility) and
extrinsic factors (working condition,
company policy or salary) which have an influence of job satisfaction.1 General prac-titioners as well as non-physician members are generally satisfied with their work.2
In addition, patient satisfaction consists of a combination of patients’ expectations regarding healthcare providers and actual experiences.3 It has been observed that patients are highly satisfied with their care.4 Patient satisfaction with care and job satis-faction among healthcare providers are being recognised as an important dimension within quality of care.
It has been shown that physicians’ job satisfaction is associated with patients’ satis-faction.5 Moreover, there is a relation between nurses’ job dissatisfaction and patients’ satisfaction with the quality of their care in hospitals.6 In general, patients’ perspective on their care is highly associated with non-physician and physician factors, a first overview is given in Laurant et al7 Furthermore, the working condition of
physicians and non-physicians have an
important impact on the quality of care.8In particular, a higher workload is associated with lower performance at primary care practices.9It is remarkable that there is a lack of research about the influence of physician and non-physician satisfaction on patient evaluations of quality of services in general practice at the moment.
The aim of the study was to explore any link between the satisfaction of the physician and non-physician practice members and patient satisfaction. Non-physician practice 1Department of General
Practice and Health Services Research, University Hospital, University of Heidelberg, Germany
2AQUA-Institute for Applied
Quality Improvement and Research in Health Care, Goettingen, Germany
3National Primary Care
Research and Development Centre, University of Manchester, UK
4
IQ Health Care, University Medical Centre St Radboud, Nijmegen, The Netherlands
Correspondence to Joachim Szecsenyi, Professor Head of Department and of AQUA-Institute, Department of General Practice and Health Services Research, University Hospital, University of Heidelberg, Vossstrasse 2, D-69115 Heidelberg, Germany; joachim.szecsenyi@med. uni-heidelberg.de Accepted 25 October 2010
This paper is freely available online under the BMJ Journals unlocked scheme, see http://qshc.bmj.com/site/ about/unlocked.xhtml
members are defined here as practice nurses, practice managers or secretaries/administrators. Physician and non-physician practice member satisfaction was seen as the independent variable which might influence patient satisfaction. Three research questions were tested: First, is there an association between non-physicians’ satisfac-tion and patient satisfacsatisfac-tion? Second, is the influence of non-physicians satisfaction on patient satisfaction higher than the influence of physician satisfaction on patient satisfaction? Third, does workload affect patient and non-physician satisfaction similarly?
METHODS
Design and study population
Since 2005, participation in quality management activi-ties is mandatory in Germany according to the Social Code Book V. General practices can choose from different quality management programmes and options. One of them is the European Practice Assessment (EPA) instrument which was developed and validated by an international collaboration of researchers and practi-tioners from nine countries between 2001 and 2004.10 11 It consists of a set of validated quality indicators for external and self-assessment, a patient survey, a staff job satisfaction survey, an outreach visit by a trained visitor, a team-meeting and a comparison with other practices. All activities aim to motivate practices to improve their management and services for their patients.
This study comprised of 679 primary care practices in Germany which had volunteered to participate. None of the 32 pilot practices from the pilot study or from 25 additional early implementers in Germany are included in this sample because they were considered as ‘pioneers’.12 All practices had to contribute with an amount of approximately €1.75 000, on average, covering the costs for all materials and surveys including feedback and the practice visit. Data collection took place between May 2004 and September 2007.
In each practice patients were asked consecutively to complete the EUROPEP questionnaire in the waiting room, put it in an envelope and place it in a sealed box. Patient participation in the study was voluntary and anonymous. Patients were informed orally and on the header of the forms that the aim of the study was to improve management of the practice and its services and staff and that they could refuse participation for any reason. Exclusion criteria included those under 18 years and anyone unable to read and/or understand the German language or unable to answer written questions without support. The sealed box was forwarded directly to the research team.
To measure job satisfaction all team members (physi-cians and non-physi(physi-cians) completed the staff
question-naire during their working hours. They returned it individually to the research team in a pre-paid envelope.
Ethics
An ethical approval was not necessary. Our study used data from the routine implementation of quality management in ambulatory care in Germany, according to the social code book V and the directives on quality management of the Federal Joint Committee. The questionnaires were completed anonymously. No addi-tional information or data from patients or staff were requested to perform this study.
Measures
To measure the patient satisfaction with quality of care and the job satisfaction of the team members two ques-tionnaires were used, which are part of the EPA.10 Patient satisfaction was measured by the EUROPEP questionnaire.13 It is an established and internationally validated instrument reflecting a set of indicators for patients to evaluate the quality of primary care. The instrument consists of 23 items; 5-point Likert Scale was used (‘poor’ to ‘excellent’). Additionally, two further items of the EPA-questionnaire are integrated which ask about ‘the intention not to change the practice’ and ‘the willingness to recommend the practice for friends’; also 5-point Likert Scale was used (‘fully disagree’ to ‘fully agree’).
Job satisfaction was measured by the German version of the WarreCookeWall job satisfaction scale developed by Warr et al.14 The instrument consists of 10 items; 7-point Likert Scale was used (‘extreme dissatisfaction’
to ‘extreme satisfaction’). Each team member
completed the same questionnaire. The non-physician staff were further asked about their estimation of the practice organisation with four items; 5-point Likert scale were used (‘fully disagree’ to ‘fully agree’). The items asked about the responsibility of the staff members, the general work atmosphere within the team, offering suggestions for improvement and the proposals for improvement were taken seriously. Each partici-pating practice met the criteria of at least one physician, one team-member and more than 50 completed patientsequestionnaires. A further variable, which might contribute to the job and patient satisfaction, is work-load. Within the EPA information on the number of patients with at least one contact per quarter of a year (which is a common denominator in countries without a patient list system)15 and on the number of team members is routinely collected.
Data analysis
The data were analysed by SPSS 18.0 (SPSS Inc.). The 23 items of EUROPEP-questionnaire were summarised by
exploratory factor analysis with principal axis factor analysis (principal component method) and a number of factors were determined by the scree test and number of eigen values >1. The solution was rotated using the varimax rotation. The KaisereMeyereOlkin measure of sampling adequacy was reported (table 1). Two factors were extracted (factor I ‘evaluation of the physician’ and factor II ‘evaluation of the organisation of the practice/ team’) with explained variance of R2¼60.06%. Addi-tionally, the items ‘the intention not to change the practice’ and ‘the willingness to recommend the practice for friends’ were summarised by mean and accumulated the factor III (‘intention not to change the practice’). All three factors were aggregated by mean of practice level. The WCW job satisfaction items were compared between the three groups of practice staff (physician, practice colleague, non-physician staff) by using ANOVA; mean and corresponding 95% CIs were presented.
Furthermore, we used the False Discovery Rate,
a correction technique for multiple testing.16 17
The measurement of job satisfaction using the WCW job satisfaction scale revealed a different number of factors (one to two factors) by factor-analytical extraction in the three groups (physician, practice colleague, nurse) with explained variance between R2¼48.58% and 59.39%. For this reason, the mean of all items of the WCW job satisfaction scale were used to getting an overall evaluation of job satisfaction. Therefore, we had one item which explained the general job satisfaction of the three participating groups. This itemdthe general job satisfactiondwas aggregated up to the practice level. Accordingly, the sample size for the correlation analysis was n¼676.
Furthermore, the four items which asked about the evaluation of the practice organisation in the view of the non-physicians were summarised by mean and accumu-lated a new item which is called ‘practice structure in the view of non-physicians’.
For each groupdpractice principals, practice colleagues and non-physiciansdthe data of job satisfac-tion, practice structure, quarterly contact group, etc were correlated by the three factors of patient satisfaction (‘evaluation of the physician’; ‘evaluation of the organisation of the practice/team’ and ‘intention not to change the practice’) by using bivariate correlation. An
a
level of p#0.05 was used for tests of statistical signifi-cance. However, as this was an exploratory analysis, p values should be interpreted carefully.RESULTS
Data were collected from 47 168 patients, 676 GP prin-cipals, 305 physician colleagues and 3011 non-physician practice members. The participating practices are
representative for primary care in Germany concerning the number of single-handed practices, location, the full time equivalent or the number of physicians per prac-tice. The descriptive data of practices and participants are presented inbox 1andtable 2.
Out of the 50 700 patient questionnaires handed out, 47 168 were returned, giving a response rate of 93.0%. For the questionnaires for practice principals on job satisfaction the response rate was 100.0% (for principals) and for practice colleagues was 93.2% (305 out of 327). For the non-physicians it was 90.2% (3011 of 3337), respectively.
83.7% of all patients chose options ‘4’ and ‘5’ on the 5-point-scale (‘poor’ to ‘excellent’) in the EUROPEP questions. Table 1 includes the descriptive data of the EUROPEP questionnaire.
The random effect of the practices was very small and thus neglected. The variance between practices is too small in relation to the overall variance (f-value of 0.152). Job satisfaction by physicians and within practice teams were generally high. The descriptive data of WCW job satisfaction scale and the level of significance by
using False Discovery Rate for all
partic-ipantsdphysician, physician colleagues and nurse is presented intable 3. Mainly differences are shown in the items ‘hours of work’ and ‘income’ regarding the comparison of the three participants.
In summary, the principal physician rated the job satisfaction with mean¼5.32 (SD¼0.93) on the 7-point-Likert scale (‘extreme dissatisfaction’ to ‘extreme satis-faction’). The physicians colleagues reached mean¼5.45 (SD¼0.89) and the non-physicians reached a value of mean¼5.71 (SD¼0.91).
According to our three research questions, table 4
shows the correlation between the three factors of patient satisfaction and items of the practice principals, practice colleagues and non-physicians. Factor I (‘eval-uation of the physician’) reached a mean value of mean¼4.17 (SD¼0.21), factor II (‘evaluation of the organisation of the practice/team’) reached a value of mean¼4.09 (SD¼0.27) and factor III (‘intention not to change the practice’) reached a value of mean¼4.34 (SD¼0.26). Table 4 presents a description of relation-ships between factors of patient satisfaction and satis-faction of professionals.
Association between non-physicians’ satisfaction and patient’ satisfaction
The correlation between non-physician team members’ satisfaction and patient satisfaction was significantly positive. They ranged between r¼0.15 (p<0.001) and r¼0.309 (p<0.001). High job satisfaction by non-physi-cians was associated with high patient satisfaction. This positive correlation relates to the factor I (‘evaluation of
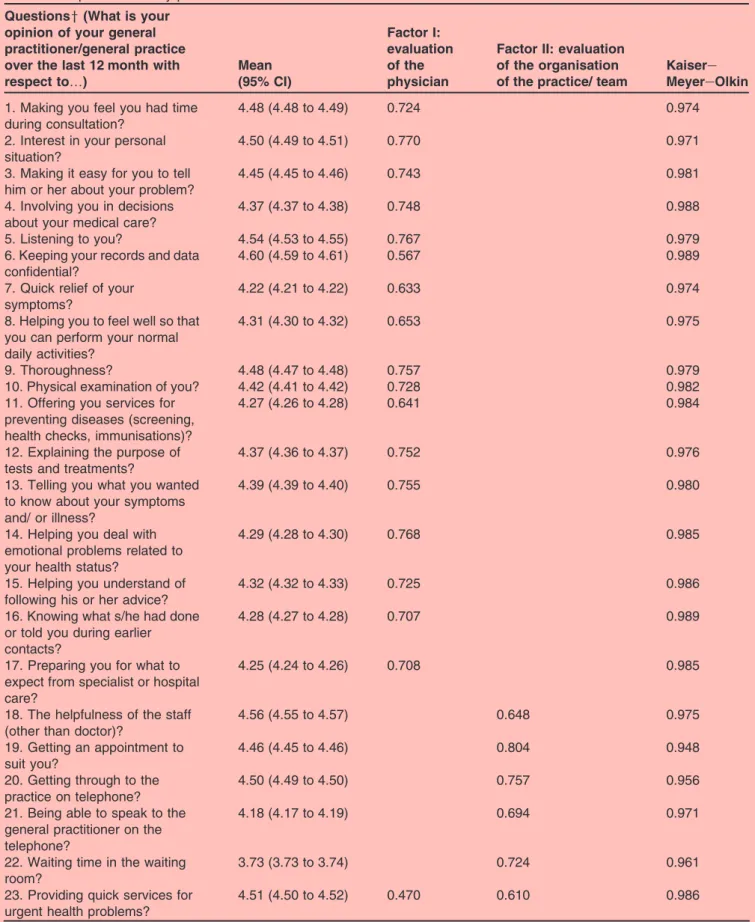
Table 1 Mean scores (95% CI) and rotated factor loading* with KaisereMeyereOlkin measure for each of the 23 items of the EUROPEP questionnaire by patients
Questionsy(What is your opinion of your general practitioner/general practice over the last 12 month with respect to.) Mean (95% CI) Factor I: evaluation of the physician
Factor II: evaluation of the organisation of the practice/ team
Kaisere MeyereOlkin 1. Making you feel you had time
during consultation?
4.48 (4.48 to 4.49) 0.724 0.974 2. Interest in your personal
situation?
4.50 (4.49 to 4.51) 0.770 0.971 3. Making it easy for you to tell
him or her about your problem?
4.45 (4.45 to 4.46) 0.743 0.981 4. Involving you in decisions
about your medical care?
4.37 (4.37 to 4.38) 0.748 0.988 5. Listening to you? 4.54 (4.53 to 4.55) 0.767 0.979 6. Keeping your records and data
confidential?
4.60 (4.59 to 4.61) 0.567 0.989 7. Quick relief of your
symptoms?
4.22 (4.21 to 4.22) 0.633 0.974 8. Helping you to feel well so that
you can perform your normal daily activities?
4.31 (4.30 to 4.32) 0.653 0.975
9. Thoroughness? 4.48 (4.47 to 4.48) 0.757 0.979 10. Physical examination of you? 4.42 (4.41 to 4.42) 0.728 0.982 11. Offering you services for
preventing diseases (screening, health checks, immunisations)?
4.27 (4.26 to 4.28) 0.641 0.984
12. Explaining the purpose of tests and treatments?
4.37 (4.36 to 4.37) 0.752 0.976 13. Telling you what you wanted
to know about your symptoms and/ or illness?
4.39 (4.39 to 4.40) 0.755 0.980
14. Helping you deal with emotional problems related to your health status?
4.29 (4.28 to 4.30) 0.768 0.985
15. Helping you understand of following his or her advice?
4.32 (4.32 to 4.33) 0.725 0.986 16. Knowing what s/he had done
or told you during earlier contacts?
4.28 (4.27 to 4.28) 0.707 0.989
17. Preparing you for what to expect from specialist or hospital care?
4.25 (4.24 to 4.26) 0.708 0.985
18. The helpfulness of the staff (other than doctor)?
4.56 (4.55 to 4.57) 0.648 0.975 19. Getting an appointment to
suit you?
4.46 (4.45 to 4.46) 0.804 0.948 20. Getting through to the
practice on telephone?
4.50 (4.49 to 4.50) 0.757 0.956 21. Being able to speak to the
general practitioner on the telephone?
4.18 (4.17 to 4.19) 0.694 0.971
22. Waiting time in the waiting room?
3.73 (3.73 to 3.74) 0.724 0.961 23. Providing quick services for
urgent health problems?
4.51 (4.50 to 4.52) 0.470 0.610 0.986 *Using a exploratory factor analysis; Extraction method: Principal axis factoring; Rotation method: Varimax with Kaiser normalisation; Rotation converged in three iterations. Only loadings greater than 0.4 are shown.
the physician’) (r¼0.259), factor II (‘evaluation of the organisation of the practice/team’) (r¼0.309) and factor III (‘intention not to change the practice’) (r¼0.151).
Influence of non-physicians’ and physicians’ satisfaction on patient satisfaction
The practice structure according to non-physicians was statistically significant in all three factors of patient satisfaction. The correlations ranged between r¼0.13 (p<0.001) and r¼0.29 (p<0.001). Non-physicians satis-faction with practice structure affects the patients perception of the physicians (factor I) (r¼0.241). Even ‘the intention to change the practice’ (factor III) correlates with the satisfaction of the non-physicians (r¼0.139).
The number of significant results between patient and physician satisfaction were lower. Only one correlation
between patients’ satisfaction and satisfaction of the physician colleagues was statistically significant (factor II, r¼0.17). No significant correlation was found between patients’ satisfaction and the job satisfaction of the practice principal.
Impact of workload on patients’ and non-physicians’ satisfaction
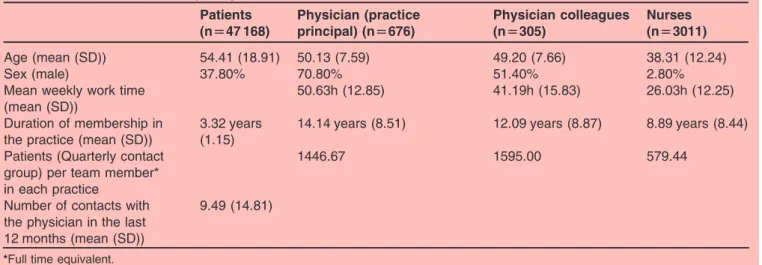
The relationship between patient satisfaction and the ratio of quarterly contact group/team members as an indicator for workload show ambiguous results: The ratio is not significantly correlated with patient satisfac-tion (r¼0.078 to 0.10). But the number of patients with at least one contact per quarter of a year (as a proxi for practice size and workload) on its own seems to affect the satisfaction of patients; factor II (‘evaluation of the organisation of the practice/team’) correlates with the number of patients (r¼0.358, p<0.001) and with Table 2 Characteristics of the participants
Patients (n[47 168) Physician (practice principal) (n[676) Physician colleagues (n[305) Nurses (n[3011) Age (mean (SD)) 54.41 (18.91) 50.13 (7.59) 49.20 (7.66) 38.31 (12.24) Sex (male) 37.80% 70.80% 51.40% 2.80% Mean weekly work time
(mean (SD))
50.63h (12.85) 41.19h (15.83) 26.03h (12.25) Duration of membership in
the practice (mean (SD))
3.32 years (1.15)
14.14 years (8.51) 12.09 years (8.87) 8.89 years (8.44) Patients (Quarterly contact
group) per team member* in each practice
1446.67 1595.00 579.44
Number of contacts with the physician in the last 12 months (mean (SD))
9.49 (14.81)
*Full time equivalent.
Table 3 Mean scores (95% CI) of practice staff for each of the 10 items on the WarreCookeWall job satisfaction scale* WCW items Physician (n[676) Physician colleagues (n[305) Non-physician staff (n[3011) p Valuey 1. Amount of variety in job 5.70 (5.60e5.79) 5.59 (5.46e5.73) 5.93 (5.89e5.97) <0.001{ 2. Opportunity to use abilities 5.36 (5.24e5.47) 5.52 (5.38e5.67) 5.82 (5.77e5.86) <0.001z 3. Freedom of working
method
5.67 (5.56e5.78) 5.70 (5.56e5.84) 5.82 (5.77e5.86) 0.012x 4. Amount of responsibility 5.62 (5.52e5.73) 5.74 (5.61e5.87) 5.92 (5.87e5.96) <0.001{ 5. Physical working condition 5.16 (5.04e5.27) 5.40 (5.26e5.55) 5.62 (5.57e5.67) <0.001z 6. Hours of work 4.38 (4.26e4.51) 4.82 (4.64e5.00) 5.73 (5.68e5.78) <0.001z 7. Income 4.36 (4.23e4.48) 4.66 (4.49e4.83) 4.77 (4.71e4.83) <0.001z 8. Recognition for work 5.57 (5.48e5.67) 5.57 (5.44e5.71) 5.42 (5.37e5.48) 0.015x 9. Colleagues and fellow
workers
5.98 (5.90e6.06) 5.97 (5.86e6.07) 6.17 (6.14e6.21) <0.001{ 10. Overall job satisfaction 5.55 (5.46e5.63) 5.58 (5.47e5.70) 5.94 (5.90e5.98) <0.001{ *Possible score for each item between 1 (extremely dissatisfied) and 7 (extremely satisfied).
yANOVA including post hoc False Discovery Rate.
Statistical significanceszbetween all three groups;xbetween physician and non-physician staff;{between physician/physician colleagues and non-physician staff.
the ratio of quarterly contact group/number of team members (r¼0.022). If we control the influence of the number of team members, we find other significant correlations: The number of team members correlates negatively with all factors of patient satisfaction (r¼0.116 to r¼0.399).
Even if we control the correlation between number of non-physicians and patient satisfaction, we find negative correlations in all three factors: The more team members there are, the lower the satisfaction, indepen-dent of the number of patients per staff member.
DISCUSSION
This is the first study which focuses on the correlation between patient satisfaction measured using EUROPEP and job satisfaction of physician and non-physician team members measured using the WCW job satisfaction scale.
Our first question referred to whether there is an association between non-physicians’ job satisfaction and patients’ satisfaction. The results show that patient satisfaction is highly associated with the satisfaction of the non-physicians. Comparing job satisfaction and
patient satisfaction shows that both measures assess similar aspects of the primary care practices. Remarkably, in the measurement of patient satisfaction, the variability of the patient data is sufficient to reveal positive corre-lations with the satisfaction of the non-physicians. The results are concordant with other studies which also have evaluated the influence of nurses’ satisfaction and working condition on patient satisfaction.6 18 Our second research question refers to the influence of non-physicians’ and physicians’ satisfaction on patient satisfaction. However, the correlation between the job satisfaction of the physician and patient satisfaction is lower and not significant. Interestingly, the job satisfac-tion of the non-physicians seems to be more associated with patient satisfaction than physician satisfaction. Healthcare services are mainly provided by physicians and they are able to set boundaries regarding to opportunities of patient care. Sometimes patients have a high claim to physicians care. Therefore, the correla-tion between non-physician team members’ satisfaccorrela-tion and patient satisfaction was significantly more positive than the job satisfaction of the physician. The third question examines whether there is an association between workload of the practice and patients’ and non-Table 4 Bivariate correlation of different aspects of satisfaction by three factors of patient satisfaction
Items for correlation
Patient satisfaction Evaluation of the physician
Evaluation of the
organisation of the practice/ team
Intention not to change the practice Job satisfaction of the
physician (practice principal)
r¼0.026 r¼0.018 r¼0.045 p¼0.497 p¼0.638 p¼0.249 Job satisfaction of the
physician (practice colleagues)
r¼0.046 r¼0.173 r¼0.001 p¼0.456 p¼0.004 p¼0.998 Job satisfaction of the
non-physicians
r¼0.259 r¼0.309 r¼0.151 p<0.001 p<0.001 p<0.001 Practice structure in the view
of the non-physicians
r¼0.242 r¼0.295 r¼0.139 p<0.001 p<0.001 p<0.001 Quarterly contact group r¼0.144 r¼0.358 r¼0.046
p<0.001 p<0.001 p¼0.244 Number of staff members r¼0.216 r¼0.399 r¼0.116
p<0.001 p<0.001 p<0.001 Ratio of quarterly contact
group/number of all staff members
r¼0.078 r¼0.022 r¼0.100 p¼0.05 p¼0.571 p¼0.011 Number of non-physicians r¼0.213 r¼0.377 r¼0.107
p<0.001 p<0.001 p¼0.005 Ratio of quarterly contact
group/number of non-physicians* r¼0.009 r¼0.039 r¼0.050 p¼0.831 p¼0.321 p¼0.201 Number of physicians r¼0.157 r¼0.321 r¼0.096 p<0.001 p<0.001 p¼0.013 Ratio of quarterly contact
group/number of physicians*
r¼0.005 r¼0.063 r¼0.040 p¼0.908 p¼0.107 p¼0.307 *Full time equivalent.
physicians’ satisfaction. Patients as well as non-physicians seem to be sensitive to practice characteristics, such as practice size.
Our data do not enable us to say what causes the significant correlation between non-physician job satis-faction and patient satissatis-faction. It is possible that dissatisfied patients can affect the satisfaction of non-physician members more than the satisfaction of the physician, or conversely a dissatisfied team could affect the satisfaction of the patients. In addition, both patient and non-physician member satisfaction could be influ-enced by common causes; for example, the number of patients visiting a practice affects both types of satisfac-tion: The more patients a practice has, the lower the satisfaction of the non-physician members and the lower the satisfaction of the patients. It seems that physician team members and patients prefer to work in practices with lower number of patients. This assumption is identical to Wensinget al.19Contrary to other results we did not find a correlation between workload and patient satisfaction.3 However, it was already shown that physi-cian’s workload depends closely on practice size.20 Surprisingly, in the literature, it could not be explored whether full-time physicians are more dissatisfied with their work than part time physicians.21Nevertheless, it might be possible that the more people work in the practice (full-time equivalent) the lower the satisfaction of the non-physician members and the lower the satisfaction of the patients. Further research should clarify this.
Obviously, the study had strengths and weaknesses. Our sample may not be representative for all primary care practices in Germany because we only involved practices which were willing to participate in the quality management system, which expects practices to partici-pate in benchmarking. A strong aspect was the avail-ability of large numbers of data on German primary care practices including data from patients and staff. We used internationally validated measures for the evaluation of job satisfaction by physicians and non-physicians and of patient satisfaction. In addition, this was an exploratory study; p values should be interpreted carefully. Signifi-cant results might be due to chance and will need to be confirmed in further targeted studies.
The results demonstrate that satisfaction of non-physicians has a larger impact on patients’ evaluation on quality of care more than the satisfaction of the physi-cians. The correlation between non-physician team member satisfaction and patient satisfaction was higher than the correlation between satisfaction of physicians and patients. This study provides research evidence to support health policy to optimise the working conditions of non-physicians and physicians which are a crucial aspect of patients’ evaluation on the quality of care.
AcknowledgementsThe authors would like to thank the participating practices and their staff for participating in the EPA quality management programme. The authors would also like to give thanks to M Brodowski, S Willms, M Lambarki, A Klingenberg and P Wippenbeck from the EPA management team at the AQUA-Institute.
FundingUniversity of Heidelberg.
Competing interestsBjoern Broge is employed by the AQUA-Institute which disseminates EPA in Germany. Joachim Szecsenyi is its director and a stockholder.
ContributorsJoachim Szecsenyi and Katja Goetz contributed equally to this work. All authors contributed in drafting and commenting on the manuscript. Provenance and peer reviewNot commissioned; externally peer reviewed.
REFERENCES
1. Herzberg F, Mausner B, Snyderman BB.The Motivation to Work. 2nd edn. New York: John Wiley & Sons, 1967.
2. Harris MF, Proudfoot JG, Jayasinghe UW,et al. Job satisfaction of staff and the team environment in Australian general practice.Med J Aust2007;186:570e3.
3. Dowd BE, Kralewski JE, Kaissu AA,et al. Is patient satisfaction influenced by the intensity of medical resource use by their physicians?Am J Manag Care2009;15:e16e21.
4. Allan J, Schattner P, Stocks N,et al. Does patient satisfaction of general practice chance over a decade?BMC Fam Pract2009;10:13. 5. Grol R, Mokkink H, Smits A,et al. Work satisfaction of general
practitioners and the quality of patient care.Fam Pract
1985;2:128e35.
6. Vahey DC, Aiken LH, Sloane DM,et al. Nurse burnout and patient satisfaction.Med Care2004;42:57e66.
7. Laurant MG, Hermens RP, Braspenning JC,et al. An overview of patients’ preferences for, and satisfaction with, care provided by general practitioners and nurse practitioners.J Clin Nurs
2008;17:2690e8.
8. Linzer M, Baier Manwell L, Williams ES,et al. Working conditions in primary care: physician reactions and care quality.Ann Int Med
2009;151:28e36.
9. Van den Hombergh P, Kunzi B, Elwyn G,et al. High workload and job stress are associated with lower practice performance in general practice: an observational study in 239 general practices in the Netherlands.BMC Health Serv Res2009;9:118.
10. Engels Y, Dautzenberg M, Campbell S,et al. Testing a European set of indicators for the evaluation of the management of primary care practices.Fam Pract2006;23:137e47.
11. Grol R, Dautzenberg M, Campbell S, eds.Quality Management in Primary Care. European Practice Assessment. Guetersloh: Verlag Bertelsmann Stiftung, 2005.
12. Engels Y, Dautzenberg M, Campbell S,et al. The EPA pilot: practice management in nine countries. In: Grol R, Dautzenberg M, Brinkmann H, eds.Quality Management in Primary Care. Guetersloh: Verlag Bertelsmann Stiftung, 2004:77e92.
13. Grol R, Wensing M.Patients Evaluate General/Family Practice: The EUROPEP Instrument. Nijmegen: World Organisation of Family Doctors (WONCA)/European Association for Quality in Family Practice, 2000.
Box 1 Characteristics of the practices (n¼676)
Characteristics
- Mode of practice: Single handed: 47.1% - Location: Urban: 47.3%
- Practice size (mean (SD)) in m2: 149.07 (61.03)
- Number of team members (without physicians) (mean (SD)): 4.41 (2.03)
- Full Time Equivalent (Staff without physicians) (mean (SD)): 2.71 (1.44)
- Number of physicians per practice (mean (SD)): 1.52 (0.75)
- Quarterly contact group (mean (SD)): 1446.67 (649.81) - Percentage of patients with disease of longer than
14. Warr PJ, Cook J, Wall T. Scales for the measurement of some work attitudes and aspects of psychological well-being.J Occup Psychol
1979;52:129e48.
15. Szecsenyi J, Engelhardt N, Wessel M,et al. [A method for determining the denominator in general practiceeresults of a pilot
study] (In German).Gesundheitswesen1993;55(1 Suppl):32e6.
16. Victor A, Elsa¨ßer A, Hommel G,et al. [Judging a plethora of p-values: how to contend with the problem of multiple testing] (In German).
Deutsches Aerzteblatt2010;107:50e6.
17. Benjamini Y, Hochberg Y. Controlling the false discovery rate: a practical and powerful approach to multiple testing.J R Stat Soc
1995;57:298e300.
18. Stone PW, Mooney-Kane C, Larson EL,et al. Nurse working conditions and patient safety outcomes.Med Care
2007;45:571e8.
19. Wensing M, Hermsen J, Grol R,et al. Patient evaluations of accessibility and co-ordination in general practice in Europe.Health Expect2008;11:384e90.
20. Wensing M, van den Hombergh P, Akkermans R,et al. Physician workload in primary care: what is the optimal size of practices? A cross-sectional study.Health Policy2006;77:260e7.
21. Murray A, Gelb Safran D, Rogers WH,et al. Part-time physicians. Physician workload and patient-based assessments of primary care performance.Arch Fam Med2000;9:327e32.