This report was prepared by Snehal N. Shah, MD, MPH; Dan Dooley; Phyllis D. Sims, MS., Helen Ayanian, BA; Neelesh Batra, MPH; Monique J. Brown, MPH; Rashida Taher, MPH. The cover was designed by Lisa Costanzo, BFA.
Copyright Information All material contained in this report is in the
public domain and may be used and reprinted without special permission; however, citation as to the source is appropriate. Suggested Citation
Substance Abuse in Boston 2011
Boston Public Health Commission Research and Evaluation Office Boston, Massachusetts 2011
Introduction
According to the 2009 National Survey on Drug Use and Health, approximately 21.8 million Americans ages 12 and over reported being illicit drug users. Illicit drugs include drugs such as heroin, cocaine (including crack), marijuana, hallucinogens, inhalants, prescription-drugs used for nonmedical reasons and abuse of common over-the-counter medications such as cough syrup. An additional 130 million also reported being current drinkers of alcohol (1).
Substance abuse encompasses all races/ethnicities, males and females, age groups from youth to seniors, high school and college students, employed and unemployed adults, individuals with and without an education, and other characteristics (1).
Marijuana is the most abused illicit drug in the U. S. with 14.6 million drug users. On a regular basis, 2.4 million Americans use cocaine and 13 million Americans are reported to have an alcohol drinking problem (1).
Prescription drug abuse is now considered to be the fastest growing substance abuse problem in the US with approximately 5.3 million Americans using prescription pain medication for
nonmedical reasons (2).
The health consequences of substance abuse are many and can include: Cancer Cardiovascular disease Dementia Hepatitis B and C
HIV/AIDS
Liver diseases Lung disease Mental disordersMiscarriage and stillbirth among pregnant women, and birth defects among children Psychiatric disorders such as depression, anxiety, and suicide
Risky sexual behaviors such as unprotected sex resulting in sexually transmitted infections (STIs)
Stroke
Unintentional injuries Violence
Premature death
In 2007, among individuals with a substance abuse problem, 1.7 million received treatment in an outpatient rehabilitation facility, 1.0 million in an inpatient rehabilitation facility, 889,000 in an outpatient mental health center, 779,000 as an inpatient in a hospital, 593,000 in a private doctor‟s office, 523,000 in a hospital emergency room, and 302,000 in a prison or jail (3). Preventing and treating substance abuse conditions can be challenging for a number of reasons. Some of these reasons include the difficulty of diagnosing and treating individuals who have both drug and alcohol abuse problems concurrently, providers who may not be aware of the signs and symptoms of substance abuse, especially in patients who may not appear to be „typical substance
iv
In addition to personal health consequences, the effect of substance abuse also results in negative outcomes for both individuals and society. For example, the total overall costs of substance abuse in the US, including loss productivity as well as costs related to health and crime, has been estimated to exceed $416 billion a year for illicit drugs and alcohol (5). Many lives are also lost every year. According to national preliminary death data for 2009, 76,855 people in the US died from alcohol, alcohol liver disease, and drugs in 2009 (6). However, numbers do not adequately describe the far reaching or full range of destructive outcomes of substance abuse, such as family dysfunction, job loss, failure in school, domestic violence, and child abuse.
This report provides data on the experience of Boston‟s youth and adults who use and abuse drugs and alcohol, the extent to which they use those substances, the specific types of drugs commonly used, behavioral patterns, and utilization of treatment facilities. It is an effort to better understand the substance abuse experience of the Boston population so that more effective monitoring and development of targeted responses can be identified and
implemented with the overall goal of reducing substance abuse among Boston residents. Caution is advised when attempting to generalize across data sources. There are many systemic factors specific to each data source that do not directly relate to the level of abuse in the larger population, but may contribute to changes seen in the data. For example, changes in treatment admissions numbers could reflect changes in demand for treatment or could reflect changes in the treatment system‟s capacity to admit certain types of clients. To what extent systemic factors influence totals and subpopulation differences observed within a data source is difficult to determine and often unknown. Conclusions drawn from the data sources are subject to such limitations. At best, the data presented here offer a partial picture of Boston‟s collective drug abuse experience.
1. Substance Abuse and Mental Health Services Administration. (2010). Results from the 2009 National Survey on Drug Use and Health: Volume I. Summary of National Findings (Office of Applied Studies, NSDUH Series H-38A, HHS Publication No. SMA 10-4586Findings). Rockville, MD.
2. National Prevention Council, National Prevention strategy, Washington, DC: US Department of Health and Human Services, Office of the Surgeon General, 2011.
3. Briefing on Substance Use, Treatment, and Recovery in the United States.
http://www.pfr.samhsa.gov/docs/Briefing_Substance_Use_Treatment.pdf Accessed June 1, 2011.
4. US Department of Health and Human Services, National Institute of Health, National Institute on Alcohol Abuse. Alcohol Alert. Number 76, July 2008, pp1-5.
5. NIDA InfoFacts.: Understanding Drug Abuse and Addiction.
http://www.drugabuse.gov/Infofacts/understand.html Accessed June 1, 2011. 6. National Vital Statistics Report. Deaths: Preliminary Data for 2009.
vi
In Boston, Mayor Thomas M. Menino and the Boston Public Health Commission have made the reduction of substance abuse a public health priority. Monitoring substance abuse patterns and abuse-related outcomes is essential to measuring the progress of the public health response to this priority.
Substance Abuse in Boston 2011 provides a broad picture of alcohol and drug misuse and abuse among Boston residents. The report focuses on data from select sources including surveys, substance abuse mortality, hospital admissions, emergency department visits, and treatment admissions in an effort to describe patterns and trends of specific substance abuse-related health experiences among Boston residents.
The most recent survey data show Boston‟s youth compare favorably to youth in Massachusetts and the United States overall when assessing patterns of alcohol and drug use. Even though similar percentages of students reported being offered, sold or given drugs on school property in 2009:
Compared to students across Massachusetts, Boston public high school students were less likely to report drinking alcohol during the past month and using marijuana during the past month.
Compared to students across the US, Boston high school students were less likely to report using cocaine during the past month, ever having used methamphetamine, and ever having used inhalants (e.g., glue, contents of an aerosol can) to get high. Compared to students across the US and Massachusetts, Boston high school students were less likely to report binge drinking (having five or more alcoholic drinks in a row within a couple of hours) during the past month, ever having used cocaine, and ever having used ecstasy.
Among Boston high school students, the percentage reporting ever having used ecstasy decreased from 7% in 2001 to 3% by 2009. Additionally, the percentage reporting ever having used other hard drugs has remained relatively low over time, between 2% and 3% for heroin, cocaine, and methamphetamine.
Among Boston residents of all ages, the most recent mortality data reveal progress and sustained improvement:
After increasing 67% from 2000 to 2007, the age-adjusted substance abuse mortality rate decreased 19% from 2007 to 2008.
Both the alcohol abuse and drug abuse mortality rates peaked in 2006 then decreased from 2006 to 2008, 31% and 46% respectively.
After peaking in 2006 and 2007, the heroin/opioid mortality rate decreased 32% from 2007 to 2008.
The cocaine mortality rate decreased 34% from 2006 to 2008.
Similarly, the most recent hospital admissions data reveal progress and sustained improvement: After increasing 12% from 2002 to 2007, the age-adjusted substance abuse
After peaking in 2007, the cocaine hospital admissions rate decreased 30% from 2007 to 2009.
However, hospital emergency department visit data suggest additional need for improvement: The substance abuse emergency department visit rate (not including ED visits that resulted in hospital admissions) increased 30% from 2002 to 2009.
Both the alcohol abuse and drug abuse emergency department visit rates increased during this period.
Boston Emergency Medical Services (BEMS) will often administer naloxone (Narcan®) in an effort to reverse the effects of an opioid overdose (e.g., restart breathing). BEMS data reveal success in saving lives of individuals who overdosed on opioids:
In 2009, 96% of BEMS Narcan® administrations led to successful overdose reversals, saving as many as 361 lives.
In 2010, 85% of Narcan® administrations led to successful reversals, saving as many as 188 lives.
In addition to BEMS administration, an innovative public health prevention strategy has opioid treatment providers now training opioid users, their families and friends on how to recognize an opioid overdose, perform rescue breathing and administer nasal naloxone.
Patterns and trends within the substance abuse treatment admissions data could reflect changes in demand (i.e., the number of residents seeking treatment), changes in treatment capacity (i.e., the availability of treatment slots or beds for potential clients) and/or changes in other treatment access factors (e.g., affordability). Together, these types of factors limit the ability to draw
conclusions from observed treatment admissions rate changes. For this reason, the following treatment data summary is presented without assignment of progress.
Though the overall treatment admission rate has been relatively stable for seven years (2003 to 2010), rates for Black residents and Latino residents decreased 45% and 36%, respectively, during the past decade. As a result, treatment rates were similar among Black, Latino and White
residents by 2010.
For this report, drug-specific treatment data were compiled by totaling the number of client admissions citing a given drug as either the client‟s primary, secondary or tertiary drug of abuse. During the past decade, heroin and alcohol were most often cited as drugs of abuse among Boston treatment client admissions. Among client admissions in 2010, 56% cited heroin, 50% cited alcohol, 29% cited cocaine (including crack), 14% cited marijuana, 11% cited benzodiazepines and 10% cited other (non-heroin) opioids as drugs of abuse. Other drugs (e.g., methamphetamine, club drugs) were each cited by less than 1% of all treatment client admissions.
From 2001 to 2010, the overall heroin treatment admissions rate has been fairly stable while the alcohol treatment admissions rate decreased 34%, the cocaine treatment admissions rate
decreased 31%, the marijuana treatment rate decreased 40%, the benzodiazepines admissions rate increased 83%, and the other (non-heroin) opioid treatment admissions rate increased 58%.
The entire Substance Abuse in Boston 2011 can be found on the Boston Public Health Commission‟s website at www.bphc.org.
viii
In our society substances including drugs and alcohol are used both medically and recreationally. Drug misuse occurs when illegal drugs are used or legal drugs are used in a non-medically
prescribed manner. The point at which drug misuse is considered drug abuse is rather subjective. For purposes of this report, all misuse is considered abuse. Since alcohol is legal and used
recreationally, alcohol misuse or abuse was determined on a data source basis. For hospital
emergency department data, hospital admissions data, and mortality data, drug and alcohol abuse was determined by the presence of relevant ICD-9-CM codes (hospital ED visits or hospital
admissions) or ICD-10 codes (mortality) identified among multiple levels of diagnosis/cause codes in the electronic case records in the relevant electronic database. Often, these codes do not identify intent of drug/alcohol use and stringent determination of whether the substance was misused or abused is not possible. No further review of case records was conducted to determine causality. For this report, drug and alcohol abuse data definitions include codes beyond poisonings (e.g., codes referring to mental and behavioral disorders due to substance use). As a result, drug and alcohol poisonings/overdoses are subsets (not reported in this report) of drug and alcohol abuse definitions used. In addition, ICD codes (i.e., hospital diagnostic codes and cause of death codes) often lack specificity in identifying certain drugs. As a result, drug categories (e.g., heroin/opioids) were used in certain instances to help produce reliable statistics. For a listing of codes used to identify drug and alcohol abuse, please refer to the glossary.
How do we determine if one percentage (point estimate) is higher or lower than another? To determine whether two percentages, or point estimates, are different from one another, one cannot look only at the percentages themselves. One must determine whether the differences between two percentages are “statistically significant.” Statistical significance is a mathematical term used to describe the likelihood that a particular number or rate reflects reality. This term comes into play when researchers measure a particular characteristic of a sample or subset of a group or population, and then use that result to describe the entire group or population.
In this report, one of the data sources cited is a survey called the Boston Behavioral Risk Factor Surveillance Survey (BBRFSS). This is a telephone-based survey in which a number of Boston residents were asked to respond to a series of questions. The entire population of Boston was not called to participate in this survey, as this would not have been feasible or cost-effective. The survey data were collected among a random sample of adults within a random sample of Boston households. The resulting data were used to represent the entire adult population for the city of Boston and are described as percentages or point estimates. These numeric values are further described by a numeric range called a confidence interval. The confidence interval describes the likelihood that the true percentage falls within the range of values given, and thus describes the error around the percentage estimate. To compare two percentage estimates and determine whether one is higher or lower than the other, one must look at both the percentage estimates and their associated confidence intervals.
For example, in the Overall Drug and Alcohol section of this report, there is a measure of self-reported heavy alcohol consumption by Boston neighborhood from the BBRFSS (Figure 2.66 ). The percentage of Boston residents overall reporting heavy alcohol consumption was 8%, while for Charlestown the percentage was 10%. The confidence interval for Boston was 6.3%-10.3%; for Charlestown, the confidence interval was 1.5%-19.2%. Although the percentage estimates are numerically different (Boston 8%, Charlestown 10%), the overlapping confidence intervals indicate that these percentages are statistically similar.
Survey (YRBS), and Boston Youth Survey (BYS). To determine whether a percentage was higher or lower than another percentage, the confidence intervals were calculated and compared. If the confidence intervals did not overlap, the two percentage estimates were reported as different (one was “higher” or “lower” than the other). If the confidence intervals overlapped, the percentage estimates were reported as similar to one another and no further comparison was made. What do the terms “insufficient sample size” and “n<5” mean?
In the section notes, the phrase insufficient sample size is used to describe data points that are not presented. This occurs when the stratification of survey data by population groups results in a sample that is too low to calculate reliable point estimates. In addition, to protect the
confidentiality of respondents, data are not presented when a sample size is too small.
The notation, n<5, is used when there are fewer than five occurrences of an event (for example, births, deaths, new cases of a disease) and thus a rate could not be presented. In some instances, combining several years of data increased sample size to a level that allowed data to be reported. Why do we sometimes combine several years of data?
In certain instances, when there were fewer than five cases or an insufficient sample size in a given year, we combined data from two or more years in order to permit the calculation and
presentation of a rate or point estimate. In this report, the title of a chart indicates whether two or more years of data have been combined.
How do we define neighborhood boundaries in this report?
Neighborhoods can be defined in a number of ways. In this report, zip codes and census tracts are used to identify neighborhood boundaries since this information is often collected with Boston health data. Most graphs presenting neighborhood data use neighborhood definitions based on zip codes, but graphs presenting death data rely on census tracts to define neighborhoods.
Why are some of the data older than other data?
The most recent data available are used in this report. Some data are older than other data. The availability of data varies by source. Several factors play a role in determining when data are available including the frequency of data collection, the post-collection cleaning and verification process, and resources available to manage and analyze the data.
Table of Contents
Acknowledgements ... i
Introduction ... iii
Executive Summary ... viii
Note to Readers ... ix
Section 1: Youth Drug and Alcohol Use ... 1
Marijuana ... 3
Other Drugs (non Marijuana) ... 7
Heroin ... 8
Cocaine ... 10
Methamphetamine ... 12
MDMA (Ecstasy) ... 14
Alcohol ... 16
Overall Youth Drug and Alcohol Abuse ... 19
Section 2: Overall Drug and Alcohol Abuse ... 22
Section 3: Heroin/Opioids ... 29
Section 4: Cocaine ... 46
Section 5: Marijuana ... 54
Section 6: Other Drugs ... 57
Section 7: Infectious Diseases Related Drug Use ... 60
Section 8: Alcohol ... 65
Notes and Data Analysis ... 79
Technical Notes ... 87
Data Sources and Limitations ... 90
Glossary... 94
Youth Drug and Alcohol Use
According to the most recent annual report by the Substance Abuse and Mental Health Services Administration (SAMSHA), in 2009, 10% of youth in the US ages 12 to 17 were reported to be illicit drug users. Marijuana was the most commonly used illicit drug among this age group, followed by illegal use of prescription drugs (1). Rates of marijuana use by youth are increasing and fewer youth think there is great risk from smoking marijuana on a weekly basis (1).
Marijuana continues to be a major focus of substance abuse prevention among youth because it is considered a "gateway drug", that is a drug that introduces youth to drug intoxication and influences them to try one of the more highly addictive drugs such as heroin or crack cocaine (2).
More youth are also using prescription drugs to get high because they mistakenly view them as safer than illegal drugs. In the US, youth ages 12 to 17 have the second highest annual rate of prescription drug abuse, and young adults, ages 18 to 25, have the highest (3). In 2007, one of every nine young persons in the US was provided with prescriptions for some of the same types of medication such as pain killers, sedatives, and stimulants like Ritalin that are being abused (4).
Alcohol remains the most widely used drug among youth in the US. According to the 2009 National Survey on Drug Use and Health, 4.6% of youth ages 12 to 17 met the criteria for alcohol dependence or alcohol abuse in 2009. (1) Although youth, like adults, abuse alcohol, their drinking behavior is different than that of adults. Youth are more likely to abuse alcohol by binge
drinking (i.e., drinking five or more alcoholic drinks in one sitting) (5). While
approximately 50% of the alcohol consumed by adults occurs while binge drinking, 90% of the alcohol consumed by youth occurs while binge drinking (6).
The immediate effects of alcohol
misuse/abuse due to binge drinking include:
Unintentional injuries, especially injuries emanating from motor vehicle accidents. Drinking while driving is a large problem among youth and the cause of serious and potentially life threatening problems for adolescents and young adults. During 2002-2004, there was an average of 230,000 alcohol-related ED visits among underage youth (7).
Violence, including intimate partner violence and sexual assault.
Risky sexual behaviors, especially unprotected sex. Such behaviors can result in unintended pregnancy and sexually transmitted diseases.
Alcohol poisoning, which is the result of high blood alcohol levels and can cause, among other conditions, unconsciousness, coma, or death. The Youth Drug and Alcohol Use section that follows provides a snapshot of illicit drug use and drinking behaviors among Boston public high school students. Patterns of treatment in hospital emergency rooms and in hospitals as an inpatient are also included. Data are provided by age, gender, race/ethnicity, and other demographics, where possible, to
further provide an understanding of drug and alcohol use among Boston youth.
2
* Includes Beacon Hill, Downtown, North End, and West End † North and South Dorchester combined
DATA SOURCE: Boston Youth Survey, 2008; Harvard Youth Violence Prevention Center through a Cooperative agreement with the Center for Disease Control and Prevention
30% 28% 6% 26% 46% 32% 32% 15% 35% 29%36% 24% 44% 39% 29% 4% 0% 20% 40% 60% P e rc e n t o f B o s to n P u b lic H igh S c h o o l S ru d e n ts
Figure 1.1 Perception of Drug Use Being a
Problem Among Youths by Neighborhood, 2008
Close to one in three Boston high school students reported that drug use was a problem within their neighborhood.
DATA SOURCE: Youth Risk Behavior Survey 1999, 2001, 2003, 2005, 2007, 2009, Youth Risk Behavioral Surveillance System (YRBSS), Centers for Disease Control and Prevention (CDC)
20% 22% 20% 21% 17% 22% 0% 10% 20% 30% 1999 2001 2003 2005 2007 2009 P erc en t o f B os ton P ub lic Hi gh S c ho ol S tud ne ts
Figure 1.3 Past Month Marijuana Use, 1999, 2001,
2003, 2005, 2007 and 2009
DATA SOURCE: Youth Risk Behavior Survey 1999, 2001, 2003, 2005, 2007, 2009, Youth Risk Behavioral Surveillance System (YRBSS), Centers for Disease Control and Prevention (CDC)
38% 40% 37% 39% 34% 38% 0% 20% 40% 60% 1999 2001 2003 2005 2007 2009 P erc en t o f B os ton P ub lic Hi gh S c ho ol S tud en ts
Figure 1.2 Lifetime Marijuana Use, 1999, 2001,
2003, 2005, 2007 and 2009
The level of Boston public high school students who reported ever having used marijuana remained relatively consistent across all data years shown with more than one in three students reporting use during their lifetime. There were no significant differences in reported lifetime marijuana use across years.
Recent marijuana use remained relatively consistent across all years shown with about one in five Boston public high school students reporting past month use. There were no
In 2009, 22% of Boston public high school students reported using marijuana in the past month. The percentage of male students who reported using marijuana in the past month was statistically similar to that of female students. Across age groups, the percentage of students who reported using marijuana in the past month was statistically similar.
A lower percentage of Asian
students reported using marijuana in the past month compared to Black and White students. A higher percentage of students receiving mostly D‟s and F‟s in school reported past month marijuana use compared to students receiving mostly A‟s, B‟s and C‟s
A lower percentage of students who have not always lived in the US used marijuana in the past month compared to students who have always lived in the US. 13% 24% 43% 18% 22% 18% 25% 10% 29% 22% 17% 25% 19% 22% 0% 20% 40% 60%
Not always lived in US Always lived in US D's and F's A's B's and C's White Latino Black Asian 18 or older 16 or 17 15 or younger Male Female BOSTON
Percent of Boston Public High School Students
Figure 1.4 Past Month Marijuana Use
by Selected Indicators, 2009
DATA SOURCE: Youth Risk Behavior Survey 2009, Youth Risk Behavioral Surveillance System (YRBSS), Centers for Disease Control and Prevention (CDC)
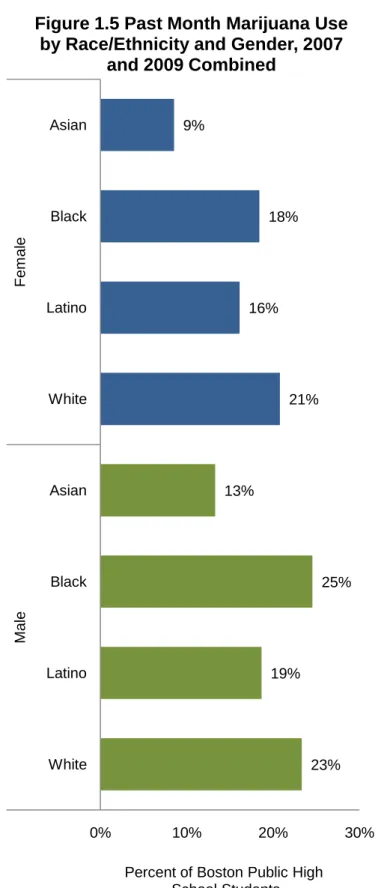
A lower percentage of Asian female high school students reported using marijuana in the past month compared to Black and White female high school students. A lower percentage of male Asian high school students reported using marijuana in the past month compared to Black male high school students. There were no other gender-specific significant differences in past month marijuana use among the remaining groups of students.
DATA SOURCE: Youth Risk Behavior Survey 2007 and 2009, Youth Risk Behavioral Surveillance System (YRBSS), Centers for Disease Control and Prevention (CDC) 23% 19% 25% 13% 21% 16% 18% 9% 0% 10% 20% 30% White Latino Black Asian White Latino Black Asian Ma le F em al e
Percent of Boston Public High School Students
Figure 1.5 Past Month Marijuana Use
by Race/Ethnicity and Gender, 2007
DATA SOURCE: Youth Risk Behavior Survey 2009, Youth Risk Behavioral Surveillance System (YRBSS), Centers for Disease Control and Prevention (CDC)
37% 27% 18% 26% 3% 9% 4% 28% 0% 10% 20% 30% 40% Smoked cigarettes during Past 30 Days Received D's & F's in the Past Year Carried Weapon at School during Past 30 Days
Did not Use Condom at Last Sex Pe rc e n t o f Bo s to n Pu b lic Hig h Sc h o o l Stu d e n ts Marijuana Use, 2009
Marijuana User Non-Marijuana User
Many health risk behaviors are associated with marijuana use. Compared to students who didn‟t use marijuana, higher percentages of past month marijuana users also reported smoking cigarettes during the past month, receiving mostly D‟s and F‟s during the past year and carrying a weapon on school property during the past month. There was no significant difference in reported condom use during last sexual intercourse among sexually active marijuana users and non-marijuana users.
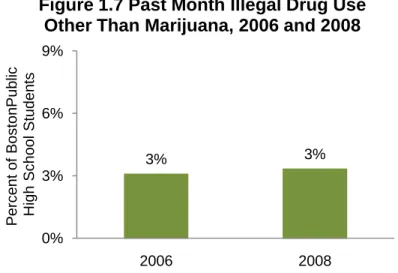
3% 3% 0% 3% 6% 9% 2006 2008 P erc en t o f B os ton P ub lic Hi gh S c ho ol S tud en ts
Figure 1.7 Past Month Illegal Drug Use
Other Than Marijuana, 2006 and 2008
DATA SOURCE: Boston Youth Survey, 2006 and 2008; Harvard Youth Violence Prevention Center through a Cooperative agreement with the Center for Disease Control and Prevention
In both 2006 and 2008, only 3% of Boston public high school students reported past month other illegal drug use (excluding marijuana).
* Insufficient sample size for users
DATA SOURCE: Youth Risk Behavior Survey 2009, Youth Risk Behavioral Surveillance System (YRBS), Centers for Disease Control and Prevention (CDC)
with edges of above chart. Text box size: 0.5”h x 5” w. Internal margins of box set to 0”.
1% 1% 2% 2% 3% 2% 0% 1% 2% 3% 4% P e rc e n t o f B o s to n P u b lic Hi gh S c ho ol S tud ne ts
Figure 1.9 Lifetime Heroin Use,
1999, 2001, 2003, 2005, 2007, 2009
DATA SOURCE: Youth Risk Behavior Survey 1999, 2001, 2003, 2005, 2007, 2009, Youth Risk Behavioral Surveillance System (YRBSS), Centers for Disease Control and Prevention (CDC)
32% 28% 16% * 8% 12% 6% 26% 0% 10% 20% 30% 40% Smoked cigarettes during Past 30 Days Received Ds & Fs in the Past Year Carried Weapon at School during Past 30 Days
Did not Use Condom at Last Sex Pe rc e n t o f Bo s to n Pu b lic Hig h Sc h o o l Stu d e n ts
Use Other than Marijuana, 2009
User Non-User
In 2009, 10% of Boston public high school students reported having used illegal drugs other than marijuana during their lifetime (data not shown). A higher percentage of students who had used illegal drugs other than marijuana also reported smoking cigarettes during the past month and receiving poor grades in comparison to students who hadn‟t used other drugs. The percentage of students who reported carrying a weapon at school during the past month was statistically similar between those who had used other illegal drugs and those who hadn‟t.
Between 1% and 3% of Boston public high school students reported ever using heroin. The percentage reporting heroin use was statistically similar across the years shown.
During the combined years of 2003, 2005, 2007, and 2009, 2% of Boston public high school students reported ever having used heroin. A higher percentage of students who received mostly D‟s and F‟s reported having used heroin
compared to students who received mostly A‟s, B‟s and C‟s.
There were no significant
differences in reported heroin use by gender, race/ethnicity, age, or years living in the US.
DATA SOURCE: Youth Risk Behavior Survey 2003, 2005, 2007, 2009, Youth Risk Behavioral Surveillance System (YRBSS), Centers for Disease Control and Prevention (CDC) 2% 3% 6% 1% 2% 2% 2% 2% 2% 2% 2% 3% 2% 2% 0% 2% 4% 6% 8% Always lived in the US Not always lived
in the US D's and F's A's B's and C's White Latino Black Asian 18 or older 16 or 17 15 or younger Male Female BOSTON
Percent of Boston Public High School Students
Figure 1.10 Lifetime Heroin Use by
Selected Indicators, 2003, 2005, 2007
DATA SOURCE: Youth Risk Behavior Survey 1999, 2001, 2003, 2005, 2007, 2009, Youth Risk Behavioral Surveillance System (YRBSS), Centers for Disease Control and Prevention (CDC)
4% 4% 3% 3% 4% 3% 0% 1% 2% 3% 4% 1999 2001 2003 2005 2007 2009 P erc en t o f B os ton P ub lic Hi gh S c ho ol S tud en ts
1999, 2001, 2003, 2005, 2007 and 2009
Lifetime cocaine use remained consistent across all years with 3% to 4% of Boston public high school students reporting use. There were no significant differences in reported lifetime cocaine use across years.
During the combined years of 2003, 2005, 2007, and 2009, 3% of Boston public high school students reported ever having used cocaine. A higher percentage of students who received mostly D‟s and F‟s in school reported having used cocaine compared to students who received mostly A‟s, B‟s, and C‟s. There were no significant
differences in reported lifetime cocaine use by gender, age,
race/ethnicity, and years living in the US.
DATA SOURCE: Youth Risk Behavior Survey 2003, 2005, 2007, 2009, Youth Risk Behavioral Surveillance System (YRBSS), Centers for Disease Control and Prevention (CDC) 3% 4% 7% 2% 5% 3% 3% 3% 5% 3% 3% 4% 2% 3% 0% 2% 4% 6% 8% Always lived in the US Not always lived
in the US D's and F's A's B's and C's White Latino Black Asian 18 or older 16 or 17 15 or younger Male Female BOSTON
Percent of Boston Public High School Students
Figure 1.12 Lifetime Cocaine Use by
Selected Indicators, 2003, 2005, 2007
DATA SOURCE: Youth Risk Behavior Survey 1999, 2001, 2003, 2005, 2007, 2009, Youth Risk Behavioral Surveillance System (YRBSS), Centers for Disease Control and Prevention (CDC)
3% 3% 4% 2% 3% 2% 0% 1% 2% 3% 4% P erc en t o f B os ton P ub lic Hi gh S c ho ol S tud en ts
Figure 1.13 Lifetime Methamphetamine Use,
1999, 2001, 2003, 2005, 2007, and 2009
Lifetime methamphetamine use remained fairly consistent across all data years with 2% to 4% of Boston public high school students reporting ever having used. There were no
During the combined years of 2003, 2005, 2007, and 2009, 3% of Boston public high school students reported ever having used
methamphetamine.
A higher percentage of students who received mostly D‟s and F‟s in school used methamphetamine compared to students who received mostly A‟s, B‟s, and C‟s.
There were no significant differences in reported lifetime methamphetamine use by gender, age, race/ethnicity, and years living in the US.
2% 3% 6% 2% 4% 2% 2% 3% 4% 2% 3% 4% 2% 3% 0% 2% 4% 6% 8% Always lived in the US Not always lived
in the US D's and F's A's B's and C's White Latino Black Asian 18 or older 16 or 17 15 or younger Male Female BOSTON
Percent of Boston Public High School Students
Figure 1.14 Lifetime Methamphetamine
Use by Selected Indicators, 2003, 2005,
2007 and 2009 Combined
DATA SOURCE: Youth Risk Behavior Survey 2003, 2005, 2007, 2009, Youth Risk Behavioral Surveillance System (YRBSS), Centers for Disease Control and Prevention (CDC)
DATA SOURCE: Youth Risk Behavior Survey 2001, 2003, 2005, 2007, 2009, Youth Risk Behavioral Surveillance System (YRBSS), Centers for Disease Control and Prevention (CDC)
7% 6% 4% 4% 3% 0% 2% 4% 6% 8% 2001 2003 2005 2007 2009 P erc en t o f B os ton P ub lic Hi gh S c ho ol S tud en ts
Figure 1.15 Lifetime MDMA (Ecstasy) Use,
2001, 2003, 2005, 2007 and 2009
The percentage of Boston high school students who reported ever having used ecstasy decreased significantly from 7% in 2001 to 3% in 2009.
During the combined years of 2003, 2005, 2007, and 2009, 4% of Boston public high school students reported ever having used MDMA (ecstasy).
A higher percentage of students ages 18 years or older reported having used ecstasy compared to students ages 15 years or younger. Also, a higher percentage of
students who received mostly D‟s and F‟s in the past year reported having used ecstasy compared to students who received mostly A‟s, B‟s, and C‟s.
A lower percentage of Latino students have used ecstasy compared to Asian and White students.
There were no significant differences in reported lifetime ecstasy use by gender and years living in the US.
4% 4% 7% 3% 7% 3% 4% 6% 6% 4% 3% 5% 4% 4% 0% 2% 4% 6% 8% Always lived in the US Not always lived
in the US D's and F's A's B's and C's White Latino Black Asian 18 or older 16 or 17 15 or younger Male Female BOSTON
Percent of Boston Public High School Students
Figure 1.16 Lifetime MDMA (Ecstasy)
Use by Selected Indicators, 2003, 2005,
2007 and 2009 Combined
DATA SOURCE: Youth Risk Behavior Survey 2003, 2005, 2007, 2009, Youth Risk Behavioral Surveillance System (YRBSS), Centers for Disease Control and Prevention (CDC)
In 2009, nearly seven in ten
Boston public high school students reported ever drinking alcohol. A lower percentage of Asian students than Latino students reported ever drinking alcohol. There were no other significant differences in reported lifetime alcohol use by race/ethnicity and no significant differences by gender, age, grades received, or years living in the US.
69% 64% 74% 66% 70% 71% 66% 52% 73% 69% 63% 67% 68% 68% 0% 20% 40% 60% 80% Always lived in the US Not always lived
in the US D's and F's A's B's and C's White Latino Black Asian 18 or older 16 or 17 15 or younger Male Female BOSTON
Percent of Boston Public High School Students
Figure 1.17 Lifetime Alcohol Use by
Selected Indicators, 2009
DATA SOURCE: Youth Risk Behavior Survey 2009, Youth Risk Behavioral Surveillance System (YRBSS), Centers for Disease Control and Prevention (CDC)
In 2009, approximately four in ten Boston public high school students reported drinking alcohol within the past month.
There were no significant
differences in reported past month alcohol use by gender or age. A lower percentage of Asian students compared to Latino and White students reported past month alcohol use.
41% 44% 33% 19% 45% 37% 34% 37% 39% 38% 0% 20% 40% 60% White Latino Black Asian 18 or older 16 or 17 15 or younger Male Female BOSTON
Percent of Boston Public High School Students
Figure 1.18 Past Month Alcohol Use by
Selected Indicators, 2009
DATA SOURCE: Youth Risk Behavior Survey 2009, Youth Risk Behavioral Surveillance System (YRBSS), Centers for Disease Control and Prevention (CDC)
In 2009, nearly one in five Boston public high school students reported binge drinking (drinking five or more alcoholic drinks within a couple of hours) during the past month.
There was no significant difference in binge drinking between males and females.
A higher percentage of students ages 18 or older reported binge drinking compared to students ages 15 or younger.
A lower percentage of Asian students reported binge drinking than White and Latino students.
24% 20% 14% 8% 27% 18% 12% 19% 17% 18% 0% 10% 20% 30% White Latino Black Asian 18 or older 16 or 17 15 or younger Male Female BOSTON
Percent of Boston Public High School Students
Figure 1.19 Past Month Binge Drinking
by Selected Indicators, 2009
DATA SOURCE: Youth Risk Behavior Survey 2009, Youth Risk Behavioral Surveillance System (YRBSS), Centers for Disease Control and Prevention (CDC)
DATA SOURCE: Youth Risk Behavior Survey 2009, Youth Risk Behavioral Surveillance System (YRBS), Centers for Disease Control and Prevention (CDC)
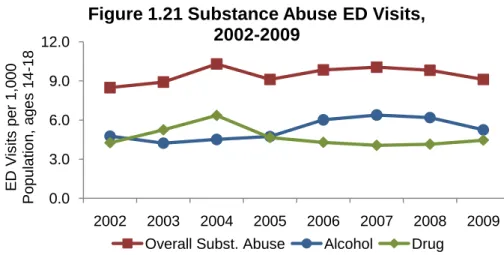
0.0 3.0 6.0 9.0 12.0 2002 2003 2004 2005 2006 2007 2008 2009 E D V is its p e r 1 ,0 0 0 P op ul ati on , ag es 14 -18
Figure 1.21 Substance Abuse ED Visits,
2002-2009
Overall Subst. Abuse Alcohol Drug
DATA SOURCE: Emergency Department Visit Data Base, Massachusetts Division of Health Care Finance and Policy
33% 23% 16% 30% 5% 11% 5% 25% 0% 10% 20% 30% 40% Smoked cigarettes during Past 30 Days Received Ds & Fs in the Past Year Carried Weapon at School during Past 30 Days
Did not Use Condom at Last Sex Pe rc e n t o f Bo s to n Pu b lic Hig h Sc h o o l Stu d e n ts
Figure 1.20 Selected Risky Behaviors by Binge
Drinking Status, 2009
Binge Drinker Non-Binge Drinker
In 2009, a higher percentage of students who had reported binge drinking during the past month also reported smoking cigarettes, receiving poor grades and carrying a weapon at school during the past 30 days compared to students who hadn‟t binged. There was no significant difference in the use of condoms during last sex by binge drinking status.
The substance abuse rates (including drug and alcohol) of ED visits for youths ages 14 to18 have remained fairly stable from 2002 to 2009. Between 2002 and 2004, the rate of substance abuse ED visits (drug and/or alcohol visits) for Boston youths ages 14 to18 increased 21%, resulting in the highest level during the period shown. Similarly, the drug abuse ED visits rate peaked in 2004. The highest level of alcohol abuse ED visits occurred in 2007, having increased 33% from 2002 to 2007.
DATA SOURCE: Acute Case Mix Files, Massachusetts Division of Health Care Finance and Policy 0.0 1.0 2.0 3.0 4.0 2002 2003 2004 2005 2006 2007 2008 2009 Hos pi tal iz ati o ns pe r 1, 00 0 P op ul ati on , ag es 14 -18
Figure 1.22 Substance Abuse Hospitalizations,
2002-2009
Overall Subst. Abuse Alcohol Drug
The rate of substance abuse hospitalizations for Boston youths ages 14 to 18 decreased from 3.1 per 1,000 population in 2002 to 1.7 in 2006 then increased to 2.8 by 2009. During this period, the rate of alcohol hospitalizations was consistently lower than the rate of drug hospitalizations.
References
1. Substance Abuse and Mental Health Services Administration. (2010). Results from the 2009 National Survey on Drug Use and Health: Volume I. Summary of National Findings (Office of Applied Studies, NSDUH Series H-38A, HHS Publication No. SMA 10-4586 Findings). Rockville, MD.
2. Drug Use Recognition Training. http://drugrecognition.com/Use%20Statistics.htm
Accessed June 20, 2011.
3. Office of National Drug Control Policy. Executive Office of the President. Teens and Prescription Drugs. February 2007
4. More Teens Getting Dangerous Prescriptions.
www.nlm.nih.gov/medlineplus/news/fullstory_106082.html Accessed January 3, 2011. 5. USDHH, NIH, NIAAA. Alcohol Research: A Lifespan Perspective. Alcohol Alert. Number 74, February 2008, pp. 1-5.
6. National Prevention Council, National Prevention strategy, Washington, DC: U.S. Department of Health and Human Services, Office of the Surgeon General, 2011.
7. MacKay AP, Duran C. Adolescent Health in the United States, 2007. National Center for Health Statistics. 2007.
Overall Drug Abuse
Substance abuse (illicit drug use, nonmedical use of prescription drugs, abuse of over-the-counter medication, and abuse of alcohol) continues to be a major health problem among adults in the U.S and is projected to double from almost 3 million adults with substance abuse disorders during 2002-2006 to nearly 6 million by 2020 (1).
Substance abuse varies by race/ethnicity, age, gender, education, employment status and other sociodemographic characteristics. For example, among adults in the US, a higher percentage of current (past month) substance abuse is reported by American Indians and Native Alaskans and Black Americans than by other races/ethnicities (2).
In 2009 in the US, 7.1 million adults ages 18 to 25 and 12.2 million adults ages 26 and over reported being current drugs users. Among adults ages 18 to 25, 18% reported marijuana as the major drug of current use followed by non-medical use of prescription drugs. About 2% reported current use of hallucinogens and less than 2% reported current use of cocaine (1). However, illicit drug use is not just a problem among young adults. During 2006-2008, an estimated 4.3 million adults ages 50 or over reported having used an illicit drug in the past year. Marijuana was reported as the most frequent illicit drug used in the past year followed by nonmedical use of
prescription drugs (3).
Among adults in the US, rising rates of non-medical use of prescription drugs (especially narcotic pain relievers) is a major cause of concern. Between 1998 and 2008, non-medical use of narcotic pain relievers increased by 400% (4).
A higher percentage of non-medical use of prescription drugs is reported for adults ages 18 to 25 than for any other adult age group (5).
Polydrug abuse (use of multiple drugs) is common among individuals engaged in non-medical use of prescription drugs. Polydrug abuse occurs when nonmedical use of prescription or illicit drugs are used in combination. Often alcohol is used with one or more drugs (6). Such mixing of substances can produce lethal consequences requiring immediate emergency treatment and at times, can result in death to the user.
The Overall Drug and Alcohol Abuse section of this report provides some insight into the types and extent of substances that are misused and abused among the Boston population. Included here are overall drug and alcohol indicators as well as drug-
specific indicators that present the types and extent of drugs commonly used, alcohol drinking behavior, some negative
consequences of substance abuse including hospital emergency room visits and inpatient stays, substance abuse treatment admissions, and drug and alcohol mortality. Such data will assist in further development and implementation of initiatives to address and reduce the substance abuse problem among Boston residents.
DATA SOURCE: Massachusetts Department of Public Health, Bureau of Substance Abuse Finance and Policy 0.0 25.0 50.0 75.0 2001 2002 2003 2004 2005 2006 2007 2008 2009 2010 Ad m is s io n s p e r 1 ,0 0 0 Po p u la ti o n Ag e s 1 4 a n d o v e r
Figure 2.2 Substance Abuse Treatment Admissions by Race/Ethnicity, 2001-2010
BOSTON Asian Black Latino White
DATA SOURCE: Massachusetts Department of Public Health, Bureau of Substance Abuse
39.8 41.8 34.7 33.4 34.1 34.2 35.4 34.5 35.1 33.7 0.0 15.0 30.0 45.0 2001 2002 2003 2004 2005 2006 2007 2008 2009 2010 A dm is s ion s pe r 1,0 00 P op ul ati on A ge s 14 an d ov er
Figure 2.1 Substance Abuse Treatment
Admissions, 2001-2010
From 2002 to 2004, the rate of substance abuse treatment admissions for Boston residents decreased 20%. From 2003 to 2010, the rate of substance abuse treatment admissions for Boston residents remained relatively stable, ranging between 33.4 and 35.4 admissions per 1,000 population.
Among Boston residents ages 14 years and over, Black and Latino residents had the highest overall rates of substance abuse treatment admissions compared to Asian and White
residents in 2001. However from 2001 to 2010, the rate for Black residents declined 45% and the rate for Latino residents declined 36%. By 2010, the rates for Black, Latino and White residents were similar while the rate for Asian residents remained much lower than the others.
* Back Bay includes Beacon Hill and the West End † South End includes Chinatown DATA SOURCE: Massachusetts Department of Public Health, Bureau of Substance Abuse
30% 36% 36% 39% 40% 46% 45% 42% 40% 42% 0% 20% 40% 60% 2001 2002 2003 2004 2005 2006 2007 2008 2009 2010 P erc en t o f T rea tm en t A dm is s ion s
Figure 2.4 Homelessness Among Substance
Abuse Treatment Admissions, 2001-2010
DATA SOURCE: Massachusetts Department of Public Health, Bureau of Substance Abuse
33.7 9.5 9.9 45.6 32.4 8.3 11.0 51.7 27.226.9 13.6 7.8 41.156.344.2 142.7 10.4 0.0 40.0 80.0 120.0 160.0 Ad m is s io n s p e r 1 ,0 0 0 Po p u la ti o n Ag e s 1 4 a n d o v e r by Neighborhood, 2010
In Boston, substance abuse treatment admission rate varies by neighborhood. In 2010, six neighborhoods had a treatment admissions rate higher than the overall Boston rate:
Charlestown, Jamaica Plain, Roxbury, South Boston, South Dorchester and the South End. The South End rate was more than four times the overall Boston rate. This high rate in the South End reflects the high rate of admission to treatment facilities by homeless residents who reside at the shelters in the South End.
From 2001 to 2006, the percentage of substance abuse treatment admissions of homeless clients increased 53% (from 30% to 46%).
In 2006, nearly half of all admissions were of homeless clients. By 2010, the percentage of homeless client admissions had decreased to 42%.
37.1 38.8 35.1 4.4 17.0 61.7 42.9 35.1 4.4 52.5 16.4 33.7 0.0 20.0 40.0 60.0 80.0 White Latino Black Asian 50+ 40-49 30-39 19-29 14-18 Male Female BOSTON
Admissions per 1,000 Population Ages 14 and over
Figure 2.5 Substance Abuse Treatment
Admissions by
Selected Indicators, 2010
DATA SOURCE: Massachusetts Department of Public Health, Bureau of Substance Abuse
Among Boston residents, substance abuse treatment admissions varied substantially by gender, age and
race/ethnicity.
In 2010, the substance abuse treatment admissions rate for Boston overall was 33.7 admissions per 1,000 population.
The rate for males was more than three times the rate for females.
In general, admissions rates increased with age until ages 50 and older. Adults ages 40 to 49 had the highest treatment admissions rate among all age groups.
Treatment admissions rates for Black, Latino and White
residents were similar. All three were approximately eight to nine times the rate for Asian residents.
51% 4% 5% 4% 33% 5% 6% 24% 10% 17% 0% 25% 50% 75% 100% Heroin Other Opioids
Cocaine Marijuana Alcohol
P e rc e n t o f T re a tm e n t A dm is s ion s
Admissions by Primary Drug,
Secondary/Tertiary Drug, 2010
Secondary/Tertiary Primary DATA SOURCE: MassachusettsDepartment of Public Health, Bureau of Substance Abuse
The overall substance abuse ED visit rate for Boston residents increased 30% from 22.8 (visits per 1,000 population) in 2002 to 29.7 in 2009. ED visit rates for both
alcohol and drugs increased during these years as well. Between 2002 and 2009, the alcohol abuse ED visit rate increased 35% and the drug abuse rate increased 19%. 0.0 10.0 20.0 30.0 40.0 2002 2003 2004 2005 2006 2007 2008 2009 E D V is its pe r 1,0 00 P op ul ati on
Figure 2.7 Substance Abuse ED Visits
2002-2009
Overall Subst. Abuse Alcohol Drugs
DATA SOURCE: Boston resident deaths, Massachusetts Department of Public Health
In 2010, the majority of all
treatment admissions cited heroin as the primary drug of abuse. Though one-third of admissions cited alcohol as the primary drug, one-half of all admissions cited alcohol as either primary, secondary or a tertiary drug of abuse.
While only 5% of admissions cited cocaine (including crack) as the primary drug, nearly five times as many additional admissions cited cocaine as either the secondary or a tertiary drug of abuse.
Of all admissions, 14% cited marijuana and 10% cited other (non-heroin) opioids as either primary, secondary or tertiary drugs of abuse.
0.0 6.0 12.0 18.0 2002 2003 2004 2005 2006 2007 2008 2009 Hos pi tal iz ati o ns pe r 1, 00 0 P op ul ati on
Figure 2.8 Substance Abuse
Hospitalizations, 2002-2009
Overall Subst. Abuse Alcohol Drug
DATA SOURCE: Acute Care Hospital Case Mix Files, Massachusetts Division of Health Care
The age-adjusted substance abuse mortality rate increased 67% from 2000 to 2007 then decreased 19% from 2007 to 2008. This decline appears more attributable to a decrease in the number of drug abuse deaths as opposed to alcohol abuse deaths.
Both the alcohol abuse and drug-abuse mortality rates peaked in 2006 then from 2006 to 2008 decreased 31% and 46%, respectively. 0.0 15.0 30.0 45.0 Deat hs pe r 10 0,0 00 P op ul ati on
Figure 2.9 Substance Abuse Mortality,
2000-2008
Overall Subst. Abuse Alcohol Drug
DATA SOURCE: Boston resident deaths, Massachusetts Department of Public Health
The overall substance abuse hospitalization rate remained relatively stable between 2002 and 2009. From 2002 to 2007, the rate increased 12% then from 2007 to 2009 decreased by 10% back to the previous 2002 level. The alcohol and drug abuse hospitalization rates followed a similar pattern as the overall substance abuse rate.
References
1. American College of Emergency Physicians (ACEP). As Elderly Population Surges, So Will Substance Abuse. ACEP News, May 2010. https://www.acep.org/content.aspx?id=48626. Accessed June 1, 2011.
2. Substance Abuse and Mental Health Services Administration. (2010). Results from the 2009 National Survey on Drug Use and Health: Volume I. Summary of National Findings (Office of Applied Studies, NSDUH Series H-38A, HHS Publication No. SMA 10-4586Findings). Rockville, MD.
3. The NSDUH Report. Illicit Drug Use Among Older Adults, December 28, 2009.
http://oas.samhsa.gov/2k9/168/168OlderAdults.htm Accessed July 10, 2011. 4. Prescription Drug Abuse Arises Dramatically
http://alcoholism.about.com/b/2010/07/22/prescription-drug-abuse-rises-dramatically.htm
Accessed July 10, 2011.
5. Office of National Drug Control Policy. Executive Office of the President. Teens and Prescription Drugs. February 2007
6. National Institute on Drug Abuse. CEWG. Epidemiologic Trends in Drug Abuse Advance Report: Prescription Drug Abuse. http://archives.drugabuse.gov/PDF/CEWG/AdvReport604.pdf Accessed July 9, 2011.
Heroin
Heroin is an opiate drug that is synthesized from morphine, a naturally occurring substance extracted from the seed pod of the Asian opium poppy plant. As such, heroin is considered a semi-synthetic opioid. Heroin usually appears as a white or brown powder or as a black sticky substance known as “black tar heroin.” Heroin can be injected, snorted/sniffed, or smoked—routes of
administration that rapidly deliver the drug to the brain. All three methods can lead to addiction and other severe health problems (1).
A range of treatment options exist for heroin addiction, including medications and behavioral therapies. Treatment usually begins with medically assisted detoxification to help patients withdraw from the drug safely. Medications such as clonidine and buprenorphine can be used to help minimize symptoms of withdrawal. However, detoxification alone has not been shown to be effective in preventing relapse. In order to help prevent relapse drugs such as methadone,
buprenorphine andnaltrexoneare often used in addition to cognitive behavioral therapies which promote techniques that support drug independence (1, 2).
Common street terms for heroin include “Big H”, “China White”, “Mexican Brown” and “Smack” (2). The drug remains readily available throughout New England in all forms: bag ($6-$50); bundle ($65-$300); gram ($45-$90); ounce ($1,300-$3,000); kilo ($50,000-$80,000); and cylinder shaped bullets/fingers of approximately 7 to10 gram quantities. According to the DEA‟s Domestic Monitoring Program, street-level purchases of heroin in Boston are predominantly South
American in origin and distributed in clear or colored glassine or wax packets. Past documented supplying sources have routed through New York, Miami and Houston (3).
50% 40% 28% 29% 18% 17% 17% 15% 0% 25% 50% 75% 2002 $1.19 2003 $0.73 2004 $0.87 2005 $0.88 2006 $1.63 2007 $1.37 2008 $1.62 2009 $1.38 A v e ra g e P e rc e n t P u ri ty
Figure 3.1 Heroin Purity and Price, Greater
Boston, 2002-2009
SOURCE: Domestic Monitoring Program, Drug Enforcement Agency
From 2002 to 2009, the average purity level of street-level heroin in greater Boston
decreased from 50% to 15%. From 2006 to 2009, the price of heroin remained well above the 2003 to 2005 level while the purity level remained well below levels observed from 2002 to 2005. By comparison, the average price of a 100% pure milligram of heroin in 2009 was 57% higher than in 2005 and the average purity level was 48% lower.
DATA SOURCE: Massachusetts Substance Abuse Information and Education Helpline 18.9 20.8 17.5 17.7 17.4 17.3 19.0 18.8 19.6 18.9 0.0 10.0 20.0 30.0 2001 2002 2003 2004 2005 2006 2007 2008 2009 2010 A dm is s ion s pe r 1,0 00 P op ul ati on A ge s 14 y ea rs an d ol de r
Figure 3.3 Heroin Treatment Admissions,
2001-2010
DATA SOURCE: Massachusetts Department of Public Health, Bureau of Substance Abuse
35% 34% 39% 37% 33% 33% 30% 33% 34% 29% 0% 10% 20% 30% 40% 2001 2002 2003 2004 2005 2006 2007 2008 2009 2010 P erc en t o f Hel pl ine Cal ls
2001-2010
Calls by Boston residents to the substance abuse helpline with heroin mentions ranged from a high of 39% in 2003 to a low of 29% in 2010. Between 2005 and 2009, the percentage of heroin helpline calls remained relatively stable.
The heroin treatment admissions rate for Boston residents has remained relatively stable since 2001. The rate reached a peak of 20.8 admissions per 1,000 population in 2002.
In 2010, the heroin treatment admissions rate for Boston overall was 18.9 admissions per 1,000 population.
The heroin treatment rate for males was more than three times the rate for females.
The heroin treatment admissions rate for residents ages 30 to 44 was higher than the rate for residents under the age of 30, and nearly three times the rate for residents 45 years and over.
The heroin treatment rate for Latino residents and White
residents was more than twice the rate for Black residents. Asian residents had the lowest heroin treatment admissions rate.
23.7 25.8 10.8 3.4 10.3 27.6 20.0 29.5 9.3 18.9 0.0 10.0 20.0 30.0 40.0 White Latino Black Asian 45+ 30-44 14-30 Male Female BOSTON
Admissions per 1,000 Population Ages 14 and over
Figure 3.4 Heroin Treatment
Admissions by
Selected Indicators, 2010
DATA SOURCE: Massachusetts Department of Public Health, Bureau of Substance Abuse
DATA SOURCE: Massachusetts Department of Public Health, Bureau of Substance Abuse 0.0 10.0 20.0 30.0 40.0 2001 2002 2003 2004 2005 2006 2007 2008 2009 2010 Ad m is s io n s p e r 1 ,0 0 0 Po p u la ti o n Ag e s 1 4 a n d o v e r 2001-2010 BOSTON <30 30-44 45+
Though it decreased 28% from 2002 to 2010, the heroin treatment admissions rate for Boston residents 30 to 44 years of age remained highest among age groups across all years from 2001 to 2010. In 2010, the heroin treatment admissions rate for residents ages 30 to 44 was roughly 1.4 times the rate for residents under the age of 30, and three times the rate for residents ages 45 and over.
DATA SOURCE: Massachusetts Department of Public Health, Bureau of Substance Abuse 18.9 3.9 5.0 31.3 20.8 4.6 4.3 28.0 10.714.4 8.4 4.3 22.0 39.7 22.6 81.1 5.7 0.0 25.0 50.0 75.0 100.0 Ad m is s io n s p e r 1 ,0 0 0 Po p u la ti o n Ag e s 1 4 a n d o v e r
Figure 3.7 Heroin Abuse Treatment Admissions by Neighborhood, 2010
*Includes Beacon Hill, Downtown, and the West End †Includes Chinatown
DATA SOURCE: Massachusetts Department of Public Health, Bureau of Substance Abuse
0.0 15.0 30.0 45.0 2001 2002 2003 2004 2005 2006 2007 2008 2009 2010 Ad m is s io n s p e r 1 ,0 0 0 Po p u la ti o n Ag e s 1 4 a n d o v e r
Figure 3.6 Heroin Treatment Admissions by Race/Ethnicity, 2001-2010
BOSTON Asian Black Latino White
From 2001 to 2010, the Latino heroin treatment admissions rate was highest among
racial/ethnic groups. In 2010, the rate for Latino residents was almost eight times the rate for Asian residents, more than twice the rate for Black residents, and very similar to the rate for White residents. Between 2001 and 2010, the heroin treatment admissions rates for Latino and Black residents decreased 38% and 51%, respectively, while the rate for White residents increased 52%.
In 2010, the heroin treatment admission rate for Boston overall was 18.9 admissions per 1,000 population. Of all the Boston neighborhoods, the South End had the highest rate (81.1 per 1,000 population), which was over four times the rate for Boston overall. Allston/
DATA SOURCE: Massachusetts Department of Public Health, Bureau of Substance Abuse 0% 25% 50% 75% 100% 2001 2002 2003 2004 2005 2006 2007 2008 2009 2010 Pe rc e n t o f He ro in Pri m a ry T re a tm e n t Ad m is s io n s
Figure 3.9 IDU Primary Administration Route Among Heroin Primary Drug Treatment Admissions, by
Race/Ethnicity, 2001-2010
Boston Asian Black Latino White
DATA SOURCE: Massachusetts Department of Public Health, Bureau of Substance Abuse
0% 25% 50% 75% 100% 2001 2002 2003 2004 2005 2006 2007 2008 2009 2010 Pe rc e n t o f Hero in Pri m a ry T rea tm en t Adm is s ion s
Among Heroin Primary Drug Treatment Admissions, Boston, 2001-2010
Inhalation Injection
The most common route of heroin administration among clients admitted primarily for heroin treatment is through injection. In 2001, 66% of primary heroin client admissions reported that their primary route of heroin administration was through injection. The percentage primarily injecting the drug increased 30% from 2001 to 2010 when nearly nine in ten heroin primary admissions (86%) reported injecting heroin. Conversely, the percentage of admissions reporting inhalation, the second most common route of heroin administration, decreased over the years shown.
From 2001 to 2010, the percentage of injection or intravenous drug use (IDU) as primary route of drug administration among primary heroin treatment admissions increased 21% for Asian, 16% for White, and 36% for Latino client admissions. Within the same time frame, the percentage of primary route IDU decreased 26% among Black client admissions.
Other Opioids (Excluding Heroin)
Prescription medications such as narcotic analgesics (pain relievers with sedative properties) are highly beneficial treatments for a variety of health conditions. Opioids are narcotic analgesics that work by binding to opioid receptors in the nervous system. Though there are competing
definitions, opioids in this report include opiates (drugs that contain chemical compounds directly from the opium poppy), semi-synthetic opioids (drugs synthetically derived from chemical
compounds found in the opium poppy) and other fully synthetic drugs that bind to opioid receptors and often share similar chemical properties and pain relieving effects as opiates and
semi-synthetics. Heroin is considered a semi-synthetic opioid. For purposes of this report, examples of other (non-heroin) opioids include oxycodone (e.g., OxyContin®, Percocet®), hydrocodone (e.g., Vicodin®), codeine, methadone, morphine, and fentanyl. When misused, that is taken in a manner or dosage other than what was prescribed, prescription pain relievers can produce a euphoric „high‟ as well as serious adverse health effects, including addiction and overdose.
As with heroin, addiction to other opioid pain relievers can be chemically treated. Medications for effective treatment such as methadone, buprenorphine, and naltrexone have been drawn from research on treating heroin addiction. Naloxone (e.g., Narcan®) is often used to successively reverse opioid overdoses.
12% 14% 14% 16% 15% 15% 15% 15% 17% 21% 0% 10% 20% 30% 2001 2002 2003 2004 2005 2006 2007 2008 2009 2010 P erc en t o f Hel pl ine Cal ls
Figure 3.10 Other Opioids Helpline Calls,
2001-2010
DATA SOURCE: Massachusetts Substance Abuse Information and Education Helpline
The percentage of other (non-heroin) opioids helpline calls by Boston residents increased 75% from 2001 to 2010. The percentage of other opioids helpline calls remained constant from 2005 to 2008 (15%), but increased 40% from 2008 to 2010.
DATA SOURCE: Massachusetts Department of Public Health, Bureau of Substance Abuse 2.1 2.5 2.4 2.3 2.5 2.5 2.8 3.2 3.6 3.4 0.0 1.0 2.0 3.0 4.0 2001 2002 2003 2004 2005 2006 2007 2008 2009 2010 A dm is s ion s pe r 1,0 00 P op ul ati on A ge s 14 an d O v er
Figure 3.11 Other Opioid Treatment Admissions
2001-2010
Though still relatively low, the other opioids (excluding heroin) treatment admissions rate increased 62% from 2001 to 2010 for Boston residents. From 2004 to 2009, the rate
In 2010, Boston‟s other opioids (i.e., excluding heroin) treatment admissions rate was 3.4
admissions per 1,000 population. The male treatment admissions rate was more than two times the female rate.
The other opioids treatment admissions rate for residents in age groups 14-29 and 30-44 was 2.1 times higher and 2.3 times higher, respectively, than the rate for residents in the 45+ age group. Among racial/ethnic groups, White Boston residents experienced the highest treatment admissions rate, more than four times the rate for Black residents and Latino residents.
Among neighborhoods, the South End and South Boston had the highest rates of treatment
admissions for other opioids, while West Roxbury and Back Bay had the lowest rates.
0.7 10.5 3.8 9.4 2.7 1.2 1.2 2.5 1.3 4.8 1.4 1.1 4.8 6.5 0.9 1.8 5.3 1.3 1.1 * 1.9 4.3 4.0 4.8 2.1 3.4 0.0 5.0 10.0 15.0 West Roxbury South End† South Dorchester South Boston Roxbury Roslindale North End North Dorchester Mattapan Jamaica Plain Hyde Park Fenway East Boston Charlestown Back Bay** Allston/Brighton White Latino Black Asian Ages 45+ Ages 30-44 Ages 14-29 Male Female BOSTON
Admissions per 1,000 Population Ages 14 and Over Figure 3.12 Other Opioids Treatment
Admissions by Selected Indicators 2010
*Insufficient sample size for Asians
**Back Bay includes Beacon Hill and the West End. †South End includes Chinatown.
DATA SOURCE: Massachusetts Department of Public Health, Bureau of Substance Abuse
DATA SOURCE: Massachusetts Department of Public Health, Bureau of Substance Abuse 0.0 2.0 4.0 6.0 2001 2002 2003 2004 2005 2006 2007 2008 2009 2010 Ad m is s io n s p e r 1 ,0 0 0 Po p u la ti o n Ag e s 1 4 a n d O v e r
Figure 3.14 Other Opioids Treatment Admissions by Race/Ethnicity, 2001-2010
BOSTON Black Latino White
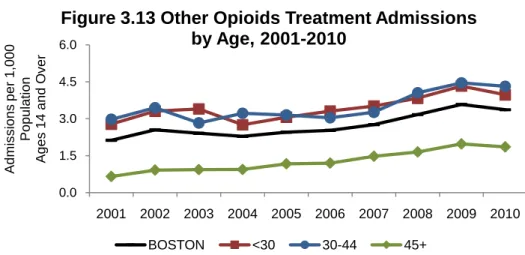
DATA SOURCE: Massachusetts Department of Public Health, Bureau of Substance Abuse 0.0 1.5 3.0 4.5 6.0 2001 2002 2003 2004 2005 2006 2007 2008 2009 2010 Ad m is s io n s p e r 1 ,0 0 0 Popu lat ion Ag e s 1 4 a n d O v e r
Figure 3.13 Other Opioids Treatment Admissions
by Age, 2001-2010
BOSTON <30 30-44 45+
Among Boston residents, the other opioids (excluding heroin) treatment admissions rate increased for all age groups from 2001 to 2010. For all years, rates were higher for the <30 and 30-44 age groups, than for the 45+ age group. Treatment admissions rates for Boston residents increased 58% between 2001 and 2010.
From 2001 to 2010, the other opioids (excluding heroin) admissions rate increased for all three racial/ethnic groups: Black residents by 119%, White residents by 53%, and Latino residents by 35%. From 2009 to 2010, the rates for Latino and White residents decreased slightly while the rate for Black residents was stable. The rate for Asians is not presented due to the small numbers of admissions.
751 1,018 0 300 600 900 1,200 2009 2010 Num be r of NRI Cas es
Figure 3.15 Boston EMS Narcotic
Related Illness (NRI) Cases,
2009 and 2010
DATA SOURCE: Boston Public Health Commission, Boston Emergency Medical Services
Boston Emergency Medical
Services (Boston EMS) maintains a database of narcotic related illness (NRI) cases. Compared to 2009, there were 267 more Boston EMS narcotic related illness cases in 2010, an increase of 36%. 30% 38% 32% 22% 78% 31% 39% 30% 34% 66% 0% 30% 60% 90% <30 30-44 45+ Female Male P erc en t o f NRI Cas es
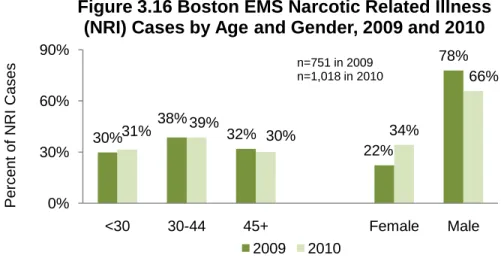
Figure 3.16 Boston EMS Narcotic Related Illness
(NRI) Cases by Age and Gender, 2009 and 2010
2009 2010
n=751 in 2009 n=1,018 in 2010
DATA SOURCE: Boston Public Health Commission, Boston Emergency Medical Services
The percentage of Boston EMS narcotic related illness cases within the City of Boston indicated a similar pattern across age groups, from 2009 to 2010. Although males represent the majority of cases for both 2009 and 2010, data for 2010 suggest rising usage among women.
96% 85% 0% 25% 50% 75% 100% 2009 2010 P erc en t o f O v erdos es T rea ted w t Nal ox on e
Reversal Among Naloxone (Narcan®)
Administrations, 2009 and 2010
DATA SOURCE: Boston Public Health Commission, Boston Emergency Medical Services
In 2009, 96% of the Boston EMS Narcan® administrations led to successful overdose reversals, saving as many as 361 lives. In 2010, 85% of Narcan®
administrations led to successful reversals, saving as many as 188 lives.
DATA SOURCE: Emergency Department Visit Data Base, Massachusetts Division of Health Care Finance and Policy
3.5 3.8 3.6 3.4 3.2 3.2 3.0 3.1 0.0 1.0 2.0 3.0 4.0 2002 2003 2004 2005 2006 2007 2008 2009 Hos pi tal iz ati o ns pe r1,0 00 P o p u la ti o n
Figure 3.19 Heroin/Opioid Hospitalizations,
2002-2009
DATA SOURCE: Acute Case Mix Files, Massachusetts Division of Health Care Finance and Policy
3.5 3.5 3.1 3.2 2.9 2.8 3.2 3.8 0.0 1.0 2.0 3.0 4.0 2002 2003 2004 2005 2006 2007 2008 2009 E D V is its pe r 1,0 00 P op ul ati on
Figure 3.18 Heroin/Opioid ED Visits,
2002-2009
The rate of heroin/opioid ED visits by Boston residents remained relatively stable from 2002 to 2009. From 2002 to 2007, the rate decreased 20% but then increased 36% from 2007 to 2009.
Heroin/opioid hospitalizations have remained relatively stable from 2002 to 2009. The highest rate occurred in 2003 (3.8 per 1,000 population) and the lowest rate in 2008 (3.0 per 1,000 population).