Understanding Bicyclist-Motorist Crashes in
Minneapolis, Minnesota
A comprehensive look at crash data from 2000-2010 and recommendations for improved bicyclist safety
Bicycle and Pedestrian Section Public Works Department
City of Minneapolis January 15, 2013
Understanding Bicyclist-Motorist Crashes in Minneapolis, Minnesota:
A comprehensive look at crash data from 2000-2010 and solutions for improved bicyclist safety January 15, 2013
City of Minneapolis Public Works Department Bicycle and Pedestrian Section 350 South Fifth Street, Room 203 Minneapolis, Minnesota 55415 www.minneapolismn.gov/bicycles
This report is published by the City of Minneapolis Public Works Department. For questions about this report, please contact Simon Blenski at 612-333-1274 or simon.blenski@minneapolismn.gov.
Some of the images in this report are based on illustrations by Chicago Cartographics for the Minneapolis Bicycle Map, published by Hedberg Maps, Inc.
The 2011 Minneapolis Bicycle Master Plan1 calls for a 10 percent annual reduction in the number of motorist crashes. To better understand what is causing crashes and to meet reduction goals, 2,973 bicyclist-motorist crash records from 2000-2010 were examined. Specific crash attributes were extracted from Minnesota Department of Public Safety accident reports, analyzed and mapped. The findings in this report should be used to inform and influence the design of new bicycle facilities, the redesign of existing roadways, the development of education programs for bicyclists and motorists, enforcement campaigns, and the creation of bicycle-related policy in Minneapolis.
Key Findings from 2000-2010:
When crashes occur:
• An average of 270 bicyclist-motorist crashes occur annually in Minneapolis. This is down from an
average of 320 from 1993-1999. (p. 15)
• Crashes are most prevalent from April-October (88.3 percent), on weekdays (79.3 percent) and during
the afternoon peak period from 3:00-6:00 p.m. (28.5 percent). (p. 15)
• Crashes mostly occur on clear or cloudy days (93.5 percent), when the road surface is dry (89.1 percent)
and during daylight hours (72.7 percent). (p. 16)
Who is involved:
• Most (93.5 percent) crashes involve bicycles and automobiles. Large trucks, buses, taxis and other
vehicles make up the remaining vehicle types. (p. 16)
• Bicyclist age is tracked for 2009-2010 data. The cohort aged 18-24 was the most prevalent - involved in
21.9 percent of crashes. (p. 16)
• Crashes involving known drug use or drinking are limited. Bicyclists are impaired in 5.9 percent of
crashes and motorists in 1.2 percent of crashes. (p. 17)
• Approximately one out of five crashes are hit-and-runs, with the motorist fleeing the scene 93.3 percent
of the time. Motorist condition is unknown in these cases. (p. 17)
Injuries and fatalities:
• Bicyclists sustained an injury in 87.0 percent of crashes. It is estimated that motorists sustained an injury
in no crashes. (p. 21)
• There were 12 bicyclist fatalities from 2000-2010. All cases involved at least one of the three following
attributes: rain or wet pavement, aggressive or impaired motorist, or a large motor vehicle. (p. 21)
Causes of crashes:
• Assigning fault is a difficult and inexact task. However, it appears that bicyclists and motorists are
equally contributing to the causes of crashes. Bicyclists are estimated to have contributing factors in 59.0 percent of crashes and motorists in 63.9 percent of crashes. The totals exceed 100 percent as both parties have contributing factors. (p. 18)
• The most common contributing factors for bicyclists are failure to yield right-of-way (13.3 percent),
disregarding a traffic control device (12.6 percent) and improper lane use (9.2 percent). (p. 18)
• The most common contributing factors for motorists are failure to yield right-of-way (31.8 percent),
driver inattentive or distracted (8.5 percent) and improper lane use (5.2 percent). (p. 18)
• The most common pre-crash maneuvers for bicyclists are bicyclist riding across roadway (46.0 percent),
bicyclist riding with traffic (29.8 percent) and bicyclist riding against traffic (15.4 percent). (p. 18)
• The most common pre-crash maneuvers for motorists are vehicle following roadway (42.2 percent),
vehicle making left turn (18.7 percent) and vehicle making right turn (16.4 percent). (p. 18)
1 City of Minneapolis. Bicycle Master Plan. June 2011. www.minneapolismn.gov/projects/plan
Where crashes are occurring:
• Forty-one percent of crashes occur at intersections and another 40 percent occur within 50 feet of
intersections. (p. 23)
• Crashes occur in all areas of Minneapolis, although there is a clear concentration along major arterials
with high volumes of motor vehicles. (p. 23)
• The highest crash volume intersections from 2000-2010 are East Franklin Avenue and South Cedar Avenue
(20), Hennepin Avenue and North 7th Street (19), Hennepin Avenue and North 3rd Street (17), Hiawatha
Avenue South and East 26th Street (17), East Franklin Avenue and Nicollet Avenue South (17). (p. 23)
• Corridors with the highest number of crashes from 2000-2010 are East-West Lake Street (226
bicyclist-motorist crashes), East-West Franklin Avenue (205), Portland Avenue South (127), Hennepin Avenue
South in downtown (126) and Lyndale Avenue South (111). (p. 24)
• Corridors with the highest crash rates from 2000-2010 are East-West 28th Street (68.5 crashes per million
bicycle miles traveled), Lowry Avenue North-Northeast (55.4), Marquette Avenue South (39.5), East-West
26th Street (39.2) and West Broadway-Broadway Street Northeast (39.1). (p. 24)
Safety in numbers:
• There is a clear correlation between the number of bicyclists and the crash rate. Minneapolis has seen
this phenomena occur across both time and space. (pp. 8,9 & 25)
• As the number of bicyclists has increased over the past decade, the crash rate has decreased. (pp. 8-9)
• On streets and corridors with higher volumes of bicycle traffic, the crash rate tends to be lower than on
streets with lower volumes of bicycle traffic. (p. 25)
• This safety in numbers effect is documented in other U.S. cities and in academic literature. (pp. 8-9)
Summary
The analysis of the 2,973 bicyclist-motorist crashes found that crashes are complex events and there is no one factor that is contributing to crashes. However, three primary conclusions emerge from the data:
1. Most crashes are occurring at intersections along major arterials. 2. Motorists are not seeing or yielding to bicyclists.
3. Bicyclists are not riding in a predictable manner.
Recommendations
The recommendations aim to reduce perceived fears of “interested but concerned” bicyclists and are presented within the framework of the “Six E’s of Bicycling”: Equity, Engineering, Enforcement, Education, Encouragement and Evaluation.
Equity
• Develop a bicycle traffic safety work group
• Ensure that safety talking points equally
address motorists and bicyclists Engineering
• Guide and protect bicyclists at intersections
and on busy streets
• Highlight areas where bicyclists and
motorists cross paths
• Provide designated and comfortable places
for bicyclists to ride Enforcement
• Expand a relationship with the MPD
• Ensure bicyclists and motorists are treated
equally under the law
• Use enforcement as an educational tool
Education
• Educate professional drivers
• Use media to reach a wide audience
• Continue rides and classes
Encouragement
• Design infrastructure that is perceived to be safe
• Publish data and document results
Evaluation
• Publish a regular safety bicyclist report
Chapter 1 - Introduction ...7
1.1 Purpose ... 7
1.2 Using this Report ... 7
Chapter 2 - Bicyclist Safety in Context ...8
2.1 A Changing City for Bicyclists ... 8
2.2 Safety in Numbers ... 8
2.3 Previous Work ... 9
Chapter 3 - Understanding the Data ...10
3.1 How a Crash is Reported ...10
3.2 Unreported Crashes ...10
3.4 Interpretation and Assumptions ...12
3.5 What is Not Captured in the Data ...12
3.6 Notes About Terminology ...12
Chapter 4 - Approach & Methodology ...13
4.1 Approach ...13
4.2 Methodology ...13
Chapter 5 - Results ...14
5.1 Overview ...14
5.2 When Crashes Occur ...15
5.3 Environmental Conditions ...16
5.4 Motorist Vehicle Type ...16
5.5 Bicyclist Age ...16
5.6 Rider and Driver Condition ...17
5.7 Crash Circumstances (Hit-and-Runs) ...17
5.8 Contributing Factors ...17
5.9 What is Causing Crashes? ...18
5.10 Specific Crash Types and Other Crash Attributes ...19
5.11 Injury Severity ...21
5.12 Fatalities...21
5.13 The Cost of Crashes ...22
5.14 Where Crashes are Occurring ...23
Chapter 6 - Discussion, Approaches and Recommendations ...26
6.1 Summary of Findings ...26
6.2 Approaching Bicyclist Safety ...26
6.3 Recommendations for Improved Bicyclist Safety ...28
Appendix
Appendix A: Example MN DPS Accident Reports ...A-1 Appendix B: MN DPS Accident Coding List ... B-6 Appendix C: Complete Bicyclist-Motorist Crash Data 2000-2010 ... C-9 Appendix D: State and Peer City Comparison ... D-19 Appendix E: Supplemental Context Maps ... E-21
Minneapolis Bikeways ...22
Bicyclist Estimated Daily Traffic ...24
Signalized Intersections ...27
One-Way Streets ...28
Posted Speed Limit ...29
Schools and Parks ...30
Sidewalk Riding ...31
Appendix F: Supplemental Crash Maps ... F-32 Crash Density by Year ...33
Crash Density by Season ...45
Crash Density by Day ...49
Crash Density by Time ...51
Crash Density by Circumstance ...59
Crash Density by Vehicle Type (Non-Bicycle)...60
Crash Density by Bicyclist Condition ...63
Crash Density by Motorist Condition ...64
Crash Density by Bicyclist Age ...65
Crash Density by Bicyclist Contributing Factor ...73
Crash Density by Bicyclist Pre-Crash Maneuver ...87
Crash Density by Motorist Pre-Crash Maneuver ...93
Crash Density by Motorist Combined Attributes ...99
Crash Density by Injury Severity ...101
Appendix G: Corridor Crash Rates ... G-105 Appendix H: Supplemental Corridor Analysis ... H-110 Lowry Avenue North-Northeast ...111
West Broadway Avenue North | Broadway Street Northeast ...112
Central Avenue Northeast ...113
Hennepin Avenue South (Downtown) (First Avenue Northeast) ...114
University Avenue Southeast | Fourth Street Southeast ...115
Washington Avenue North-South | Riverside Avenue South ...116
Marquette Avenue South | Second Avenue South...117
Nicollet Mall/Avenue South | Third Avenue South ...118
East-West Franklin Avenue ...119
East-West 24th Street | East-West 26th Street | East-West 28th Street ...120
East-West 35th Street | East-West 36th Street | East-West 38th Street ...121
East-West Lake Street (Lagoon Avenue) | East-West 31st Street ...122
Hennepin Avenue (South) | Lyndale Avenue South ...123
Portland Avenue South | Park Avenue South ...124
Cedar Avenue South ...125
1.1 Purpose
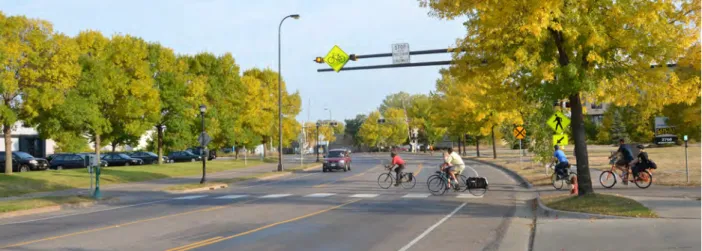
Over the past decade Minneapolis has undergone a bicycling renaissance. More residents, workers and visitors are choosing to ride a bicycle for more trips than in the past one hundred years. Significant expansion of the city’s bicycling network, increased encouragement and education, and a more visible bicycling culture have made Minneapolis one of the best cities for bicycling in the U.S. The City of Minneapolis intends to continue this trend and is committed to making bicycling a safe, easy and comfortable way to get around Minneapolis. The 2011 Minneapolis Bicycle Master Plan calls for an ambitious 10 percent annual reduction
in bicyclist-motorist crashes.1 Without proper
understanding of what is causing crashes,
implementing countermeasures will be difficult and achieving reduction goals will be challenging. By compiling nearly 3,000 crash records from the past decade, this research takes the first step in building local understanding of bicyclist-motorist crashes in Minneapolis. The findings in this report should inform future design, planning and policy related to bicycles and bicyclist safety in Minneapolis.
1.2 Using this Report
Because this is the first comprehensive crash analysis conducted by the City, the data are presented in a comprehensive manner - thoroughly educating readers about crash data sources, the findings of the analysis and most importantly, how the data can inform countermeasures.
1 City of Minneapolis. Bicycle Master Plan. June 2011. www.minneapolismn.gov/bicycles/projects/plan
The report begins by providing context and noting relevant changes to bicycling in Minneapolis (Chapter 2). Chapter 3 serves as a primer on crash data and reporting and Chapter 4 discusses the approach and methodology used for this analysis. Chapter 5 is the results section - covering when, why and where crashes are occurring. Chapter 6 closes with a discussion about approaches to improving bicyclist safety and using the results to implement countermeasures. The Appendix includes supplemental data, a comparison of peer cities, additional maps, crash rates and corridor analysis. Planners and engineers should refer to this document when designing new facilities to ensure bicyclist comfort is prioritized and prevalent crash types are considered in the design. Those educating road users should incorporate the findings into curriculum, safety campaigns and other media. Policy makers and enforcement officers should use the findings to affect behavior change that engineering or education cannot efficiently address. And lastly, Public Works staff can reference this report to determine methods for continued crash reporting and efficient evaluation of safety measures.
While this report highlights the negative aspects of bicycling, it is only done to advance the safety of all road users. Research has shown that the benefits of riding a bicycle in an urban environment far outweigh the risks.2 It is the hopes that this research will help mitigate the potential risks - further promoting the benefits bicycling can bring to Minneapolis.
2 de Hartog, Jeroen Johan, et. al. “Do the Health Benefits of Cycling Outweigh the Risks?” Environmental Health Perspectives. 18 (2010).
Chapter 1 - Introduction
Chapter 2 - Bicyclist Safety in Context
2.1 A Changing City for Bicyclists
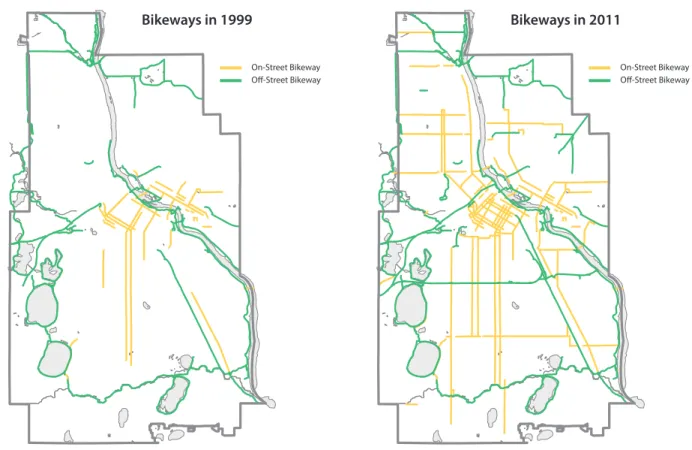
This report analyzes bicyclist-motorist crash data from 2000-2010. Riding a bicycle in Minneapolis in 2000 was a much different experience than in 2010. At the start of the decade the Midtown Greenway did not yet exist, Hennepin Avenue and other downtown streets looked much different and the concept of bicycle boulevards had not yet arrived in Minneapolis. However, over the next ten years bikeways and bicycling made substantial gains. From 1999 to 2011 the miles of bikeways doubled from 80 to 166, with a significant increase in the number of on-street facilities. Most bikeways added in the later half of the decade were made possible in part by the $25 million federal Non-Motorized Transportation Pilot Program grant awarded to the Minneapolis area in 2007. From 2000-2010 the number of regular bicycle commuters increased
from 1.6 to 3.4 percent1 and from 2007 to 2011 the
number of bicycle trips increased 47 percent.
1 U.S. Census Bureau. 2000 Decennial Census and 2011 American Community Survey. www.census.gov
2.2 Safety in Numbers
While added infrastructure is correlated to the increasing number of bicyclists in Minneapolis, the number of bicyclists themselves appear to be improving safety. Despite the fact that the number of regular bicycle commuters doubled over the past two decades, the number of reported crashes has held steady at around 300 crashes per year. With approximately 3,000 bicycle commuters in 1993 and 7,000 in 2011, the city-wide crash rate decreased by over two fold.2
This trend is not unique to Minneapolis and is documented in other cities. Analysis of 68 California cities found that counter to intuition, “a motorist is less likely to collide with a person walking and bicycling when there are more people walking or
bicycling.”3 Data from Portland, Oregon reveals a
2 The city-wide crash rate is the ratio of reported crashes to the number of regular bicycle commuters as collected by the U.S. Census Bureau.
3 Jacobsen, Peter L. “Safety in Numbers: More Walkers and Bicyclists, Safer Walking and Bicycling.” Injury Prevention. 2003; 9: 205-209.
Bikeways in 1999 Bikeways in 2011
Figure 2.1 - Minneapolis on-street and off-street bikeways in 1999 and 2011.
On-Street Bikeway On-Street Bikeway
extensive detail. Crash reports were processed manually and specific coding was tabulated. The 2006-2008 findings were used as guidance for this research and are referenced at times throughout this report. While the 2010 analysis adhered to a sound methodology, the task of manually examining accident reports required a substantial number of staff hours. Duplicating the effort for a larger time period would be a significant effort.
For this analysis the Public Works crash database was used to analyze data. This allowed for more efficient analysis, but did not capture all of the details listed on accident reports. Further explanation of data sources and methodology are outlined in Chapters 3 and 4.
similar trend as bicycling increases.4 While the City of Minneapolis aims to decrease the actual number of crashes, the decreasing crash rate and safety in numbers effect is promising.
2.3 Previous Work
The Public Works Department has documented traffic crashes for decades, although this is the first City report thoroughly analyzing bicyclist-motorist crashes in Minneapolis.
Internal work was conducted in the late 1990’s related to downtown bicycle safety. A city-wide analysis was conducting in 2010 that examined crashes from 2006-2008. This analysis looked at a smaller sample size, but examined the data in
4 Portland Bureau of Transportation. 2011 Bicycle Counts Report. February 2012. www.portlandonline.com/transportation/ index.cfm?c=44671 Bic ycle Trips & C ommut ers MI iles of Bikew ay s Off-street bikeways On-street bikeways Bicycle Commuters Bicycle Trips 0 35 70 105 140 175 0 7,000 14,000 21,000 28,000 35,000 2011 2010 2009 2008 2007 2006 2005 2004 2003 2002 2001 2000 1999
Figure 2.2 - Miles of bikeways, bicycle commuters and bicycle trips in Minneapolis, 1999-2011. Source: U.S. Census Bureau 1990-2000 Decennial Census, 2005-2011 American Community Survey and Public Works Non-Motorized Traffic Counts 2007-2011
Bic ycle C ommut ers Repor ted C rashes 0 200 400 600 800 1,000 0 2,000 4,000 6,000 8,000 10,000 2011 2010 2009 2008 2007 2006 2005 2004 2003 2002 2001 2000 1999 1998 1997 1996 1995 1994 1993 Reported Crashes Bicycle Commuters
Crash Rate (Ratio of bicycle crashes to bicycle commuters)
Figure 2.3 - Estimated city-wide bicyclist crash rate, 1993-2010. Source: U.S. Census Bureau 1990-2000 Decennial Census, 2005-2011 American Community Survey
Chapter 3 - Understanding the Data
3.1 How a Crash is Reported
A traffic crash is an unfortunate and complex event. There are often multiple contributing factors, multiple parties involved and several layers of interpretation and reporting. In Minnesota, an individual involved in a traffic crash that immediately results in property damage or bodily injury has the legal obligation to remain at the scene of the crash until contact information is exchanged with all parties involved.1 If a police officer is not immediately called to the scene, involved parties have up to 72 hours to notify authorities.
Once a police officer collects the necessary information, he or she completes a Minnesota Department of Public Safety (DPS) accident report. Location, time, personal information, weather, road surface conditions and other attributes are recorded using a standardized coding system. To supplement the codes, a crash narrative and diagram are also completed as part of the report.
The Minneapolis Public Works Department receives copies of accident reports from the Minneapolis Police Department and the Minneapolis Park Police. Select information is entered into an internal Public Works database and the crash reports are then destroyed. Attributes entered into the crash database are discussed in Section 4.2.
1 Minnesota Statute. 169.09 Accidents. www.revisor.mn.gov/statutes
3.2 Unreported Crashes
This report only examines data from reported traffic
crashes. Crashes of all types go unreported, but it is estimated that bicycle and pedestrian crashes are overrepresented among unreported crashes. Reasons for not reporting a crash may be that no party was injured, property damage was marginal, individuals fled the scene or were not aware that they are required to report a crash.
A possible method for determining the number of unreported crashes is to examine hospital records. A study of bicyclist-motorist crashes in California, North Carolina and New York found that only 42.5-66.7 percent of bicyclist emergency room visits
matched bicyclist-motorist crash records.2 The data
only examined hospital visits for bicyclists involved in bicyclist-motorist traffic crashes - not solo falls. These findings imply that 33.3-57.5 percent of bicyclist-motorist crashes go unreported. However, definitive conclusions cannot be made because all crashes do not automatically result in hospitalization.
Examining Minneapolis hospital records from the Minnesota Department of Health do not reveal a clear conclusion either. According to accident reports, most, but not all bicyclist-motorist crashes
2 Federal Highway Administration. Injury to Pedestrians and Bicyclists: An Analysis based on Hospital Emergency Department Data. FHWA-RD-99-078. 1999.
1
Crash occurs2
Police officer collects information3
MN DPS accident report completed by police officer4
Copy of accident report submitted to MinneapolisPublic Works
5
Minneapolis Public Works enters select crash information into database Figure 3.1 - The crash reporting process from collision to data entry.officer determines that there was no apparent or obvious factor.
Pre-crash maneuvers describe the actions of each
party just prior to the collision. Common pre-crash maneuvers are “Vehicle Making Left Turn,” “Bicyclist Riding With Traffic,” or “Bicyclist Riding Against Traffic.” While other crash attributes are useful in determining cause, it is primarily contributing factors and pre-crash maneuvers that allow for the determination of crash causes and crash typing. Example accident reports and coding lists are included in Appendix A and B.
A peace office has the option of including up to two contributing factors on an accident report. For example a bicyclist could have both disregarded a traffic signal and been under the influence. However, most crash reports only include one contributing factor and Minneapolis Public Works only records the first, or primary factor on the report.
While Public Works records the total number of vehicles and injuries, only detailed data is compiled for the first two vehicles in a crash. For example, if an automobile rear ends another automobile which then pushes the second vehicle into a bicyclist, only details about the first two vehicles (automobile one and automobile two) would be recorded by Public Works. These complex events are important, but only represent less than one percent of the crashes analyzed in this report. Some records are technically bicycle-related crashes, although the database may only show vehicle one as an automobile and vehicle two as an automobile.
result in bicyclist injuries. However, even when injuries are sustained, the injury may not be severe enough for hospitalization or an individual may refuse medical attention for other reasons. Also, a bicyclist involved in a crash occurring outside the city may visit a Minneapolis hospital or vice versa.
The data in Figure 3.2 show a very weak correlation to injuries that may require hospitalization (moderate, severe or unknown injuries), but does not yield any
conclusive results.3 The reason for the low number of
moderate and severe injuries from 2000-2002 is not clear, although coding errors may be a possibility. Note, this data does not include bicycle injuries from solo falls.
3.3 Accident Reports and Definitions
On a crash report, an array of information is compiled by the police officer assigned to the case. Both the Minneapolis Police Department and Minneapolis Park Police use Minnesota DPS accident reports. A series of standardized codes are used to efficiently categorize crash attributes. While all codes help explain the cause(s) and circumstance(s) of a crash, the two codes of particular interest are contributing factor and pre-crash maneuver.
Contributing factors are circumstances that directly
lead to the collision. Some of the most common contributing factors are “Failure to Yield Right-of-Way” or “Disregarding a Traffic Control Device.” “No Clear Factor” is recorded for a party if the police
3 Minnesota Department of Health. Minnesota Injury Data Access System (MIDAS). www.health.state.mn.us/injury/midas
0 100 200 300 400 2010 2009 2008 2007 2006 2005 2004 2003 2002 2001 2000 Reported crashes (DPS accident reports)
Reported crashes with moderate, severe or unknown injury (DPS accident reports)
Reported hospital visit by bicyclists involved in a crash (MIDAS) Cr ashes b y R epor ting Type
Figure 3.2 - Reported crashes from MN DPS accident reports, reported hospital visits3 and reported
3.4 Interpretation and Assumptions
While accident reports are the most reliable source of bicyclist-motorist crash information, the data are used with caution. By the time accident reports are entered in the Public Works crash database the recounting of events has gone through many layers of interpretation and the probability of inaccuracy may be high.
After a crash, victims may be severely injured and unable to recount details to the officer. They may also be trying to avoid fault, insurance claims or ticketing. Witnesses may also provide conflicting information. The data passes another layer of interpretation when the officer compiles information for the accident report. Crashes are complex events and reducing the situation to codes is a difficult task.
These caveats are not intended to discredit accident reports as a viable source of information. However, with any data source there are limitations to its use. The primary assumption with this analysis is that accident reports are accurate. While the precise details of every crash may deviate from the sequence of actual events, the overall findings in this report are consistent with anecdotal evidence, knowledge of bicyclist traffic volumes, turning movements, intersection geometry and the varying nature of Minneapolis streets and neighborhoods.
3.5 What is Not Captured in the Data
A number of attributes are not collected on accident reports or analyzed as part of this research.
Bicyclist position prior to the crash - While some reports describe the bicyclist’s riding position in detail, reporting is not consistent and the
information is not recorded by Public Works. For this report, Public Works examined 800 accident reports from 2006-2008 for bicyclist position. The results of that specific analysis are discussed briefly in this report.
Driveway, alley and mid-block crashes - Crashes occurring at driveway entrances, alleys or mid-block locations are included in this dataset, although the location information is aggregated to the closest intersection and may not reflect the actual location of the crash. Data is also not available for crashes occurring on private property such as a store parking lot. Only crashes occurring in the public right-of-way are recorded.
Bicyclist and motorist demographics - Gender and home address are collected on crash reports, although Public Works does not record the
information. Bicyclist age was collected beginning in 2009.
Helmet Use - While some crash reports include bicyclist helmet use, reporting is not consistent and is not recorded by Public Works.
Specific bicyclist crash types - At this time, Public Works does not record specific bicycle crash types such as right hooks, left hooks or “dooring.” However, an effort was made to estimate the prevalence of these crash types and is discussed in Chapter 5. Other local agencies - This analysis primarily used accident reports supplied by the Minneapolis Police Department and Minneapolis Park Police. Data from other local agencies such as the U of M Police or Metro Transit Police are not consistently reported to Public Works.
3.6 Notes About Terminology
The terms “accident” and “crash” are both used in this report, although not interchangeably. In the discussion of traffic safety, “crash” is becoming the accepted term when describing a collision. According to the National Highway Traffic Safety Administration, “Continued use of the word accident promotes the concept that these events are outside of human influence or control.”1
To reinforce the fact that a traffic collision is a preventable event, “crash” is used throughout this report. However, “accident” is the term currently used by the Minnesota Department of Public Safety on their official accident reports. In this report, “accident” is only used when referring to Minnesota DPS accident reports.
1 Amsden, Michael and Thomas Huber. Bicycle Crash Analysis for Wisconsin using a Crash Typing Tool (PBCAT) and Geographic Information System (GIS). Wisconsin Department of Transportation. June 30, 2006.
4.1 Approach
To yield patterns of statistical and spatial significance, planning was done to determine an appropriate sample size of bicyclist-motorist crash records. When evaluating safety projects, a three-year before and after period is often used for motor vehicle crashes. This is a logical approach, as a substantial number of motor vehicle crashes occur each year in even small communities. In Minneapolis alone, there are an average of 6,700 total crashes each year - most of which involve only motor vehicles.
Comparably, there are only an average of 270 bicycle related crashes annually in Minneapolis. Due to the relatively small number of crashes, a longer time period was desired for this analysis, especially with respect to mapping. In Minneapolis, there are 7,361 roadway intersections. If a sample from one, two or even three years was used, numeric results may prove useful. However, using that same sample, it would be difficult to illustrate many spatial patterns across the template of the city’s street grid.
Motivation for a larger time period was also selected to avoid the possibility of false readings. A San Francisco study on corridor level analysis of bicyclist and pedestrian crashes found that, “Basing decisions on individual intersections and single years is of limited efficacy and will yield substantial numbers of...false positives and false negatives.”1 In Appendix F, the maps of crashes by year highlight this dilemma (see p. F-34-44). The same study recommends a three year period as it, “provides a good balance between reducing statistical variation and accounting for changes in the intersections over time.” Although, it is noted that five years is better for intersections with a relatively low number of crashes.
Public Works selected a sample period of 10 years because little was understood about local bicyclist safety and there was a desire to gain a broad understanding of crashes in Minneapolis. However, because many corridors and intersections have changed over the 10-year period, changes that may influence the results are noted.
1 Ragland, David, et. al. Strategies for Reducing Pedestrian and Bicyclist Injury at the Corridor Level. UC Berkeley Safe Transportation Research & Education Center. July 2011.
4.2 Methodology
As outlined in Chapter 3, Public Works records select crash attributes from DPS accident reports in a crash database. The primary attributes available for each crash are:
Context, Environment and Injury Severity
• Date
• Time
• Intersection
• Distance from Intersection
• Weather
• Road Surface
• Circumstance (Hit-and-Run)
• Injury Severity
Bicyclist Information
• Bicyclist Contributing Factor
• Bicyclist Pre-Crash Maneuver
• Bicyclist Condition
• Bicyclist Date of Birth (2009-2010 only)
Motorist Information
• Motorist Contributing Factor
• Motorist Pre-Crash Maneuver
• Motorist Condition
• Motorist Vehicle Type
These attributes are available for all years between 2000 and 2010, except for bicyclist date of birth. Public Works began recording bicyclist and pedestrian date of birth in 2009. A full list of DPS codes can be found in Appendix B.
Summary data is presented for each of these attributes. In some cases multiple attributes are combined to bring increased understanding to crashes. However, caution was used when bifurcating the data. Even with a sample size of nearly 3,000 crashes, layering more than two attributes yielded results of little significance.
Chapter 5 - Results
5.1 Overview
The analysis of 2,973 bicyclist-motorist crashes found that crashes are complex events and there is no one factor that is contributing to crashes. That said, three primary conclusions emerge from the data:
1. Most crashes are occurring at intersections along major arterials.
2. Motorists are not seeing or yielding to bicyclists.
3. Bicyclists are not riding in a predictable manner.
This chapter provides support for these conclusions and highlights other prevalent crash attributes.
Topics presented in this chapter are: Background
• When crashes occur (Section 5.2)
• Environmental conditions (5.3)
• Motorist vehicle type (5.4)
• Bicyclist age (5.5)
• Rider and driver condition (5.6)
• Crash circumstances (5.7)
Causes of Crashes
• Contributing Factors (5.8)
• What is causing crashes? (5.9)
• Specific crash types and other crash
attributes (5.10) Injuries and Costs
• Injuries (5.11)
• Fatalities (5.12)
• The cost of crashes (5.13)
Where Crashes are Occurring
• Top crash corridors (5.14)
• Top crash intersections (5.14)
• Safety in numbers (5.14) Lake of the Isles Cedar Lake Lake Nokomis Lake Hiawatha Lake Calhoun Lake Harriet M i s s i s s i p p i R i v e r
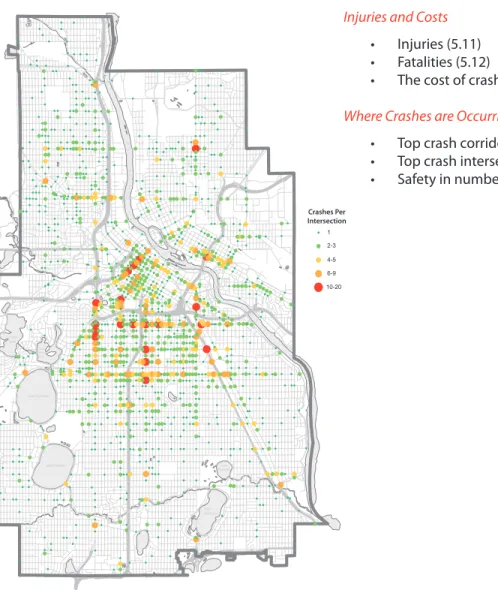
Figure 5.1 - Citywide bicyclist-motorist crash density, 2000-2010
Crashes Per Intersection 1 2-3 4-5 6-9 10-20
5.2 When Crashes Occur
By Year
Between 2000 and 2010, there were an average of 270 bicyclist-motorist crashes per year. The peak occurred in 2007 with 326 crashes and the low was in 2002 with 232 crashes. Annual crashes are generally down from the 1990’s. From 1993-1999 there were an average of 320 crashes per year.
By Month
Crashes by month adhere closely to local climate conditions in Minnesota and bicycle traffic patterns in Minneapolis. Crashes are least prevalent in the winter, increase in the spring, peak in the summer and decrease in the autumn. Less than one percent of annual crashes occur in January, while over 15 percent occur in July. Mild weather months from April-October account for 87 percent of annual crashes.
By Day
Crashes are more prevalent on weekdays than weekends. The most common day is Tuesday with 17 percent of crashes and the lowest is Sunday with nine percent. The lowest weekday is Monday with 14 percent.
By Time of Day
Most crashes occur during the afternoon peak period between 3:00-6:00 p.m. Crashes increase steadily throughout the day, peak in the late afternoon and drop off into the evening. The lowest period of crashes is from 3:00-6:00 a.m. These patterns adhere closely to bicyclist traffic patterns and traffic patterns for all modes in Minneapolis. However, the morning peak is underrepresented and the evening and late night hours are overrepresented compared to city-wide bicycle traffic.
0 50 100 150 200 250 300 350 2010 2009 2008 2007 2006 2005 2004 2003 2002 2001 2000 Cr ashes Average = 270
Figure 5.2.1 - Crashes by year, 2000-2010
0 5% 10% 15% 20% 20 40 60 80 100 Dec Nov Oct Sep Aug Jul Jun May Apr Mar Feb Jan Per cen tage of C rashes Temper atur e (˚F)
Monthly bicycle traffic on Midtown Greenway Average monthly high temperature
Figure 5.2.2 Percentage of crashes, bicyclist traffic and average high temperature by month. Source: Minnesota Climatology Working Group
5% 10% 15% 20% Sat Fri Thur Wed Tues Mon Sun Per cen tage of C rashes
Figure 5.2.3 - Percentage of crashes by day of the week
5% 10% 15% 20% 25% 30% 9pm-12am 6pm-9pm 3pm-6pm 12pm-3pm 9am-12pm 6am-9am 3am-6am 12am-3am
Bicyclist traffic based on citywide traffic model
Per
cen
tage of C
rashes
Figure 5.2.4 - Percentage of crashes and bicyclist traffic by time of day
5.3 Environmental Conditions
Weather
Weather conditions at the time of crashes were generally favorable. Conditions were clear 72 percent of the time and cloudy 22 percent of the time. It was raining for five percent of crashes and snowing for less than one percent of crashes.
Road Surface
The road surface at the time of crashes was generally favorable. Conditions were dry 89 percent of the time and wet eight percent of time. Snow, slush or ice were present for 1.3 percent of crashes.
Light
Conditions tended to be light during the time of crashes. About 73 percent of crashes occurred when there was natural daylight and 27 percent occurred when it was dark. Crash time was analyzed with sunrise and sunset times between 2000 -2010. Light conditions were not adjusted for cloud cover, rain or other factors. Street light information is listed on accident reports, but is not recorded in the Public Works crash database.
5.4 Motorist Vehicle Type
Most motor vehicles were automobiles - ninety-three percent were either a car, small van, pick up truck or SUV. All other vehicle types each accounted for less than two percent of crashes. There were 43 trucks, 41 taxis, 40 buses, 18 emergency vehicles, nine motorcycles and three limousines. Other vehicles, non-bicyclists pairings and pedestrians round out the total. Note that Public Works only records details for the primary two vehicles, so the pedestrian crashes may be related to crashes involving more than two vehicles.
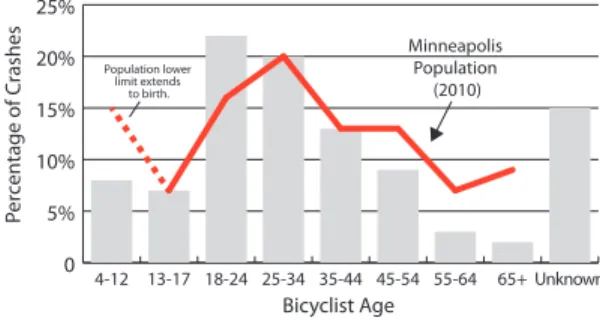
5.5 Bicyclist Age
Public Works started recording bicyclist age in 2009. Age is not currently recorded for motorists. Bicyclists age 18-24 is the most prevalent cohort and is the only cohort that is overrepresented when compared to the overall population of Minneapolis.
Elementary-aged youth1 and adults aged 45 or older are
underrepresented when compared to the population as a whole.
1 Analysis of bicyclist crashes near schools was originally desired as part of this report. However, the limited sample size from 2009-2010 did not yield noticeable patterns related to school locations. In fact, more youth crashes occurred on weekends or during the summer months than during the during the school week.
5% 10% 15% 20% 25% Fog/Smoke/ Smog Sleet/ Hail Snow Unknown/ Other Rain Cloudy
Conditions were clear for 72% of crashes
Per
cen
tage of C
rashes
Figure 5.3.1 - Percentage of crashes by weather conditions
2% 4% 6% 8% 10% Not-Applicable Debris Ice/Packed Snow Snow/ Slush Unknown/ Other Wet
The road surface was dry for 89% of crashes
Per
cen
tage of C
rashes
Figure 5.3.2 - Percentage of crashes by road surface
0.3% 0.6% 0.9% 1.2% 1.5% Unkno wn/ Other Not-A pplicable Limo Pedestr ian Motor cycle Emer genc y Bus Taxi Truck
93% of crashes involved automobiles
Per
cen
tage of C
rashes
Figure 5.4 - Percentage of crashes by motorist vehicle type
0 5% 10% 15% 20% 25% Unknown 65+ 55-64 45-54 35-44 25-34 18-24 13-17 4-12 Per cen tage of C rashes Bicyclist Age Minneapolis Population (2010) Population lower limit extends to birth.
Figure 5.5 - Percentage of crashes by bicyclist age, 2009-2010 only and Minneapolis population by age. Source: 2010 American Community Survey.
5.6 Rider and Driver Condition
Bicyclist Condition
Bicyclists had a normal condition in 83 percent of crashes. Condition was unknown for 10 percent of crashes. Bicyclists were impaired (under the influence, had been drinking or drug use) six percent of the time and five bicyclists, or 0.2 percent of bicyclists were aggressive.
Motorist Condition
Motorists had a normal condition in 77 percent of crashes. Condition was unknown for 21 percent of crashes and coincides with most hit-and-runs (see Section 5.7 below). Motorists were impaired (under the influence, had been drinking or drug use) 1.2 percent of the time and five motorists, or 0.2 percent of motorists were aggressive.
5.7 Crash Circumstances (Hit-and-Runs)
Crash circumstances document hit-and-runs and police chases. Twenty-one percent of bicyclist-motorist crashes are hit-and-runs. Three of the 2,973 crashes involved a police chase. While high, bicycle-related hit-and-run crashes in Minneapolis are actually underrepresented compared to all crashes. Of all traffic crashes in Minneapolis from 2000-2010, 41.3 percent of crashes were hit-and-run crashes. Removing crashes involving parked vehicles or fixed objects, hit-and-runs still account for 29.7 percent of all crashes.
While bicycle-related hit-and-run crashes are underrepresented, bicyclists are disproportionately the victims of hit-and-run crashes. Detailed analysis of 800 accident reports from 2006-2008 found that of bicycle-related hit-and-run crashes, motorists fled 92.8 percent of the time and bicyclists fled 7.2 percent.
Factors associated with fleeing the scene of a crash are not listed on accident reports and the MPD limits investigations of hit-and-runs to crashes involving severe or fatal injuries. However, research
of pedestrian-motorist hit-and-run crashes at
the national level found that alcohol use and an invalid license are among the leading driver factors
associated with hit-and-runs.1 Identified hit-and-run
drivers are also more likely to have had a previous arrest for driving while intoxicated.2 While
pedestrian-motorist crashes differ from bicyclist-motorist crashes,
the research offers possible explanations for the high percentage of fleeing motorists.
5.8 Contributing Factors
As outlined in Chapter 3, a crash is a complex event and determining fault is difficult. Fault is not explicitly assigned on accident reports, although analysis of contributing factors can help provide useful information.
Of the 2,973 crashes, there were 52 cases in which both vehicles were assigned “No Clear Factor” or “Unknown or Other.” Removing these crashes from the sample, we find that bicyclist and motorist contributing factors are about equally represented. In 59.0 percent of crashes, bicyclists had contributing factors. Motorists had contributing factors in 63.9 percent of crashes. These totals exceed 100 percent as both the bicyclist and motorist had contributing factors in some instances.
1 MacLeod, Kara E. et. al., “Factors Associated with Hit-and-Run Pedestrian Fatalities and Driver Identification.” Accident Analysis and Prevention. 45 (2012)
2 Solnick, Sara J. & David Hemenway. “Hit the Bottle and Run: The Role of Alcohol in Hit-an-Run Pedestrian Fatalities.” Journal of Studies of Alcohol. November 1994.
20% 40% 60% 80% 100% Motorist Bicyclist Per cen t of C rashes 59.0% 63.9%
Figure 5.8 - Contributing factors by bicyclists and motorists. These totals exceed 100 percent as both the bicyclist and motorist had contributing factors in some instances. Motorist Fled (92.8%) All Bicyclist-Motorist Crashes Bicyclist-Motorist Hit & Run Crashes Bicyclist
Fled (7.2%) Hit-and-Runs
(21.7%)
Figure 5.7 - Percentage of bicyclist-motorist crashes by hit-and-run (left) and percentage of hit-and-run crashes by fleeing unit (right).
5.9 What is Causing Crashes?
Using this data set, contributing factors and pre-crash maneuvers are the best indicators of the cause of a crash. This section outlines the top contributing factors and pre-crash maneuvers for both bicyclists and motorists.
Bicyclist Factors
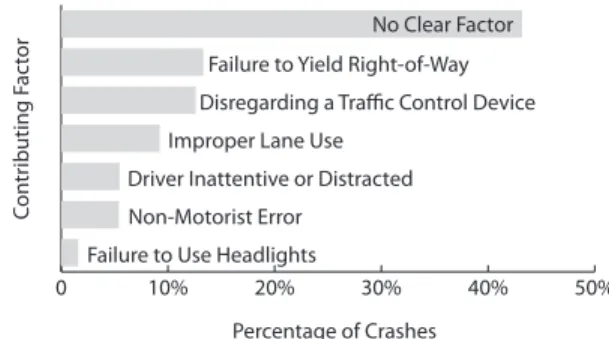
Bicyclists had no clear factor in 43 percent of crashes. The next five most prevalent bicyclist contributing factors were failure to yield right-of-way (13 percent), disregarding a traffic control device (13 percent), improper lane use (nine percent), driver (bicyclist) inattentive or distracted (five percent) and non-motorist error (five percent). Non-non-motorist error is a catch all term for non-motorist (bicyclist and pedestrian) errors. All other factors occurred in less than two percent of crashes.
Motorist Factors
Motorists had no clear factor in 38 percent of crashes. The next five most prevalent motorist contributing factors were failure to yield right-of-way (32 percent), driver inattentive or distracted (nine percent), improper lane use (five percent), disregarding a traffic control device (five percent), vision obstructed by other factors (two percent). All other factors occurred in less than two percent of crashes. Bicyclist Pre-Crash Maneuvers
Bicyclist pre-crash maneuver document the actions of a bicyclist just prior to the collision. The top five pre-crash maneuvers are bicyclist riding across roadway (46 percent), bicyclist riding with traffic (30 percent), bicyclist riding against traffic (15 percent), bicyclist making left turn (three percent), bicyclist slowing, stopping or starting (two percent). Motorist Pre-Crash Maneuvers
Motorist pre-crash maneuver document the actions of a motorist just prior to the collision. The top five pre-crash maneuvers are vehicle following roadway (42 percent), vehicle making left turn (19 percent), vehicle making right turn (16 percent), vehicle starting in traffic (seven percent) and vehicle making right turn on red (five percent).
0 10% 20% 30% 40% 50%
Failure to Use Headlights Non-Motorist Error
Driver Inattentive or Distracted Improper Lane Use
Disregarding a Traffic Control Device Failure to Yield Right-of-Way
No Clear Factor Con tr ibuting F ac tor Percentage of Crashes
Figure 5.9.1 - Top bicyclist contributing factors
0 10% 20% 30% 40% 50%
Other Human Factors
Vision Obstructed by Other Factors Disregarding a Traffic Control Device
Improper Lane Use
Driver Inattentive or Distracted Failure to Yield Right-of-Way
No Clear Factor Con tr ibuting F ac tor Percentage of Crashes
Figure 5.9.2 - Top motorist contributing factors
0 10% 20% 30% 40% 50%
Bicyclist Making Right Turn
Bicyclist Slowing, Stopping or Starting in Traffic Bicyclist Making Left Turn
Bicyclist Riding Against Traffic Bicyclist Riding With Traffic
Bicyclist Riding Across Roadway
Pr e-Cr ash M aneuv er Percentage of Crashes
Figure 5.9.3 - Top bicyclist pre-crash maneuvers
0 10% 20% 30% 40% 50%
Vehicle Parked Legally
Vehicle Making Right Turn on Red Vehicle Starting in Traffic
Vehicle Making Right Turn Vehicle Making Left Turn Vehicle Following Roadway
Pr e-Cr ash M aneuv er Percentage of Crashes
5.10 Specific Crash Types and Other Crash Attributes
Motorist Failure to Yield Right-of-Way While Turning While contributing factors and pre-crash maneuvers provide understanding of what is causing crashes, combining the two attributes can bring further specificity to crash events. A greater level of detail is especially useful for unspecific contributing factors such as failure to yield right-of-way.
Failure to yield right-of-way is the most prevalent contributing factor among motorists, accounting for 32 percent of crashes. In 38 percent of motorist failure to yield crashes, or 12 percent of all bicyclist-motorist crashes, the bicyclist-motorist failed to yield right-of-way while making a left turn. In 22 percent of motorist failure to yield cases, or seven percent of all bicyclist-motorist crashes, the motorist failed to yield while making a right turn.
case b Motorist failure to yield right-of-way while making a left turn
Combining contributing factors with pre-crash maneuvers can provide a greater understanding of crash events.
However, even with increased detail, many attributes remain uncertain. In this case, the large number of possible bicyclist pre-crash maneuvers highlight the issue.
12% of crashes 7% of crashes Motorist failure to yield right-of-way while making a right turn Typical “Right Hook” Motorist turning right Motorist turning left Motorist turning right case c Motorist turning left Bicyclist riding across roadway Bicyclist riding with traffic Bicyclist riding with traffic Bicyclist riding across roadway Typical “Left Hook” case a STOP STOP STOP STOP
Figure 5.10.1 - Example cases of motorists failing to yield right-of-way while turning.
While the task of combining motorist attributes can yield greater understanding, it can still leave many details unknown. Below, Figure 5.11.1 illustrates four examples of this challenge. In each case, motorists are failing to yield while making turns. This is a simple event to depict, as a turning motorist is a straightforward maneuver.
However, what were the actions of the bicyclist? Using the case in the upper right, a typical “right hook” crash would involve a bicyclist riding with traffic in the roadway ( case a). However, a bicyclist could have also been riding with traffic, but on the sidewalk ( case b or c ). With little knowledge about sidewalk riding, we cannot say for sure. This issue is repeated in other examples below, and likely includes many other scenarios not shown here.
Disregarding a Traffic Control Device
Disregarding a traffic control device was a prevalent contributing factor for both bicyclists and motorists. Bicyclists disregarded a signal in 13 percent of crashes and motorists in five percent of crashes. When a bicyclist disregards a traffic control device, it is a traffic signal 74.5 percent of the time. In the remainder of cases it is a stop sign or other device. When a motorist disregards a traffic control device it is a traffic signal 67.8 percent of the time. In the remainder of cases it is a stop sign or other device. Bicyclist Failure to Use Headlight
Bicyclist failure to use a headlight was cited as a primary contributing factor in 1.6 percent of all crashes. Isolating unique crashes occurring when it was dark, raining or snowing, bicyclist failure to use a headlight was a primary contributing factor in 5.8 percent of crashes. Motorist failed to use headlights in less than 0.1 percent of all crashes.
Dooring
“Dooring” is a colloquial term describing a crash where a motorist opens a door of a parked vehicle into the path of the bicyclist. There is currently no DPS code that explicitly labels a crash as “dooring.” However, pre-crash maneuvers and contributing factors can provide an estimate for the number of dooring cases. In 2.7 percent of crashes the motorist had their vehicle legally parked. In two out of three of these cases, the driver was inattentive or distracted or cited for other human factors. Most crashes with these attributes occur along primary arterials with parking on both sides of the streets. Based on this combination of factors it can be presumed that many of these crashes are cases of dooring. Detailed analysis of 800 crash reports from 2006-2008 found that dooring occurred in 2.3 percent of crashes, so this assumption may be accurate.
Sidewalk Riding and Bicyclist Position
Bicyclist pre-crash maneuver position is not
consistently collected on accident reports, although the riding position is often noted in the crash narrative or diagram. Detailed analysis of 800 crash reports from 2006-2008 found that 33 percent of crashes involved a bicyclist entering traffic from the sidewalk or path. While sidewalk riding itself is not a contributing factor, decreased visibility for both bicyclists and motorists makes this attribute noteworthy and a consideration for further research.
P
?
Disregarding a traffic control device
Bicyclist failure to use headlights 1.6% of all crashes 5.8% of crashes at night, raining, snowing “Dooring”
Analysis based on parked motor vehicle + inatttentive or distracted motorist or motorist other human factors. Bicyclist riding on sidewalk Examples based on common cases listed on DPS accident reports - specific results are not yet tabulated.
When disregarding a traffic control device, both bicyclists and motorists tend to run traffic signals, rather than stop signs or other devices. Bicycles are vehicles and are legally required to use headlights at night. STOP Motorist disregarding a traffic control device
(5% of crashes)
Motorist opening car door into path of bicyclist (estimated 2.7% of crashes) Bicyclist disregarding
a traffic control device (12% of crashes)
Motorist entering traffic from alley
Motorist turning into driveway Bicyclist entering traffic from sidewalk
Figure 5.10.2 - Other specific bicyclist-motorist crash types and attributes
cases involved hit-and-runs, so no first-hand party was present to provide information.
Due to the small sample, it is difficult to draw definitive conclusions about fatal crashes. However, all crashes had at least one of the following three characteristics:
• Large motor vehicle, or
• Rain or wet pavement, or
• Motorist had been drinking or was
aggressive
The two bicyclist fatalities that occurred in 2011 followed these trends (truck and aggressive motorist). While inclement weather and aggressive motorists are circumstances of little control, there is a large potential surrounding the education drivers of large vehicles, as most are professional drivers of trucks or buses. These opportunities are discussed in Chapter 6.
5.11 Injury Severity
Public Works records the most severe injury listed on accident reports. Injuries are categorized as Type A, B or C and are listed in decreasing order of severity:
• Type A: incapacitating injury
• Type B: non-incapacitating injury
• Type C: possible injury (victim complains of
pain or discomfort)
Eighty-seven percent of bicyclist-motorist crashes result in some level of injury. Sixty percent of crashes resulted in Type C injuries, 23 percent Type B and four percent Type A. For 13 percent of crashes, the injury was unknown or other. Detailed analysis of 800 crash reports from 2006-2008 found that when an injury was sustained, it was always the bicyclist. Motorists sustained injuries in no crashes.
5.12 Fatalities
There were 12 bicyclist fatalities from 2000-2010, or an average of 1.1 bicyclist fatalities per year. There were no fatalities in 2001, 2004 and 2005, while three occurred in 2008. Fatal crashes are prevalent throughout the year, although they are concentrated in warm weather months. All crashes occurred on a weekday and are most prevalent in the morning peak period and during the midday. Two crashes occurred when it was dark.
Of the 12 fatal crashes, contributing factors and pre-crash maneuvers are representative of all pre-crashes. However, because the bicyclist was killed, the bicyclist could not recount any information. Only the motorist and available witnesses were present. Two
Figure 5.12.2 - Characteristics of fatal bicyclist-motorist crashes, 2000-2011
*Hit & Run
** Involved a motorized bicycle
Figure 5.12.1 - A ghost bike memorial at the site of a fatal crash on 15th Ave SE.
Year Location Motor Large
Vehicle Rain or Wet Pavement Motorist Impaired or Aggressive
2000 12th St N & W Linden Ave X X
2002 3rd St NE & Lowry Ave NE X
2003 52nd Ave N & James Ave N X
2006 University Av SE & Washington Av SE X
2007 W Lake St & Dean Pkwy S X
Broadway St NE & Quincy St NE* X X
2008
Washington Av N & Dowling Av N X X
W Excelsior Blvd & W 32nd St* X
5th St S & Nicollet Mall X X
2009 14th St E & Park Av S X
2010 Monroe St NE & 15th Ave NE** X
1st Ave N & 5th St N X
2011 15th Ave SE & 4th St SE X
5.13 The Cost of Crashes
The cost of crashes is difficult to calculate and applying a monetary value to a severe or fatal event can be a sensitive assignment. Nonetheless, both
the State of Minnesota1 and the Federal Highway
Administration2 have developed estimates to
determine the economic impact of crashes. The dollar figures support cost-benefit estimates which can be used to analyze and prioritize the cost of safety countermeasures. For example, an agency may be able to justify transportation improvements or actions if improvements would be expected to correct specific crash types.
Using these costs estimates, a Type C injury ranges from $12,400 to $44,900 and a fatal injury ranges from $1,290,000 to $4,008,900. From 2000-2010 bicyclist-motorist crashes in Minneapolis had an estimated cost between $63.7 and $320.0 million, or $5.8 to $29.1 million per year.
1 Minnesota Department of Public Safety. Minnesota Motor Vehicle Crash Facts 2010. 2011. www.dps.mn.gov
2 Federal Highway Administration. Pedestrian and Bicyclist Traffic Control Device Evaluation Methods. Publication No. FHWA-HRT-11-035. U.S. Department of Transportation. May 2011.
Figure 5.12.4 - From 2000-2010 the cost of bicyclist-motorists crashes is estimated to be between $63.7 to $320.0 million.
Figure 5.12.3 Estimate Cost of Bicyclist-Motorist Crashes, 2000-2010
In Minneapolis Injury
Severity MN DPS Total Cost FHWA Human Capital Cost FHWA Social Cost Number of Crashes Cost Estimate (millions)
Fatal $1,290,000 $1,245,600 $4,008,900 12 $15.5 - 63.1 Type-A $67,800 $111,400 $216,000 122 $8.3 - 39.9 Type-B $21,900 $41,900 $79,000 671 $14.7 - 81.1 Type-C $12,400 $28,400 $44,900 1,781 $22.1 - 130.5 None $8,200 $6,400 $7,400 387 $3.2 - 5.3 Total 2,973 $63.7 - 320.0
bicyclist-motorist crashes are occurring at or near intersections. Forty-one percent of crashes occur at intersections, 40 percent occur within 50 feet and less than 19 percent occur at distances greater than 50 feet. For reference a standard city block is 250 feet wide by 600 feet long.
Top Crash Intersections
The most prevalent locations for crashes are along the city’s busiest streets. Primary arterials have seen the highest numbers of crashes compared to residential streets. Four of the top ten crash intersections are located on Franklin Avenue.
5.14 Where Crashes are Occurring
Bicyclist-motorist crashes are occurring in all parts of the city, although crashes are most prevalent in downtown, South and Southeast Minneapolis. There is also a clear concentration along major arterials. To simplify the discussion and illustration of the results, crash locations are aggregated to the closest intersection. This is a good assumption as most
Figure 5.14.2 - Top Bicyclist-Motorists Crash Intersections, 2000-2010
Intersection Crashes 1 E Franklin Ave - Cedar Ave S 20 2 Hennepin Ave S - 7th St N 19 3 Hennepin Ave S - 3rd St N 17 4 Hiawatha Ave S - E 26th St 17 5 W Franklin Ave - Nicollet Ave S 17 6 W Franklin Ave - Lyndale Ave S 16 7 University Ave SE - I-35W NB Ramp 14 8 Portland Ave S - E 28th St 14 9 Lyndale Ave S - W Vineland Place 14 10 E Franklin Ave - Chicago Ave S 13
Lake of the Isles Cedar Lake Lake Nokomis Lake Hiawatha Lake Calhoun Lake Harriet M i s s i s s i p p i R i v e r
Figure 5.14.1 - Citywide bicyclist-motorist crash density, 2000-2010
Crashes Per Intersection 1 2-3 4-5 6-9 10-20
Corridor Crashes and Crash Rates
Examining the map on the previous page, it is clear to see that crashes are concentrated along major arterials, although this pattern is not exclusive to bicyclist crashes. For this research, 28 corridors were selected for further analysis. Corridors were based on the number of crashes and the significance of the street for bicyclists.
Of the 28 corridors analyzed, those with the highest number of crashes from 2000-2010 were East-West Lake Street (226 crashes), East-West Franklin Avenue (205), Portland Avenue South (127), Hennepin Avenue South in Downtown (126) and Lyndale Avenue South (111). Note that some crashes are duplicated across corridors because of intersecting streets.
While the number of crashes is a good indicator for safety, crash rate provides an alternative perspective. Developing crash rates provides context and allows
for better comparison across corridors of varying magnitude. For example, a corridor with 1,000 bicyclists per day has a higher exposure index than a corridor with only 100 bicyclists per day. Crash rates were developed using bicycle traffic counts conducted by Public Works. A map of Minneapolis bicycle traffic can be found in Appendix E and a complete explanation of the crash rate model used is provided in Appendix F. Crash rates are expressed as crashes per million bicycle miles traveled (BMT). The corridors with the highest crash rates from 2000-2010 are East-West 28th Street (68.5 crashes per million BMT), Lowry Avenue North-Northeast (55.4), Marquette Avenue South (39.5), East-West 26th Street (39.2) and West Broadway-Broadway Street Northeast (39.1). Detailed analysis of all 28 corridors is supplied in Appendix H. Lake of the Isles Cedar Lake Lake Nokomis Lake Hiawatha Lake Calhoun Lake Harriet M i s s i s s i p p i R i v e r
Figure 5.14.3 - Top 28 bicyclist-motorist crash corridors by number of crashes (left) and crash rate (right), 2000-2010
Lake of the Isles Cedar Lake Lake Nokomis Lake Hiawatha Lake Calhoun Lake Harriet M i s s i s s i p p i R i v e r
Top Bicyclist-Motorist Crash
Corridors by Number of Crashes Top Bicyclist-Motorist Crash Corridors by Crash Rate
100 - 226 30.0 - 68.5
Number of Crashes Crash Rate*
*Crash rate is expressed as crashes per one million bicycle miles traveled (BMT)
50 - 99 15 - 29.9
Concentrations of Crash Attributes
Just as crashes can be mapped, crash attributes can, too. Knowing where prevalent contributing factors and pre-crash maneuvers are occurring can pinpoint needs and inform appropriate enforcement, education and engineering countermeasures. While many attributes do not have any specific geographical concentrations, several do. The maps to the right show two examples: the top intersections for bicyclists disregarding a traffic control device (left) and the top locations where motorists failed to yield the right-of-way while making a right turn (right). Maps of nearly all crash attributes mentioned in this chapter can be found in Appendix F.
Safety in Numbers
As discussed in Chapter 2, recent increases in bicycle traffic have exhibited a safety in numbers phenomenon. Counter to intuition, a motorist is less likely to collide with a bicyclist when there are more people bicycling. Safety in numbers has been shown over time at a city-wide level, but it also holds true across localized corridors in Minneapolis.
In developing the corridor crash rates on the previous page, a slight, but noticeable trend
emerged. While speculative, it appears that corridors with more bicycle traffic tend to have lower crash rates. Streets like Hennepin Avenue in downtown and University Avenue Southeast have lower crash rates than streets like Lowry Avenue North-Northeast or East-West 28th Street. The presence of a bicycle
facility along a corridor also appears to be a factor of safety. Below, Figure 5.14.5 illustrates this promising trend.
The results are especially encouraging because it may be a sign that motorists are coming to expect bicyclists on certain streets. Passing a bicyclist on the street is more and more a normal event rather than a rare occurrence. While engineering, enforcement and education should support a safe environment, bicycle traffic itself is playing a large role in making streets safe.
Figure 5.14.4 - Examples of mapped crash attributes. Top intersections for bicyclist disregarding a traffic control device (left) and top locations for motorists failure to yield right-of-way while making a right turn (right).
0 100 200 300 400 500 600 700 800 900 1,000 1,100 1,200 1,300 1,400 1,500 1,600 0 10 20 30 40 50 60 70 80
Daily Bicyclist Traffic
Cr
ash R
at
e (cr
ashes per million BM
T) From 2000-2010: Hennepin Ave S (downtown) University Ave SE E-W 28th St
Lowry Ave N-NE Most of the corridor did Most of the corridor did have a bicycle facility.not have a bicycle facility.
Logorithmic Trend Line (R2 = .56)
6.1 Summary of Findings
To summarize the data presented in the previous chapter,
• Crashes are most prevalent in the summer
months, on weekdays and in the afternoon peak period.
• Crash weather conditions are generally clear
and dry and occur in daylight.
• One out of five crashes involves a
hit-and-run - bicyclists are disproportionately the victims.
• Bicyclists and motorists are generally not
impaired at the time of crashes.
• Bicyclists and motorists appear to be equally
contributing to crashes.
• Motorists are often inattentive or are
distracted at the time of crashes, or are failing to yield the right-of-way to bicyclists.
• Bicyclists are often failing to the yield
right-of-way, disregarding traffic control devices and riding against traffic.
• Bicyclists sustain injuries in most crashes. No
motorists appear to have sustained injuries.
• The circumstances of bicyclist fatalities
adhere to a clear pattern involving large motor vehicles, inclement weather or aggressive or impaired motorists.
• Most crashes are occurring at or near
roadway intersections.
• There is a clear concentration of crashes
along major arterials.
• There is an apparent safety in numbers –
crash rates tend to be lower on streets with more bicycle traffic.
Reducing these findings further, three primary conclusions emerge:
1. Most crashes are occurring at intersections along major arterials,
2. Motorists are not seeing or yielding to bicyclists and
3. Bicyclists are not riding in a predictable manner.
6.2 Approaching Bicyclist Safety
These three conclusions help simplify the complex nature of crashes. However, translating the findings into effective countermeasures is the next task. While posed with good intentions, the discussion of countermeasures can quickly become detailed
and itemized: Which intersections should be improved
first? How should bicyclists be educated? How should motorists be educated? How can the police be involved? Before moving forward, a framework for
implementation should be established and a clear understanding of who the countermeasures are intend for is needed. Safety is an evolving goal and it may be better to front load the discussion with high-level considerations, rather than specific countermeasures. The approaches to bicyclist safety discussed in this section revolve around two ideas: 1) The Six E’s of Bicycling and 2) The Four Types of Transportation Cyclists.
Six E’s of Bicycling
In order to support a great bicycling community, the League of American Bicyclists recommends a balanced approach of the following six categories:
• Equity, • Engineering, • Enforcement, • Education, • Encouragement and • Evaluation
Known as the Six E’s of Bicycling1, this straightforward approach is becoming the norm in cities across the U.S. and was used as a framework for the 2011 Minneapolis Bicycle Master Plan. While originally intended as a checklist for increasing bicycling, it can easily be applied to decreasing crashes. Developing a set of countermeasures to increase bicyclist safety should use the Six E’s approach.
Four Types of Transportation Cyclists
The Portland Bureau of Transportation developed a demographic spectrum known as the Four Types
1 League of American Bicyclists. Cyclist’s Equity Statement. www.bikeleague.org