Opportunity Explorer: Navigating Large Databases Using Knowledge Discovery Templates
Tej Anand & Gary Kahn A. C. Nielsen
2201 Waukegan Road, Suite S-200 Bannockburn 1L 60015
[email protected] [email protected] Introduction
In July 1991 A. C. Nielsen released Nielsen SpotlightTM the first product with an embedded knowledge-based system for explaining the data in large point-of-sale databases. Spotlight [1, 2] is a software system that
extracts from very large databases meaningful information about exceptional events, explanations for these events and correlations among events. It then presents the user with a series of formatted hard-copy reports. To
generate these reports the system uses a pre-defined knowledge base, a context set up by the user and a pre-defined format for the reports. Spotlight reports highlight products and markets with exceptional change in
share, reasons for the share change, and trends across various product segments. These reports provide the user with a comprehensive answer to the question "What is happening in the market=place and why?"
Spotlight filled a need in the market place for an efficient, batch, top-line report generation system. Earlier attempts to address this need by systems such as CoverStory [3] were not as widely accepted. Spotlight was innovative in its use of an expert system shell which allowed for deployment of knowledge bases on end-user computers, a distributed approach to knowledge discovery and the notion of an abstract markup language [2]. Spotlight has been successfully used by sales representatives and brand managers of major consumer packaged goods manufacturers to obtain a top-level look at the state of their business. A large number of organizations have rolled the product out to their entire sales force who use the system to prepare themselves before calling on buyers in retail organizations. Smaller organizations tend to use Spotlight as a headquarters t0ol. Sales analysts prepare reports using Spotlight and then send them out to sales representatives in the field.
There were three technical limitations with the Spotlight product:
1. It represented an instance of an application for knowledge discovery and did not put in place tools or an architecture that could be used to develop other knowledge discovery applications.
2. The reports created for the user were not interactive. Thus the user had to manually navigate through the information created, and the system did not lead the user towards seeking either related or more granular information.
3. All the parameters that could be used to customize the reports had to be known a priori. For example, it was not possible for the user to create a completely new table.
One of the reasons for the success of Spotlight was that it used simple tracking measure such as "Volume ~,
"PriceN, and "Distribution" to explain in a language easily understood by the sales representatives the reasons for change in share. However, the use of simple tracking measures alone was also a limitation because it prevented the user from more sophisticated analyses such as identifying selling strategies.
In this paper we describe the Nielsen Opportunity ExplorerTM product that was released to the market-place in
March, 1993. Opportunity Explorer generates interactive reports using knowledge discovery templates, converting a large space of data into concise, inter-linked information frames. Each information frame addresses specific business issues, and leads the user to seek related information by means of dynamically created hypedinks.
AAAI-93 Knowledge Discovery in Databases Workshop 1993 ~,, Page 45 From: AAAI Technical Report WS-93-02. Compilation copyright © 1993, AAAI (www.aaai.org). All rights reserved.
In terms of domain knowledge Opportunity Explorer in addition to the tracking measures used in Spotlight, also makes use of several modeled measures that help the user quantify the impact of promotions and thus identify selling strategies. Opportunity Explorer information frames provide the user with a comprehensive answer to the question "What is happening in the market-place, why, and how the share of a product can be
changed?"
Opportunity Explorer has led to the articulation of a coherent architecture for developing knowledge discovery applications with a large number of reusable libraries with standardized functionalities and simple
well-understood application programming interfaces (APIs). Opportunity Explorer does not allow the user to create completely new reports but it has made substantial progress towards that goal by creating high-level output objects and abstract queries to specify information frames. A developer defines a knowledge discovery template by specifying instances of these output objects and abstract queries. This has made it relatively easy for developers with programming experience to define new instances of knowledge discovery applications. In this paper we first describe the notion of information frames and components of the architecture for delivering information frames to the user. We then describe the mechanics of generating information frames from knowledge discovery templates, The paper ends with a discussion of work in progress.
Information Frames
With the availability of graphical tools and client-server databases it has become possible for users to browse and query data from large databases irrespective of where they are located, either on remote data servers, LAHs or local workstations. However, the user needs to have in-depth knowledge of the semantic content of the
database to relate th~ data to the task that is to be completed. An information frame, on the other hand, provides a user with direct access to the semantic contents of the database relating the data to the users’ task. The information frame is a concise packaging of analyzed data that directly provides an answer to a specific business issue. In this sense, a knowledge discovery application has the following properties:
it is a series of information frames each addressing a specific business issue
it consists of navigational tools that link the information frames in the manner that represents a model or workflow of the task the user is involved in T
it allows the user to perform standard operations on an information frame which are independent of the information content
An information frame is an abstract concept consisting of a number of textual, tabular, and graphical views. The standard operations on an information frame include the following:
1. Display an alternate view, i.e. display either the tabular or graphical views from an active textual view
2. Print the current active view
3. Create or view related information frames using hyperlinks
The Opportunity Explorer application consists of information frames that help the sales representative of a consumer packaged goods company sell more product, more profitably to the retailer. This is accomplished by preparing a presentation that highlights the advantages for the retailer ffthe retailer stocks additional products or participates in additional promotions.
A sales representative sells to the retailer products belonging to various product categories such as Coffee, Carbonated Beverages, Detergents, etc. As a first step, he needs to determine how his products are performing in each product category. The "Cross Category Analysis" information frame in Opportunity Explorer highlights for the sales representative the contribution each category is making towards the total business in a particular retailer.
Nielsen Advisor Opportunity Explorer - [Category Road Map:text 1]
Standart
ca~ge~ ~,d ~ Operafi(
Cembimd Or~’q~e Juice - Florida Morni~ - Schnuck’s - St. Louls Dollars
13 Weeks ~ September 5,1992
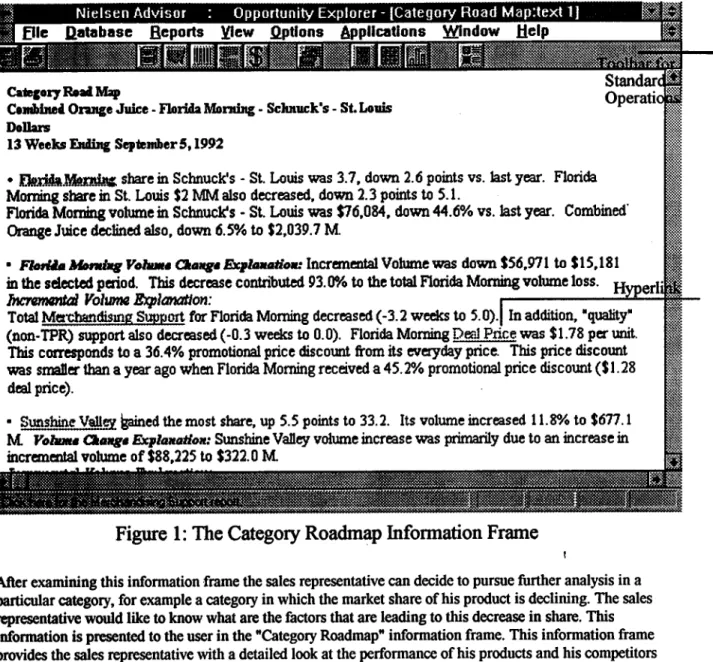
¯ ~O.XJ~.~ share in Schnuck’s - St. Louis was 3.7, down 2.6 points vs. last year. Florida Morning share in St. Louis $2 MM also decreased, down 2.3 points to 5. I.
Florida Morning volume in Selmuck’s - St. LOUIs was $76,084, down 44.6% vs. last year. Combined" Orange Juice declined also, down 6.5% to $2,039.7 M.
¯ ~ ~ Vo/wN Otaggd EzFlaaah’oa: Incremmtal Volume was down $56,971 to $15,181
in the sdected period. TI~ decrease contributed 93.0% to the total Florida Morning volume loss. H~erli
lacr~ Volur~ ~pim~’lon: [
Total M~r~mdismg Support for Florida Morning decreased (-3.2 weeks to 5.0).6 In addition, "quality" (nan-TPR) support also decreased (-0.3 weeks to 0.O). Florida Momiag D~J Price was $1.78 per unit. This corresponds to a 36.4% promotional price discount from its everyday price. This price discount was smaller than a year ago when Florida Morning received a 45.2% promotional price discount ($1.28
deal price).
¯ Sunshine V¢li~ ~ained the most share, up 5.5 points to 33.2. Its volume increased 11.8% to $677. I
M Volm~, t~taugJ F.xplautloa: Sunshine VaUey volume increase was primarily due to an increase in incremental volume of $88,225 to $322.0 M
.q v~- ¯..
Figure 1: The Category Roadmap
Information Frame
l
After examining this information frame the sales representative can decide to pursue further analysis in a particular category, for example a category in which the market share of his product is declining. The sales representative would like to know what are the factors that are leading to this decrease in share. This information is presented to the user in the "Category Roadmap" information frame. This information frame provides the sales representative with a detailed look at the performance of his products and his competitors including explanations in terms of merchandising, pricing & distribution factors. Each factor that constitutes an explanation, contains a hyperlink to an information frame that provides further details about that factor. The Category Roadmap also contains hyperlinks whereby the user can "drill down" to seek more granular
information about a product. For example, a brand might consist of three sizes, instead of looking at aggregated data for a brand the user might want to look at data for the individual sizes that constitute that brand. Taken together these frames help the user in understanding what is happening in the market place.
This understanding helps the sales representative seek frames that recommend specific actions the user could suggest to the retailer in terms of alternative merchandising promotions or in terms of distributing new products. For example, the system might determine that if the retailer where to take a week of promotion away from product "A" and instead promote product "B" (which is the product the sales representative is trying to sell) additional profits could accrue to the retailer and the sales representative would increase the share of his product.
By printing selected views the sales representative can create a presentation for the retailer. In this manner the information frames within Opportunity Explorer map the data in large point of sale databases to the task a sales representative has.
Figure I depicts the text view of a Category Roadmap information frame for a fictitious product & its competitors in the Combined Orange Juice product category.
Generating Information Frames
Figure 2 provides a conceptual framework for the development of knowledge discovery applications such as Opportunity Explorer. There are three major components of this architecture:
1. Database Access Methodology: This component provides the application access to data in a database independent manner, i.e. it hides from the application the location of the database (remote server, LAN or local workstation) as well as the type and structure of the database. The application should use the data access methodology to take advantage of any inherent structure in the database, for example product and market hierarchies, query optimization, and built-in functions for ranking, sorting, aggregating, and performing mathematical computations.
Opportunity Explorer used the Nielsen WorkstationTM [4], a product developed at Nielsen for ad hoc data retrieval. The Nielsen Workstation is used as the database access methodology across all current and planned knowledge discovery applications at Nielsen. In addition to providing the features of a database access methodology mentioned above, the Nielsen Workstation automatically distributes the computation with the remote server, if the remote server supports local computations, it also allows for the application to query data from multiple databases.
Nielsen Workstation
Database Access Methodology
Knowledge-Based Module Abstract Query Processor
Expert System Analyses Information Frame Generator
~
Knowledge Discovery T Template ~___ User Interface Selection l Navigation P--~~ntation 2.Figure 2: Architecture for generating information frames
The User Interface: This component consists of 3 modules. The Selection module helps the user in defining a context for the analysis. The user defines domain dependent terms that will guide the generation of information frames. For example, in order to generate the Category Roadmap shown in Figure 1, the user needs to define domain dependent terms such as the target product (the product that the sales representative wants to analyze), the target market (the retailer in which the
.
sales representative is interested), the share-basts (definition of the product category), competitors (a method for selecting the products that are considered competitors of the target product), etc. The presentation module consists of a set of viewers for text, tables and graphs. These viewers support variable fonts, specialized scrolling, and all the standard operations [see Figure 1]. The navigation module provides a user the capability to view or create information frames that are related to the active information frame. This can be done either by means of hyperlinks on the active information frame or by means of a list maintained by the system of the information frames that have been created, The navigation module interprets the hyperlinks that are embedded in the contents of the frame.
The user-interface has been developed as a set of generic class libraries that can be re-used by other applications such as Opportunity Explorer.
Knowledge-Based Module: This component has the functionality for creating information frames, based on the context supplied by the user (from the selection module), and the information frame definition provided by the knowledge discovery template. The knowledge discovery template consists of three sections: abstract data queries, analyses to be performed, and specifications of output objects to be displayed in the information frame. The abstract data queries in conjunction with the user selections drive the Abstract Query processor to extract data needed for generating the information frame. This module typically has application specific functionality encoded in it and has to be developed for every application.
The information frame generator has generic knowledge about the processing of conditional objects, such as bullets, paragraphs, tables and graphs. We refer to these objects as conditional objects, because the system checks for pre.-conditions such as the existence of certain types of data, or the existence of certain types of analytic results before generating the object. Conditions can be attached to output objects in the knowledge discovery template. This module includes a library of output objects, conditions, and a vocabulary which can be extended for other applications. Knowledge Discovery Templates
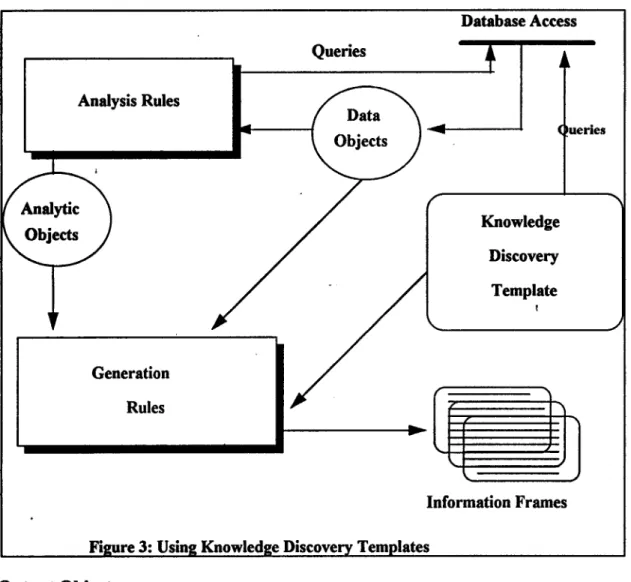
A knowledge discovery template Specifies the information content that will be present in the information frame. To generate this information the system needs to know what data is available, what analyses can be performed or needs to be performed, and the format for presenting the information. The knowledge discovery template is a text file created by the developer. It is loaded at runtime and interpreted by the rule sets within the knowledge-based module. There are three sections within a knowledge discovery template. Figure 3 shows how a
knowledge discovery template can be used to generate information frames. Rules interpret keywords in queries to extract data from the database. These are asserted as facts, the analysis rules forward-chain on these facts to create analytic objects which are application specific. A keyword based vocabulary is used within the
knowledge discovery template that specifies how the data objects and analytic objects are to be used within bullets, paragraphs, tables and graphs.
Abstract Queries
These are instances of queries that use domain concepts to extract data. For example for the Category Roadmap information frame shown in Figure 1, we need to extract causal data relating to change in share for all competitors. This constitutes an abstract query. The system will use the definition of competitors and causal as specified by the user to extract the data. For example, competitors could be defined as products that make up 80% of the total product category volume in the market. Similarly, causal could be defined as in-store trade promotion activities, distribution, and pricing. Thus an abstract query such as "fetch causal data for all competitors in the target market" will be contained in the knowledge discovery template that specifies the Category Roadmap information frame. When the user requests this information frame the data will be automatically retrieved by the system.
Types of Analyses
The knowledge discovery template gives the user the ability to specify types of analyses to be
performed. For example, Opportunity Explorer includes a causal model for change in volume based on trade promotions, pricing and distribution factors. This model is interpreted using rules, but need not be used in all information frames. The knowledge discovery template specifies whether this analysis should be used or not. For the Category Roadmap shown in Figure I the knowledge discovery template will specify a causal model in terms of cause & effect relationships, for example when distribution increases the volume of the product increases. After the data has been retrieved by the system the rules interpret the causal relationships and determine explanations for the change in volume. Opportunity Explorer also includes rules for determining opportunities for a product in a market, and determine the leading and declining products for various measures.
Analysis Rules Generation Rules Queries
/.
Database Access ueries Knowledge Discovery Template Information FramesFigure 3: Using Knowledge Discovery Templates
Output Objects
Within a knowledge discovery template output objects such as bullets, tables and graphs are specified
depending on the nature of the information the frame is trying to present. A bullet is composed of sentences, a sentence is composed of phrases and phrases are made up individual words. Similarly, a table is made up of rows, rows are made up of columns, and columns are made up of individual words. Graphs consist of data groups, data groups consist of elements and elements consist of words. Columns have additional attributes such as width, justification, etc. Graphs have graph types such as bar, pie, etc. associated with them. Depending
on the graph type the viewer interprets the data groups. Output objects are conditional, i.e. depending on the result of a specific analysis a different graph type could be selected.
For example the knowledge discovery template for the Category Roadmap shown in Figure I will contain the specification of a bullet for the target product volume change explanations. This bullet will only be generated if the system has been able to find an explanation for the change in volume of the target product. This bullet will be specified in terms of sentences that describe various factors that might constitute an explanation.
Discussion
This paper represents a statement of work in progress. While Spotlight was the first instance of ideas concerning knowledge discovery, Opportunity Explorer is the first realization of ideas concerning an
architecture for knowledge discovery. This is an evolving architecture in that it will grow to incorporate new developments in the areas of object-oriented design, database management systems, and multimedia. It also needs to incorporate analysis models that are based on statistical regression, and others that reason from cases. The analysis models that are included depend exclusively on the task an application is assisting with.
Opportunity Explorer was released to the market place in March, 1993 and early indications are that it will meet with tremendous acceptance from the customer-base.
Acknowledgments
A project with a scope as wide as Opportunity Explorer could never have been completed without the creative participation of all members of the joint marketing and development team. We would like to specifically acknowledge the tremendous contributions of Mark Ahrens, Glenn Hicks, Tony Rochon, Paul Terry, Patrick A~Arello and Joe Cannon in the conception and development of all the ideas embodied in this paper.
References
1. Anand, T. and Kahn, GI 1992. SPOTLIGHT: A Data-Explanation System. In Proceedings of the Eighth IEEE Conference on AI for Applications, 2-8. Washington, D.C.: IEEE Computer Society.
2. Anand, T. and Kalm, G. 1992. Making Sense ofGigabytes: A System for Knowledge-Based Market Analysis. In Innovative Applications of Artificial Intelligence 4, 57-69. Menlo Park, Calif." AAAI Press. 3. Schmitz, J., Armstrong, G. and Little, J. D. C. 1990. CoverStory - Automated News Finding in Marketing.
In DSS Transactions, Linda Volino (Ed.), 46-54. Providence, R+I." The Institute of Management Sciences 4. Nielsen Inf~act Workstation Reference Guide. 1993. A. C. Nielsen, Northbrook, Illinois.