What Can Crash Data Tell Us
About Older Drivers in North Dakota?
Kimberly Vachal Research Faculty Donald Malchose Research Associate
Rural Transportation Safety and Security Center at the Upper Great Plains Transportation Institute North Dakota State University
Fargo, ND
North Dakota State University does not discriminate on the basis of race, color, national origin, religion, sex, disability, age, Vietnam Era Veteran's status, sexual orientation, marital status, or public assistance status. Direct inquiries to the Vice President of Equity, Diversity, and Global Outreach, 205 Old Main, Fargo, N.D., (701) 231-7708.
Disclaimer
This research was supported by the North Dakota Department of Transportation and Federal Highway Administration. The contents presented in this report are the sole responsibility of the Upper Great Plains Transportation Institute and the authors.
ABSTRACT
Older drivers are a growing segment in North Dakota’s driver population. The natural aging process brings about diminished visual, cognitive, and physical skills needed for driving tasks. Crash record analysis was conducted to highlight elements that may be used to reduce risk for older drivers. Results show that older drivers are at relatively high risk for crash involvement and injury considering incidence ratios and travel exposure. Crash propensity, based on quasi-induced exposure measures, shows older drivers are also more likely to be at fault in these crashes. Among drivers 70 years and older, a significant increasing trend is found for driver error along with a confounding declining trend in driver evasive maneuver in crashes. The risk to other drivers is also a concern, since older driver crashes are nearly twice as likely to involve multiple vehicles. The ability to navigate these more complex driving scenarios, such as intersections and left turns, becomes increasingly problematic moving across older driver age groups. Older drivers require special consideration given their growing presence and crash injury propensity. Findings here may used in vetting a combination of education, engineering, policy, and enforcement measures that can be used to reduce older driver risk for crash injury and death both in terms of crash involvement and injury severity.
TABLE OF CONTENTS
1. Introduction ... 1
2. Background ... 3
3. Data and Methods ... 5
4. Diagnostics ... 7
4.1 Older vs. Control Group ... 7
4.2 Crash Involvement ... 7
4.3 Crash Time ... 11
4.4 Crash Location and Severity ... 13
4.5 Driver and Event Characteristics ... 14
4.6 Road-Related Elements ... 16
4.7 Crash Responsibility ... 18
4.8 Older Driver Groups ... 19
5. Exposure Analysis ... 25
6. Summary ... 27
7. Discussion ... 29
LIST OF FIGURES
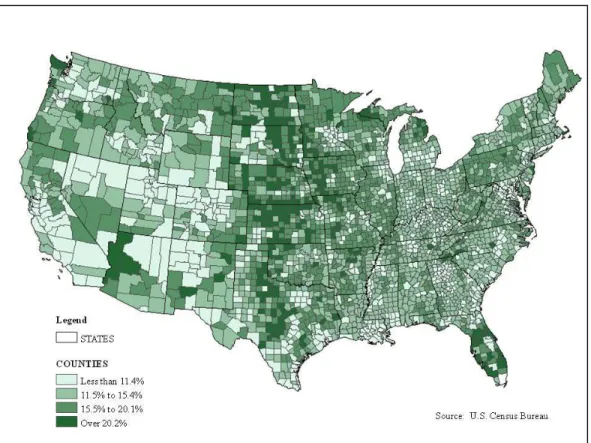
Figure 1.1 Share of County Population 65 Years or Older ... 1
Figure 2.1 Luminance Needs, by Age ... 4
Figure 4.1 Drivers in Police Reported Crashes, 2004 to 2008 ... 8
Figure 4.2 Passenger Vehicle Travel by Age Group ... 8
Figure 4.3 Driver Crash Involvement per 100 Million VMT, 2004 to 2008... 9
Figure 4.4 Fatal and Serious Driver Injuries per 100 MVMT, 2004 to 2008... 10
Figure 4.5 Monthly Crash Distribution, by Age Group ... 11
Figure 4.6 Daily Crash Distribution, by Age Group ... 12
Figure 4.7 Hourly Crash Distribution, by Age Group ... 13
Figure 4.8 Intersection and Left Turn Diagnostics Diagram... 18
Figure 4.9 Share of Drivers Ticketed for Moving Violation ... 21
Figure 4.10 Share of Crashes the Involve Multiple Vehicles... 22
Figure 4.11 Evasive Action Reported ... 23
Figure 5.2 Relative Risk for Driver Responsibility in Two-Vehicle Crashes ... 25
LIST OF TABLES
Table 4.1 Crash Data Summary: Diagnostics for Severity and Location ... 14
Table 4.2 Single Vehicle Crashes as Share of All Crashes, by Road Type ... 15
Table 4.3 Crash Data Summary: Diagnostics for Driver and Event ... 16
Table 4.4 Crash Data Summary: Diagnostics for Road-Related Elements ... 17
Table 4.5 Crash Data Summary: Older Driver Groups’ Diagnostics, Severity and Location ... 19
Table 4.6 Crash Data Summary: Older Driver Groups’ Diagnostics, Severity and Location ... 20
Table 4.7 Crash Data Summary: Older Driver Groups’ Diagnostics for Road-Related Elements ... 24
Table 5.1 RAIRs for Older Drivers for Selected Crash Conditions ... 26
1
1.
INTRODUCTION
America’s aging population is evident in that one in five citizens will be over age 65 by 2030 (U.S. Census 2006). Implications for public road safety are uncertain. Older drivers are some of the safest motor vehicle operators on the road in terms of absolute crash involvement (Williams and Shabanova 2003, Williams and Carsen 1989). Motor vehicle crashes (MVC) are, however, a leading cause of death for this group (Centers for Disease Control 2008). Understanding the degree to which crash over-involvement and physical fragility contribute to high MVC death rates is important in discussing opportunities to reduce risk. Older drivers have been shown as an over-represented population in certain MVC types, such as intersection and multiple vehicle incidents (Preusser et. al 1998, McGwin 1999, Mayhew et. al 2006, Braitman 2007). Research has also shown fragility to be a factor in the high MVC death rate for the aging population (Braver and Temple 2004, Evans 2000). As an active baby boomer generation enters this life phase, it is important to recognize a growing need to serve this group as they continue driving or take steps toward driving cessation (Dobbs 2008).
Older adults are a significant segment in North Dakota and surrounding states as illustrated in Figure (U.S. Census 2000). Nationally, the proportion of elderly was only about 12% in 2000. In comparison, the North Dakota State Data Center reported that 27 of the state’s 53 counties had more than 20% of their population base older than 64 at that point in time (2002). As with many other states, it is also a growing population segment. It is estimated that 1 in 5 of the state’s resident’s will be 70 years or older in 2030. This is double the representation of 1 in 10 in 2000. In addition, North Dakota has the highest proportion in the nation of elderly 85 years and older. Given the increasing prominence of older residents in the state, it is wise to begin actively considering their needs in road safety.
2
The North Dakota Department of Transportation (NDDOT) elevated older drivers as a traffic safety issue locally by identifying it as an emphasis area in its Strategic Highway Safety Plan (2007). Nationally, older drivers have received attention as a higher risk group based on high injury rates. The Centers for Disease Control and Prevention (CDC) reports drivers ages 80 and older have the highest crash death rates among drivers beyond their teen years (2008). Driving activities for this group continue to grow as people live longer and enjoy lifestyles that depend on personal mobility (Federal Highway Administration 2006). The goal here is to develop a better understanding of the risk exposure in terms of crash involvement and crash characteristics for the state’s most mature drivers. Problems identified through the diagnostic process can then be related to short- and long-term countermeasures to reduce older driver crash risk. Safety gains in the short run will be associated with crash reductions related to available countermeasures. Longer-term gains may be associated with new inventions and minimizing projected crash increases associated with the expected increase in the numbers of older drivers.
3
2.
BACKGROUND
Personal mobility is essential in meeting basic requirements for food and health as well as fulfilling social and self-efficacy needs associated with higher quality of life. Private automobile is the primary mode for transportation in the United States (Transportation Research Board 1999, Houser 2005). Household travel is conducted by private auto in 90% of trips for households in rural regions (Federal Highway
Administration 2004). Whether it is a trip to the doctor or to a local concert, choice is very limited for transport in the vast rural spans of the United States. It is important to recognize the value associated with personal mobility for our growing older population group. Studies have shown that transport mobility provides significant benefits for the elderly well-being in terms of psychological, physical, and social elements (Spinney et al. 2009, Oxley 2008, Morottoli 1997).
An aging population is a concern for traffic safety in that older drivers are more susceptible to serious injury. The widely dispersed and lightly populated geography of this state offers little opportunity for sustainable public transit systems to operate as profit or cost-recovery units. Less than 1/2 of 1% of North Dakota residents report using public transit for their regular work commute (U.S. Census 2004). The public transport void creates a need for a proactive study of older driver crash risk factors as it seems reasonable to expect an increasing older driver presence on the state’s roadways.
Driving is a complex task. Diminished visual, cognitive, and physical capabilities, that are part of the normal aging process, may pose challenges for drivers in identifying and reacting to signals in the driving environment. Reduced visual capabilities commonly associated with the aging process include declining acuity and field of view, along with decreased contrast sensitivity and darkness adaptability. Cognitive challenges often include less ability to process complex problems and slower reaction time. Reduced range of motion in the upper torso and less leg strength may also pose problems for older drivers in making vehicle maneuvers such as turning and braking. These capabilities have been the subject of a large research body related to topics such as engineering enhancements and license screening aimed at reducing crashes among the most mature drivers.
One example of the eye age progression that has received attention in research on older drivers is the increasing need for light (Trusty 2008). Reductions in contrast sensitivity and decreased dark adaption are due to natural physiological changes in the eye over time. Older drivers with severe contrast sensitivity are eight times more likely to have a crash history (Owsley 2001).Figure2.1 shows how much additional light more mature drivers need to achieve eye function of a 20-year old. For instance, a 72-year-old driver requires 16 times more light than a 20-year-old driver to attain a similar visual due to changes in the eye functions. This contrast sensitivity is important in functions such as navigating traffic, distinguishing roadway pavement markings, and reading reflective signs. Diminished capabilities may be especially noticeable in nighttime driving and during adverse weather conditions (Schieber 1994).
4 Figure 2.1 Luminance Needs, by Age
Diminished capacity to deal with complex cognitive and visual cognitive tasks has also been documented (Marottoli 1994). One screening test helpful in assessing this capacity is the useful field of view (UFOV). The UFOV uses a test battery to measure visual cognitive response through visual sensory function, visual processing speed, and visual attention skills. A clinical study of 294 drivers showed that crashes were more than twice as likely when the useful field of view impairment is 40% or higher (Owsley et al. 1999).
Physical agility is an imperative function in driving. Once simple maneuvers, such as braking and head-turning, can become weak and painful actions that hinder drivers in basic vehicle control (Owsley 2004). Drivers who had limited activity were 1.3 times more likely to incur citations and be involved in crashes during a one-year cohort study involving drivers older than 71 years, after controlling for demographics, driving activity levels, and other health factors (Marottoli et. al 1998 and 1994).
The wide range in older driver issues and capabilities creates a complex issue with regard to benefits and costs associated with crash-risk reduction measures. Unlike the young driver population, where
experience and risky behaviors are a central focus, older driver capabilities related to aging and medical conditions are more difficult to categorize and address through traditional education and enforcement programs. While changes in capabilities do not diminish universally with older ages in the population, it is reasonable to assume that many of these drivers experience reduced capacity in some or all of these areas. The research presented here offers insight for addressing crash risk with North Dakota’s older driver population.
5
3.
DATA AND METHODS
In this section, data sources, crash measures, and statistical methods are described. Information regarding older driver crash involvement was provided by NDDOT. Their database is a census of police-reported traffic crashes in the state. It includes data on incident, vehicle, and occupant crash elements. While these data do not provide a means for predicting crash involvement among older drivers, they do contribute to an understanding of crash involvement.
Crash records from 2004 to 2008 are used in the analysis. In addition to records for older drivers, defined here to include drives 70 years and older, a control group was established using crash records involving drivers between the ages of 35 and 54. Rather than a large population option, a high performing group was designated for comparison. Fatal crash rate curves with an age denominator show rates are high for teens, decrease through early adult years, and then begin to rise for the older ages (Stamatiadis and Deacon 1997, McGwin and Brown 1999, Evans 2000, Braver and Trempel 2004). Thus, the middle aged drivers provide an acceptable comparison group for the study.
Statistical analysis of crash records is used in a diagnostic process to distinguish crash elements associated with older driver MVC. Significant difference in driver, vehicle, environment, and roadway elements are examined using the chi-square test. The relative accident involvement ratio (RAIR) is used to assess driver performance. The RAIR is a quasi-induced exposure measure used to discuss driver fault. With this method, data are normalized through relative risk assessment by using cohort data for a group of interest from the same source (Stamatiadis and Deacon 1997, McGwin 1999, Li et al. 2003, Chandraratna and Stimatiadis 2009).
The RAIR is a ratio of at-fault drivers in the target group to the ratio of at-fault drivers in the control group, under the same parameters. The discussion here is limited to crashes involving two vehicles where one driver is determined to be responsible for the crash. The methodology for the quasi induced exposure is limited to multicar crashes and requires fault assignment for an unbiased RAIR estimation in that the non-fault population is expected to represent the larger driving population. The responsibility is assigned using a driver citation as the marker for fault. Ratios resulting in a ratio greater than 1.0 indicated higher propensity for crash involvement by the group. Confidence intervals are calculated to test for significance. The method has been applied in a wide topic scope of crash studies, such as age group, safety equipment, suspended licenses, and alcohol involvement (DeYoung et. al 1997, Stamatiadis et. al 1999, Aldridge et. al 1999, Williams and Shabanova 2003, Voas et. al 2007, Méndez and Izquierdo 2009, Rizzi et. al 2009). The RAIR is calculated as:
where A is the driver group of interest and P is the control population of drivers, with i designating at-fault and j the not at-at-fault drivers.
7
4.
DIAGNOSTICS
In labeling a driver group as higher risk, one needs to understand the nature of this risk. While teen drivers are categorized as high risk due to their excessive crash involvement, older drivers risk may be associated with fragility and excessive crash involvement that may coalesce in the crash figures. The older driver MVCs are compared, as a group, to the control group driver MVCs. Significant differences between these groups may reinforce or establish priority safety issues for older drivers. In addition, trends in MVCs within the older driver group are examined to discern general effects of the aging process that may be used to implement programs and policies that increase risk awareness and reduce MVC injury for older drivers.
4.1 Older vs. Control Group
Older drivers were involved in 7,292 MVCs between 2004 and 2008. Crash types range from no injury, which is termed property damage only (PDO), to fatal injury. The crash records distinguish injury to segment non-disabling and disabling types. Here serious injury crashes include disabling and fatal crash injury types. The older driver crashes include 172 fatal and disabling injury crashes and 1,325 crashes with non-disabling injuries. The balance is attributed to the PDO crash type. The control group was involved in 30,591 MVCs, which included 557 fatal and disabling injuries.
4.2 Crash Involvement
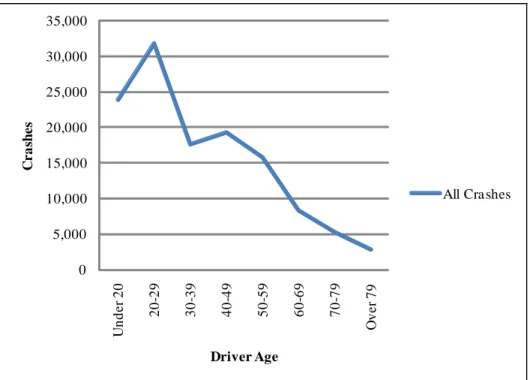
An initial step in assessing older driver MVC involvement is to better gauge if high crash injury risk is a function of crash involvement or driver fragility. Considering information on licensed drivers, the older drivers are underrepresented in a comparison of incidence rates. NDDOT reports that the state’s licensed driving population includes 59,138 older drivers and 169,693 control group drivers in 2008. The inverse relationship between age and crash involvement is evident in Figure 4.1. Previous research has shown younger drivers are more prone to crashes due to inexperience and risk-taking (McGwin 1999, Mayhew 2003, Shope and Bingham 2008). Beyond the risk reduction achieved with experience and maturity, research has shown changes in driving patterns, such as limiting winter and nighttime driving, lower exposure for older drivers (McGwin 1999).
8 0 5,000 10,000 15,000 20,000 25,000 30,000 35,000 U n d e r 2 0 2 0 -2 9 3 0 -3 9 4 0 -4 9 5 0 -5 9 6 0 -6 9 7 0 -7 9 O v e r 7 9 C r a sh e s Driver Age
All Cra shes
Figure 4.1 Drivers in Police Reported Crashes, 2004 to 2008
While licensed driver figures provide some means for gauging risk among the driver groups, a superior measure for excessive involvement would consider exposure in vehicle miles traveled or some other measure of the underlying activity. Distribution of state vehicle travel by age group was estimated using research presented on the National Personal Transportation Survey (Lyman 2002, Li 2002, Tefft 2008). Drivers ages 70 to 79 account for about 4.0% of the annual travel, compared with 26.9% for the peak driving age group of 30 to 39 year olds (Figure 4.2).
9
Using the age group travel distribution in conjunction with NDDOT vehicle mile travel figures for 2004 to 2008, excessive older driver crash involvement is found (Figure 4.3). North Dakota MVC figures exhibit the expected U-shape when crash numbers are standardized by travel and licensed driver
exposure. Total vehicle miles traveled (VMT) in North Dakota over the five-year period is estimated to be more than 38,300 billion miles. Drivers ages 35 to 54 accounted for an estimated 37.9% of VMT. Drivers 70 and older accounted for 4.0% of the VMT. Using the figures on all crashes, as well as figures on the most serious crashes, multiple incidence rates (IR) are calculated as,
for driver group i in crash type j, with A equal to the number of crashes and B the activity measure accounting for exposure.
The older driver IR is estimated at 485 crashes per 100 million VMT compared with 212 crashes per 100 million miles traveled for the control group. The endpoints on the IR curve, which reflect the IRs for the youngest and oldest driver groups, are the highest points. The oldest driver group, including those older than age 79, has the highest point at 1,968 crashes per 100 million miles traveled.
0 500 1,000 1,500 2,000 2,500 U n d e r 2 0 2 0 -2 9 3 0 -3 9 4 0 -4 9 5 0 -5 9 6 0 -6 9 7 0 -7 9 O v e r 7 9 C r a sh e s Driver Age
Drivers in Cra shes per 100 MVMT
10
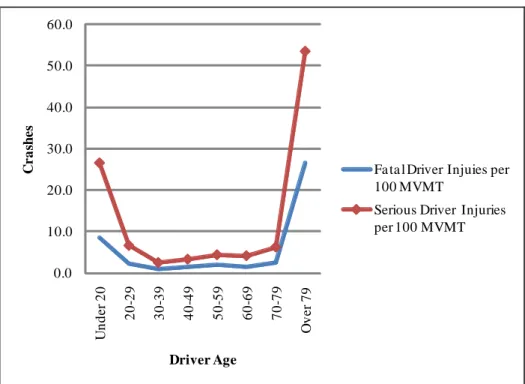
The magnitude of over-involvement in MVCs is even more impressive when looking at the most serious crashes – those including fatal and disabling injuries (Figure 4.4). In the older driver group, the fatal crash IR is estimated to be 4.6 deaths per 100 million VMT. This rate is 3 1/2 times higher than the rate
associated with the control group. The oldest driver fatal crash IR is estimated to be an alarming 26.7 per 100 million VMT. These rates compare with 1.30 for the control group, which is below the statewide rate of about 1.45 fatal crashes per 100 million miles traveled over the five years (NDDOT 2009). When disabling crashes are added to fatal crashes for a serious crash IR, the older driver fragility issues are further evident as the crash IR for older drivers rises to 10.3 compared with 3.2 per 100 million miles traveled for drivers ages 30 to 59. The highest IRs, again associated with the oldest driver group, are 26.7 and 53.4 for fatal and serious injury crashes, respectively. The over-representation of older drivers in all crashes, and especially in the most serious crashes, is concerning for the future of safe travel in the state. The following discussion of crash elements may offer some clues for addressing these concerns.
0.0 10.0 20.0 30.0 40.0 50.0 60.0 U n d e r 2 0 2 0 -2 9 3 0 -3 9 4 0 -4 9 5 0 -5 9 6 0 -6 9 7 0 -7 9 O v e r 7 9 C r a sh e s Driver Age
Fa ta l Driver Injuies per 100 MVMT
Serious Driver Injuries per 100 MVMT
Figure 4.4 Serious Driver Injuries per 100 Million VMT, Fatal and Disabling Injury Crashes 2004 to 2008
11
4.3 Crash Time
Increasing the understanding of older driver MVCs is important to road safety in North Dakota. This section provides a profile for older driver crashes – using statistical techniques to signify difference compared with the control group. Here, basic information on crash times shows that older driver crashes occur in patterns that vary significantly from the control group considering month, day, and hour. Crash incidence varies throughout the year, and does differ significantly between the groups considering the monthly crash figures (χ2
=32.87 ρ<0.001, n=37,778). Crash numbers peak in December for both groups, with the young driver group showing a stronger cycle in their crashes with the lowest share, 5.9%, occurring in April (Figure 4.5). The older driver crashes are more evenly distributed with the lowest monthly share at 7.0%, occurring in both March and April.
Figure 4.5 Monthly Crash Distribution, by Age Group
A significant difference is also found between the groups for day of the week on which the crash events take place (χ2=138.35 ρ<0.001, n=37,778). Older drivers are less likely to be involved in a crash on the
weekend when compared with the control group. Friday is the largest single-day share in crashes reported for either of the driver groups (Figure 4.6). The smallest shares of crashes take place on Sunday. Reduced driving activities on Sunday due to limited work commuting and organized social activities likely
12 Figure 4.6 Daily Crash Distribution, by Age Group
Time of day is also a factor in distinguishing crash incidence for older drivers. A significant difference in the hourly crash distributions is found (χ2
=1,825.51 ρ<0.001, n=37,778). While both driver groups experience the low crash numbers in the overnight hours from 1 a.m. to 4:59 a.m., the crash numbers peak during different times of the day (Figure 4.7). The variability in the older driver hourly crash distribution is greater than of the control group as measured by the standard deviation of 2.2% for the control group, compared with 3.4% for the older drivers based on an hourly distribution. The peak in crash numbers for the older drivers is in the interval of 10 a.m. to 2:59 p.m., considering four- and five-hour intervals for the hours between 5 a.m. and 4:59 a.m. The reported crashes show that 41.5% of incidents occur during this interval. The largest share of crashes among the control group takes place in the 3 p.m. to 7:59 p.m. interval at 34.9%. Factors contributing to these differences are likely related to exposure. Relatively more older driver activity takes place while the control group is at work, and less of older driver activity occurs during commuting times and after dark as part of self-regulation (Donorfio 2008).
13 Figure 4.7 Hourly Crash Distribution, by Age Group
4.4 Crash Location and Severity
Crash location and severity are important factors in understanding risk and in implementing programs to increase traffic safety in a more targeted fashion. A significant difference is found in the road type associated with all crashes (χ2=475.14 ρ<0.001, n=37,527). Older drivers experience relatively fewer of
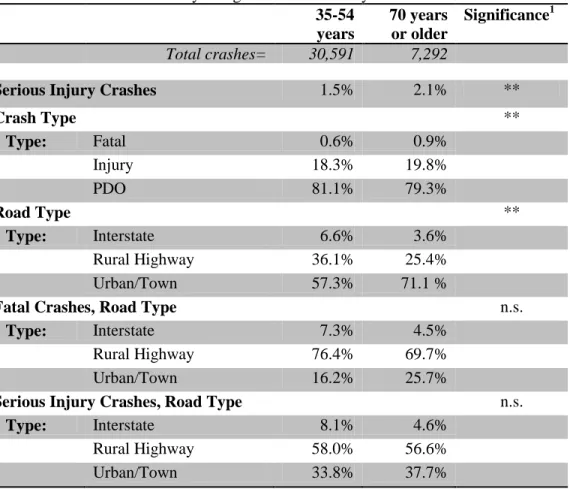
their crashes on interstates and rural highways. Crashes among older drivers occurred in towns and urban areas in 70.8% of cases compared with 57.0% for the control group. The road type associated with the most severe crashes, however, is similar for the groups (Table 4.1). A majority of fatal crashes occurred on rural highways for both groups, at 69.7% for the older drivers and 76.4% for the control group.
14
Table 4.1 Crash Data Summary: Diagnostics for Severity and Location 35-54 years 70 years or older Significance1 Total crashes= 30,591 7,292
Serious Injury Crashes 1.5% 2.1% **
Crash Type ** Type: Fatal 0.6% 0.9% Injury 18.3% 19.8% PDO 81.1% 79.3% Road Type ** Type: Interstate 6.6% 3.6% Rural Highway 36.1% 25.4% Urban/Town 57.3% 71.1 %
Fatal Crashes, Road Type n.s.
Type: Interstate 7.3% 4.5%
Rural Highway 76.4% 69.7%
Urban/Town 16.2% 25.7%
Serious Injury Crashes, Road Type n.s.
Type: Interstate 8.1% 4.6%
Rural Highway 58.0% 56.6%
Urban/Town 33.8% 37.7%
1
Chi-Square Significance: ** is <.001, n.s. is not significant.
The earlier IR information presented exposure-related information regarding crash risk. Here, chi-square tests provide additional evidence regarding injury risk for older drivers in terms of absolute crash numbers and injury type. The higher injury propensity is evident here as well. A significant difference in the crash type, which includes fatal, injury, and PDO, is found between the driver groups. Older driver crashes involved a fatal injury in 0.9% of cases, compared with 0.6% for the control group. The control group had a larger share of PDO crashes than older drivers at 81.1%, compared with 79.3%. Older drivers in crashes incurred significantly more serious injuries, which includes fatal and disabling injury types (χ2
=15.87 ρ<0.001, n=45,174). The serious injury crashes, as a share of all crashes, are 40% higher for older drivers than for the control group (Table 4.1).
4.5 Driver and Event Characteristics
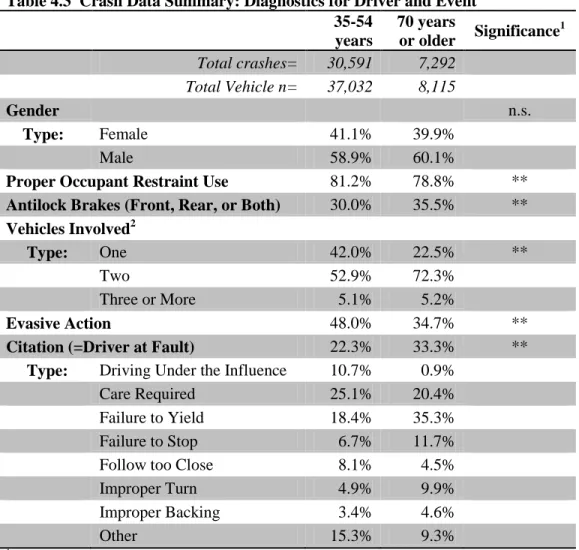
Crash characteristics of older drivers do vary significantly compared with the control group for several driver, environment, and roadway factors. A look at some driver and event factors shows older drivers are less likely to wear a seat belt and more likely to be involved in a multicar crash than the control group (Table 4.3). The driver gender in the crashes is similar with males accounting for the majority at 60% and 59%, respectively, for older and control cases.
Seat belt use is significantly lower for the older drivers at 78.8%, when compared with 81.2% for the control group. The lower use by older drivers is a deviation from nationwide use rates reported by the National Highway Transportation Safety Administration (2008). This difference may be explained, in part, by the state’s secondary enforcement law for seat belts (Morrisey and Grabowski 2004). In addition,
15
older drivers began to drive prior to mandates for seat belt installation and use in vehicles. It is not unexpected that this group would have a lower use rate since the habit was not formed in early driving experiences.
Using road type to distinguish the driving environment, older drivers were not found to have significantly different seat belt use rates than the control group on interstates and rural highways. The difference was significant for town and urban roads – 78.3% for the control group, compared with 76.0% for the older drivers. Programs such as CarFit recognize senior driver reluctance to use seat belts (American Association of Retired Persons and AAA 2010). The programs involve experts, such as occupational therapists, in working with older drivers to encourage seat belt use through instruction on driver position and proper fit.
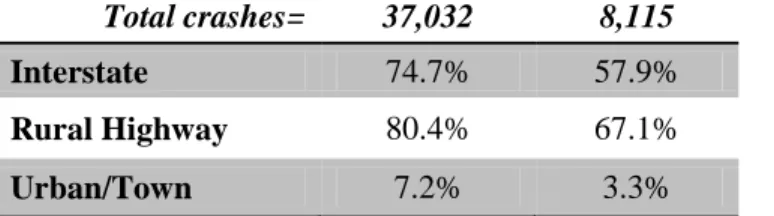
Older drivers are involved in single vehicle crashes in only 22.5% of events, compared with 42.0% for the control group. As with other crash characteristics, this may be related to exposure. This fact does,
however, heighten the safety concern in that an increase in older driver crashes would nearly double the potential exposure for other drivers’ crash risk, when compared with the control group. A significant difference in single versus multiple car crashes is found for the groups across road types (F=17565.20 ρ<0.001, n=44,878).
Table 4.2 Single Vehicle Crashes as Share of All Crashes, by Road Type
Total crashes= 37,032 8,115
Interstate 74.7% 57.9%
Rural Highway 80.4% 67.1%
Urban/Town 7.2% 3.3%
Older drivers are also in error relatively more often. They are cited in every 1 of 3 crashes, compared with 1 in 5 for the control group. The nature of the citations also differ (Table 4.3). “Failure to yield,” “failure to stop,” and “improper turn” errors are cited at higher rates for the older drivers. “More care required,” which includes “driving too fast for conditions,” is a common citation for both groups. The older drivers have a noticeably lower incidence for the “following too close” citation – a violation that law enforcement officials often associates with aggressive driving.
The higher citation rate for the older drivers may be associated with their greater share of multicar crashes. Citations were issued in only 13% of all single car crashes in the study. The citation rate was nearly triple for multiple vehicle crashes, at 30%. Older drivers were cited in only 10% of their single car crashes compared with 13% for the control group.
16
Table 4.3 Crash Data Summary: Diagnostics for Driver and Event 35-54 years 70 years or older Significance 1 Total crashes= 30,591 7,292 Total Vehicle n= 37,032 8,115 Gender n.s. Type: Female 41.1% 39.9% Male 58.9% 60.1%
Proper Occupant Restraint Use 81.2% 78.8% **
Antilock Brakes (Front, Rear, or Both) 30.0% 35.5% ** Vehicles Involved2
Type: One 42.0% 22.5% **
Two 52.9% 72.3%
Three or More 5.1% 5.2%
Evasive Action 48.0% 34.7% **
Citation (=Driver at Fault) 22.3% 33.3% **
Type: Driving Under the Influence 10.7% 0.9%
Care Required 25.1% 20.4%
Failure to Yield 18.4% 35.3%
Failure to Stop 6.7% 11.7%
Follow too Close 8.1% 4.5%
Improper Turn 4.9% 9.9%
Improper Backing 3.4% 4.6%
Other 15.3% 9.3%
1Chi-Square Significance: ** is <0.001, n.s. is not significant 2
Significance tested for single car vs. multicar (two or more cars).
4.6 Road-Related Elements
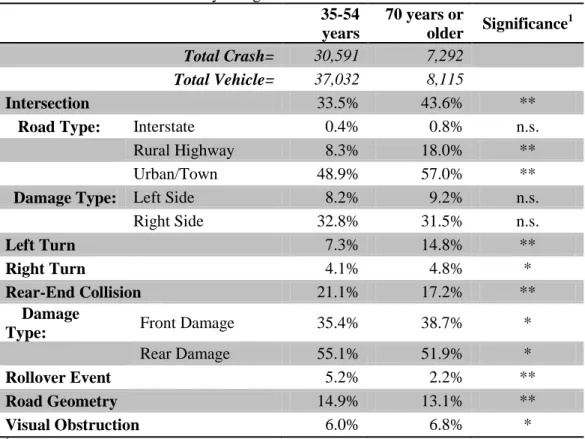
Certain crash types pose a risk for older drivers considering roadway elements. National studies show them to be at higher risk for MVCs involving intersections and left-hand turns. Intersections are the location for 45.1% of the older driver crashes, compared with 30.9% of crashes for the control group. The significant difference in this crash location element may be twofold. The aforementioned differences in exposure may be related to a higher number of intersections on urban roads, where older drivers more often travel. This premise is derived from Household Personal Travel Survey data regarding older driver trip distance that show a propensity for short trips (Federal Highway Administration 2004).
A look at intersection crashes by road type shows that, as expected, this crash type is more common on town and urban roadways for both driver groups – 57.0% of older driver crashes and 48.9% of the control group crashes (χ2=533.53 ρ<0.001, n=37,778). The share for this crash type is significantly higher for the
older drivers on these roads and rural highways. On rural highways, older driver crashes are intersection related at more than twice the rate – 18.0% of cases compared with only 8.3% for the control group. Therefore, although town and urban road exposure may explain some of the difference in intersection crash rates, driving studies that have shown intersections to be more problematic for older drivers due to
17
diminished skill— discussed in the background section—may offer additional explanation in understanding and addressing this safety issue.
Table 4.4 Crash Data Summary: Diagnostics for Road-Related Elements 35-54 years 70 years or older Significance 1 Total Crash= 30,591 7,292 Total Vehicle= 37,032 8,115 Intersection 33.5% 43.6% **
Road Type: Interstate 0.4% 0.8% n.s.
Rural Highway 8.3% 18.0% **
Urban/Town 48.9% 57.0% **
Damage Type: Left Side 8.2% 9.2% n.s.
Right Side 32.8% 31.5% n.s.
Left Turn 7.3% 14.8% **
Right Turn 4.1% 4.8% *
Rear-End Collision 21.1% 17.2% **
Damage
Type: Front Damage 35.4% 38.7% *
Rear Damage 55.1% 51.9% *
Rollover Event 5.2% 2.2% **
Road Geometry 14.9% 13.1% **
Visual Obstruction 6.0% 6.8% *
1Chi-Square Significance: ** is <0.001, * is <0.01, n.s. is not significant
The location of impact in these intersection crashes was studied for differences between the groups. Unlike results in the Pruesser et. al (1998) study on fatal crash risk at intersections, a significant difference is not found in the incidence rate for left-side damage – which is a primary driver exposure area in the vehicle – between the driver groups. Left-side vehicle damage in intersection crashes is reported in 8.2% of the control group incidents, compared with 9.2% of the older driver incidents. Consistent with previous research, crash analysis shows left turns, including intersection and non-intersection settings, to be significantly more problematic for older drivers than for the control group. Older driver crashes occurred during a left-turn maneuver in 14.8% of cases compared with only 7.3% of cases for the control group (χ2
=404.27 ρ<0.001, n=37,778). The left-turn maneuver challenges the complete driver skill set with heightened demand for visual, physical, and cognitive capabilities in navigating what often involves crossing an active oncoming traffic lane.
18 Figure 4.8 Intersection and Left Turn Diagnostics Diagram
A diagnostics diagram was constructed to better understand the issues confounding intersection and left-turn events (Figure 4.8). Event nodes are included to distinguish older and control group outcomes in terms of at-fault crashes – where the proxy is citation for a driving violation. The older driver is more likely to be involved in an intersection crash making a left-turn maneuver than the control group – 24.2%, compared with 16.2% for the control group. The older driver group is also often at fault in significantly more of these events than the control group – 61.3% of cases compared with 45.8% respectively (χ2=58.18 ρ<0.001, n=2,862). More than one-third of the violations for the older drivers are “failure to
yield.” “Care required” and “improper turn” are also common citations. These three citation types account for 70% of the violations for the group. These same citations are also the most common with the control group, accounting for 35% of the citations administered in the confounding intersection and left-turn events. The high rates of “failure to yield” and “improper turn” may lend themselves to behavioral or engineering interventions targeted to reach the older drivers. It appears benefits may also be gained in spillover to other drivers.
4.7 Crash Responsibility
Citation rates show older drivers are more likely to be at fault when involved in MVC. Citation data attached to multiple car crash records were used to identify the at-fault vehicle. Older drivers were found to be at fault in 49% more of their crashes than the control group drivers. Older drivers were cited in 33.4% of their MVC compared with 22.3% for the control group. Additional information regarding driver error developed through quasi induced exposure analysis is presented in the next section.
19
4.8 Older Driver Groups
As previously discussed, older driver capabilities and issues are wide ranging. Previous research does suggest that a general degradation of older driver abilities can be recognized, and should be addressed, within these upper age categories (Preusser et. al 1998, Li et. al 2003, Stutts et. al 2009). A discernable trend in the abilities for the older drivers grouped into five-year intervals between 70 and 84, along with the 85 years and older group, is evident in several crash report elements. A cohort group of 65- to 69-year-old drivers is included to extend the age trend for some illustrations. This group is not included in the statistical tests for the older driver groups presented in this section.
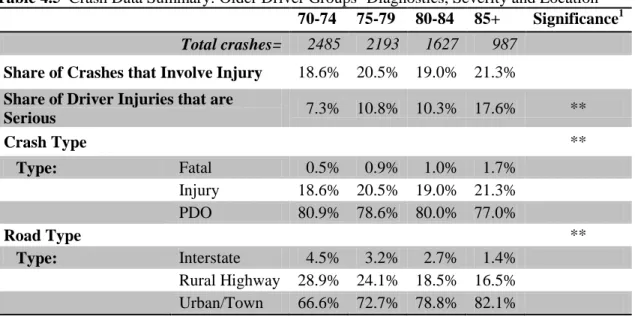
Crash severity and location among the older driver groups varies significantly across the four age groups (Table 4.5). While the share of crashes involving an injury is only 14% higher for those older than 85 years, compared with the youngest group – those 70 to 74 years, the share involving serious injury is significantly higher in the older driver groups. The share of MVC injury crashes involving a serious injury – these include fatal and disabling injury types – is about 44% higher for the 75- to 84-year-olds and 141% higher for those 85 years and older, when compared with the 70- to 74-year-olds (Table ). While injury types do provide more specification regarding severity, trends are also evident in the crash type classification among the fatal, injury, and PDO incidents. The 70- to 74-year-old drivers are involved in fatal crashes in about 0.5% of all incidents, compared with 1.7% for the oldest drivers – a 2 1/2 times greater rate.
Table 4.5 Crash Data Summary: Older Driver Groups’ Diagnostics, Severity and Location 70-74 75-79 80-84 85+ Significance1
Total crashes= 2485 2193 1627 987 Share of Crashes that Involve Injury 18.6% 20.5% 19.0% 21.3% Share of Driver Injuries that are
Serious 7.3% 10.8% 10.3% 17.6% ** Crash Type ** Type: Fatal 0.5% 0.9% 1.0% 1.7% Injury 18.6% 20.5% 19.0% 21.3% PDO 80.9% 78.6% 80.0% 77.0% Road Type ** Type: Interstate 4.5% 3.2% 2.7% 1.4% Rural Highway 28.9% 24.1% 18.5% 16.5% Urban/Town 66.6% 72.7% 78.8% 82.1% 1
Chi-Square Significance: ** is <0.001, * is <0.01, n.s. is not significant.
The road type for these crashes varies significantly among the driver groups (Table 4.5). Since crash location is related to driver exposure to road types, the common assertion that drivers travel closer to home as they age is supported in the increasing share of crashes on urban and town roads. For drivers ages 70 to 74, crashes occur on town and urban roads 67% of the time compared with about 80% for drivers older than 80. Less exposure to the higher speed roads associated with longer distance travel is shown in the injuries attributed to interstates and rural highways – with interstates and rural highways at 4.5% and 29.9% for 70- to 74 year-olds, compared with 1.4% and 16.5% for drivers ages 85 and older, respectively.
20
Crash data also support a premise that there is an increasing role for females in the driving population over time. Females drivers are attributed with 36.4% of crashes in the 70- to 74 year-old age group compared with 42.7% for drivers older than age 84. The increase may be attributed to a longer life expectancy where females outlive their male counterparts and assume a larger driving role at a later age. The increase is evidenced in the population shift which includes an increasing share of females in older age groups (Rathge 2007, ND State Data Center 2009).
The significant difference in seat belt use between the older and control groups discussed in the previous section is detailed further in Table 4.6. Seat belt use among the oldest drivers is 7% below use rates among the 70- to74-year-old drivers in crashes. The trend in this use rate is concerning given the greater crash risk associated with increasing fragility and declines associated with the aging process.
Table 4.6 Crash Data Summary: Older Driver Groups’ Diagnostics, Severity and Location 70-74 75-79 80-84 85+ Significance1 total crash n= 2485 2193 1627 987 Gender ** Type: Female 36.4% 41.3% 40.9% 42.7% Male 63.6% 58.7% 59.1% 57.3% Restraint Use 80.3% 78.9% 79.6% 73.5% ** Vehicle Type: Car 56.6% 62.3% 70.3% 73.2% Pickup 38.2% 34.4% 26.8% 23.8% Large Truck 2.1% 0.9% 1.0% 0.7% Motorcycle 0.1% 0.2% 0.0% 0.1%
Citation (=Driver at Fault)
Type: Driving Under the Influence 1.7% 0.8% 0.6% 0.0% Care Required 20.0% 21.5% 19.7% 24.1% Failure to Yield 34.0% 38.5% 36.3% 37.7% Failure to Stop 12.4% 12.7% 11.6% 11.0%
Follow too Close 6.8% 3.1% 4.5% 4.2%
Improper Turn 10.1% 9.4% 12.9% 8.8%
Improper Backing 5.6% 4.7% 4.5% 3.3%
Other 9.4% 9.3% 9.8% 10.8%
1
Chi-Square Significance: ** is <.001, * is 0.01, n.s. is not significant.
The nature of older driver crashes related to roadway features and operations is summarized in the following group of figures and tables. Driver error in crashes for failing to recognize or respond is
encompassed in the citations levied for driving violations. Figure 4.9 shows the share of older drivers who are ticketed in police reported crashes among the age groups. A significant positive correlation is found between likelihood for citation and driver age. While one in four drivers ages 65 to 69 is ticketed in their crashes, 42.6% of drivers older than age 84 are ticketed in their crashes. A noticeable increase appears as drivers move into their 80s, and it becomes even more pronounced in later years.
21 20% 25% 30% 35% 40% 45% 65-69 70-74 75-79 80-84 85+ 25.0% 27.9% 29.2% 37.4% 42.6% D ri v er S h a re C it ed i n C ra sh es Driver Age Source: NDDOT Crash Data, 2004 to 2008
Figure 4.9 Share of Drivers Ticketed for Moving Violation
Significance: 70 to 84+ Driver Groups (χ2=94.17 ρ<0.001, n=8,115)
Another consideration in older driver crashes is the exposure for other drivers. While the overall driving distance may be lower, the likelihood an MVC will involve one or more other vehicles is positively correlated with age. Figure 4.10 illustrates that a significant increase in share of MVC incidents involving multiple vehicles is found as the drivers age group increases (χ2=137.24 ρ<0.001, n=7,292). The vertical
axis scale begins near the share of MVCs reported to involve multiple vehicles in the control driver group – 42.0% (Table 4.3). Multivehicle crashes, relative to single vehicle, more than double among the older drivers in comparing the 85-year-old drivers with the control group – nearly 9 in 10 MVCs, or 86.9%, involve at least one additional vehicle.
22 40% 45% 50% 55% 60% 65% 70% 75% 80% 85% 90% 65-69 70-74 75-79 80-84 85+ 64.1% 71.1% 76.5% 80.9% 86.9% M u lt ip le C ar s I n vol ve d , S h a re o f A ll C ra sh es Driver Age Source: NDDOT Crash Data, 2004 to 2008
Figure 4.10 Share of Crashes the Involve Multiple Vehicles
Significance: 70 to 85+ Driver Groups (χ2=137.24, ρ<0.001, n=7,292)
Although specific information is not available regarding medical conditions and driver capabilities related to the aging process, the previous discussion of aging shows abilities to assess and react to driving
situations becomes increasingly impaired. A look at the evasive action item, in which the police officer reports maneuvers to prevent the crash, offers some insight. Commonly reported actions include slowing, speeding, stopping, turning, and backing up. A significant decline in evasive action is reported among the older driver groups (χ2
=100.34 ρ<0.001, n=8,113). While 70- to 74-year-olds perform some type of evasive action in 40.3% of their reported MVCs, these maneuvers are reported in only about 30% of cases where the driver is age 80 and older (Figure 4.11). An evasive maneuver is reported in 48.0% of cases for the control group.
23 25% 27% 29% 31% 33% 35% 37% 39% 41% 43% 45% 65-69 70-74 75-79 80-84 85+ 43.2% 40.3% 34.0% 30.0% 29.6% E vas ive A ct ion , S h ar e of A ll C ras h es Driver Age Source: NDDOT Crash Data, 2004 to 2008 Figure 4.11 Evasive Action Reported
Significance: 70 to 85+ Driver Groups (χ2=100.34 ρ<0.001, n=8,113)
Some road related crash elements reported are considered in Table 4.7. More complex situations such as intersections create increasing challenges for the older drivers. Risk for intersection crashes among older drivers is found to significantly increase with driver’s age (χ2
=42.99 ρ<0.001, n=7,292). While 41.0% of crashes among the 70- to 74-year-olds are intersection related, the relative share rises 28% for drivers older than age 84. The road type, such as more urban intersection exposure, is not significant in explaining differences in the risk among the age groups. The intersection crashes are more common among all these groups than for the control group at 30.9%.
The left turn also poses increasing challenges for older drivers (Table 4.7). The risk associated with left turns may be a function of factors such as scanning abilities or physical demands to make the maneuver. For drivers ages 70 to 74, 11.8% of crashes are related to a left-turn vehicle motion. This share compares with more than 16% for drivers older than age 80. Data show the greatest share of these crashes do occur at intersections. The proportion of all crashes involving a left-turn motion increases significantly with driver age (χ2
=24.44, ρ<0.001, n=8,115).
The rear-end crash type, as discussed earlier, is lower among older drivers than for the control group. The explanation for the lower share among older drivers is that they exhibit more cautious driving, such as not following too closely behind another vehicle. While the difference among the older driver group is not significant, the damage area for their cars does change significantly over time (Table 4.7). The damage area, however, is not consistent in discussing the older driver issues specifically. Rear-end crashes in which the older driver is the striker – based on front-end damage reported – is significantly higher among the oldest drivers (χ2
=23.79 ρ<0.001, n=1,431). The reverse is also true in that the relative share of 70- to 74-year-old drivers receiving rear damage as the struck vehicle, at 55.3%, is significantly higher than the shares for older driver groups, which declines to 39.8% for drivers older than age 84 (χ2
=28.53 ρ<0.001, n=1,431). These data suggest that older drivers may not be able to accurately estimate their response capabilities.
24
Factors such as visual obstruction, rollover crash-type, and hill or curve road geometry are not found to be significantly different as crash elements in understanding the older driver risk. The information presented to this point offers general insight regarding crash incidence for the control and older driver groups. In the following section, induced exposure methods are applied to measure relative risk among age groups with regard to selected crash situations.
Table 4.7 Crash Data Summary: Older Driver Groups’ Diagnostics for Road-Related Elements 70-74 75-79 80-84 85+ Significance1 Total crashes= 2,485 2,193 1,627 987 Intersection 41.0% 44.6% 47.5% 52.6% ** Interstate 0.1% 0.0% 0.0% 0.2% n.s. Rural Highway 10.9% 9.6% 8.8% 11.6% n.s. Urban/Town 89.0% 90.5% 91.2% 88.2% n.s. Visual Obstruction 6.3% 6.8% 6.4% 6.3% n.s. Rollover Event 2.5% 2.0% 2.3% 1.9% n.s.
Road Geometry (when reported)
Curve 5.4% 3.6% 3.4% 4.4% n.s.
Hill 0.7% 0.4% 0.9% 0.4% n.s
Rear-End Collision (when
reported) 18.6% 17.9% 17.2% 15.5% n.s.
Front Damage 35.7% 33.0% 46.1% 49.7% **
Rear Damage 55.3% 58.4% 43.4% 39.8% **
Intersection/Turn Type 11.8% 13.4% 16.2% 16.6% **
Left Turn Intersection 22.4% 24.1% 27.1% 23.8% n.s. Left Turn Not Intersection 4.5% 5.3% 6.8% 9.6% **
1
25
5.
EXPOSURE ANALYSIS
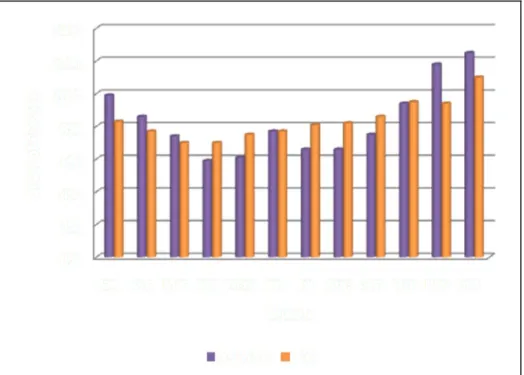
The relationship between age and driver error is evident in the RAIR calculations for all driver groups. As noted in the methods section, the crash population considered in these exposure calculations is limited to two-vehicle crashes where one driver was at fault. The relative risk is calculated by determining the share of drivers at fault under the selected crash condition, compared with the share of drivers not at fault under the same conditions. As expected, the RAIR results show the state’s youngest and oldest drivers have the greatest likelihood for responsibility in crashes among age groups (Figure 5.1). The relative risk for the oldest drivers is 207% greater than the control group. The highest ratios are for drivers age 80 and older with ratios of 2.30 and 1.72 for drivers older than ages 84 and 80 to 84, respectively. Drivers in their 70s also have a higher-than-average probability of responsibility in all types of two-vehicle crashes.
0.00 0.50 1.00 1.50 2.00 2.50 u n d e r 2 1 2 1 -3 4 * 3 5 -5 4 5 5 -6 4 6 5 -6 9 * 7 0 -7 4 7 5 -7 9 8 0 -8 4 8 5 +
Source: N DDOT Crash Data; 95% CI except for *groups; n=49,740
0.00 0.40 0.80 1.20 1.60 2.00 u n d e r 2 1 2 1 -3 4 3 5 -5 4 5 5 -6 4 6 5 -6 9 7 0 -7 4 7 5 -7 9 8 0 -8 4 8 5 +
Source: N DDOT Crash Data; 95% CI; n=26,929
Figure 5.1 Relative Risk for Driver Responsibility in Two-Vehicle Crashes
In a second population-wide graph, the driving situation is limited to intersection-type crashes to better understand relative risk for this problematic roadway setting. While the relative-risk scale for driver responsibility is not as high in this crash type, the gap between the lowest and highest risk is greater. Drivers ages 75 and older have the greatest relative risk for responsibility in this crash type. Drivers between the ages of 75 to 79 have a responsibility likelihood that is 11% greater than drivers under age 21 and 150% higher than that of 35 to 54 year olds – the control group of high performing drivers selected for this paper. The relative risk for the oldest drivers is 250% greater than the control group.
Analysis in the previous section drew attention to crash factors in the general crash population, such as time and road environment, where older drivers have a significantly different propensity for crashes compared with the control group. These earlier diagnoses are used to select conditions for additional analysis for relative risk. Table 5.1 shows RAIR measures for eight crash conditions, comparing older drivers with the control group in the crash population subset that includes two-vehicle crashes where one driver was at fault. Older drivers have consistently high risk for intersection and left-maneuver crashes. RAIRs range from 1.19 to 1.32 in intersection crashes. The highest relative risk, compared with the control group, is found in left-maneuver crashes. Risk ratios range from 1.36 for the youngest drivers – ages 65 to 69 years – to 1.83 for drivers 85 years and older. The gap within the older drivers is also large as the oldest drivers are 35% more likely to be involved in left-maneuver crashes than drivers ages 65 to 69. In comparison, drivers older than age 84 are only 15% more likely than the 65- to 69-year-old drivers to be involved in an intersection-related crash.
Older drivers have consistently lower risk, compared with the control group, for being involved in rear-end crashes. The risk for being at fault in these crashes differs. While not all rear-rear-end crashes have vehicle damage in the police report, the site of vehicle impact in these crashes is important since, in vehicles with front-end damage, 93% of the drivers were ticketed. Only 11% of drivers operating a vehicle where
26
end damage is reported received tickets. Thus, front end damage is a good proxy for identifying at-fault drivers. Drivers older than age 79 have a higher likelihood for being at fault compared with other older drivers in rear-end crashes. The 65- to 69-year-old drivers have relatively low risk for being at fault in the rear-end crashes – a risk ratio 29% lower than the control group.
Table 5.1 RAIRs for Older Drivers for Selected Crash Conditions
Condition 65-69 70-74 75-79 80-84 85+
Intersection-Related Crashes 1.11 1.32 1.31 1.19 1.28
Left-Maneuver Related Crash 1.36 1.43 1.69 1.79 1.83
Rear-End Crash Type 0.74 0.63 0.54 0.47 0.45
Front Damage in Rear-End Crash Type 0.81 1.18 0.84 1.30 1.84 Rear Damage in Rear-End Crash Type 1.29 0.88 1.15 0.68 0.49
Nighttime Crashes 0.61 0.43 0.49 0.36 0.47
Winter Crashes 0.89 0.74 0.85 0.73 0.72
Evasive Action Taken in Crash 0.92 0.76 0.60 0.51 0.63
Risk ratios have 95% confidence interval (the sole exception is the italicized value, which includes the value of 1.00).
Two environmental conditions considered in assessing relative risk for older drivers in MVCs are nighttime and winter driving. The risk for older drivers is less since the RAIRs are all under 1.0,
compared with the younger control group drivers. Unlike some of the other conditions, a declining trend is not evident in the risk measures. Less exposure as older drivers self-regulate to limit driving in less-than-ideal conditions, such as limited light or snow-covered roads, may explain these lower risk
measures. The risk of a nighttime crash is 51% to 64% lower among the driver groups older than age 69, compared with the control group. Control group drivers are 15% to 28% times more likely to be involved in a crash during winter months, including November through February, than drivers 70 and older. The final element considered among the RAIR metrics is driver action prior to the event. As noted previously, physical, visual, and cognitive decline associated with the aging process may slow driver response to road and vehicle signals. Unlike the environmental conditions, driver propensity to respond to a situation with an evasive action does decline with age. A large decline is evident in comparing
supplemental information on the 65- to 69-year-old drivers, who are only 8% less likely to respond with an evasive reaction than the control group, to the older drivers. Drivers ages 80 to 84 are 49% less likely to make a maneuver to avoid a crash than the control group. The 70- to 74-year-old drivers report evasive action 24% less frequently than the control group and 17% less often than the 65- to 69-year-olds. The increase in action likelihood from the 80- to 84-year-olds to those older than age 85 is not easily explained. It may be related to greater variation in abilities among the 80- to 84-year-olds or other element not evident in the information available here.
The analysis presented here does not offer an exhaustive view of older driver crashes. It does, however, draw on existing research to highlight potential elements for reducing older driver crash risk.
27
6.
SUMMARY
The aging process brings about natural declines in some visual, cognitive, and physical capabilities. Because driving is a complex task, it is important to recognize a growing need to address older driver safety. Findings here show older drivers in North Dakota have an increasing propensity for crash involvement and serious injury. Driving situations such as left-hand turns and intersections pose especially high-risk environments. Older drivers are more likely to be in error and less likely to take evasive action compared with the middle-age control group drivers. In addition, older drivers are less likely to a wear seat belt in town – where most of their crashes occur. Knowledge about crashes involving older drivers may help focus strategies to boost safe mobility most effectively through education,
29
7.
DISCUSSION
Several projects have highlighted practices, programs, and strategies designed to improve road safety for older drivers. The aforementioned CarFit program is just one option for older drivers. Here, occupational therapists ensure drivers are properly fitted in their vehicle and seat belt. Some programs offer additional services from occupational therapists with specialized training to perform comprehensive driver
capabilities evaluation and make recommendations to improve driver safety. Classes and materials are offered from many sources that allow older drivers to refresh or assess driving skills for road safety. Education programs can also be used to provide guidance to improve older driver self-regulation. Further analysis is needed to understand the efficacy of specific programs.
In addition, some states have taken a proactive stance in reducing older driver risk through the
administration process. One opportunity is in identifying at-risk drivers through the licensing process and in working with medical professionals to identify drivers in need of further evaluation (Stutts and Wilkins 2009). Empirical analysis of these programs is limited, but anecdotal evidence shows positive results. In terms of policies – as another opportunity—seat belt laws, especially those with primary enforcement, are found to be beneficial. Seat belt laws were the only policies found to reduce fatalities in a study of older driver safety related to state laws (Morrisey 2004). Strategic approaches are also strong in several states, such as California, Florida, Iowa, Maryland, and Michigan, and Oregon. These states have
multidisciplinary groups that may involve government, medical, academic, and social service stakeholders to focus on devising and implementing strategies to improve older driver safety
(Government Accounting Office 2007). These groups would fit the approach used in the aforementioned Strategic Highway Safety Plan.
System strategies and spot treatments have also been offered with regard to improving roadway design and operation for older drivers (Table 7.1). These range from low-cost measures such as improved signage, to higher-cost measures such as roundabouts and protected left turn lanes (Braitman 2007). Additional guidance is available in the Older Driver Highway Design Handbook, which is scheduled for update in 2011 (Federal Highway Administration). Current NDDOT efforts related to Clearview font on roadway signs for positive contrast, rumble stripes on roadway center and edge for improved delineation, and left-turn lanes for traffic separation do fit the strategies mentioned below. As with most safety strategies, spillover benefits associated from safety investments implemented to reduce risk for specific driver groups are shared by the larger driving population (Braitman 2007).
30
Table 7.1 Roadway Strategies and Treatments to Improve Older Driver Safety System Strategies
Provide advance warning signs. (T)
Provide advance-guide and street name signs. (T) Increase the size and letter height of roadway signs. (T)
Provide all-red clearance intervals at signalized intersections. (T)
Provide more protected left turn signal phases at high-volume intersections. (T) Provide offset left-turn lanes at intersections. (T)
Improve lighting at intersections, horizontal curves, and railroad grade crossings. (T) Improve roadway delineation. (T)
Replace painted channelization with raised channelization. (P) Reduce intersection skew angle. (T)
Improve traffic control at work zones. (T) Spot Treatments
Limiting the use of left-hand exits.
Providing parallel-type acceleration lanes for easier merging maneuvers.
Providing longer acceleration lanes to give older drivers a greater opportunity to merge. Replace intersections with roundabouts at appropriate candidate sites (Braitman 2007). (T): Tried, (P): Proven
Source: Adapted from Potts et. al 2004 and Braitman 2007.
An improved understanding of older driver capabilities and challenges is important to future traffic safety as this is a growing driver segment in North Dakota. A wealth of resources is available to move forward with strategies and programs to improve older driver safety. The analysis and discussion presented can be used in that effort.
31
REFERENCES
Aldridge, Meredith Himmler, Lisa Altman-Hall, and Nikiforos Stamatiadis. 1999. “Impact of Passengers on Young Driver Safety.” Transportation Research Record 1693, Transportation Research Board of the National Academies, Washington, D.C.
American Association of Retired Persons and AAA. 2010. CarFit, accessed online at American Association of Retired Persons. 2010. “The Road Ahead.” Accessed online at
aarp.thehartford.com/Downloads/Your_Road_Ahead.pdf.
Braitman, Keli, Bevan Kirley, Susan Ferguson, Neil Chaudhary. 2007. “Factors Leading to Older Drivers' Intersection Crashes.” Traffic Injury Prevention, 8(3): 267-274
Braver, Elisa R. and R.E. Trempel. 2004. “Are Older Drivers Actually at Higher Risk of Involvement in Collisions Resulting in Deaths or Non-Fatal Injuries Among Their Passengers and Other Road Users?” Injury Prevention, 10: 27-32.
Centers for Disease Control and Injury Prevention. 2007. “Older Adult Drivers: Fact Sheet, National Center for Injury Prevention and Control.” Atlanta, Georgia.
Chandraratna, Susantha and Nikiforos Stimatiadis. 2009. “Quasi-Induced Exposure Method: Evaulation of Not-At-Fault Assumption.” Accident Analysis and Prevention, 41: 308-315.
DeYoung, David, Raymond Peck, and Clifford Helander. 1997. “Estimating the Exposure and Fatal Crash Rates of Suspended/Revoked and Unlicensed Drivers in California.” Accident Analysis and Prevention, 29(1): 17-23.
Dobbs, Bonnie M. 2008. “Aging Baby Boomers—A Blessing or Challenge for Driver Licensing Authorities.” Traffic Injury Prevention, 9:379–386.
Donorfio, Laura, Maureen Mohyde, Joseph Coughlin,and Lisa D'Ambrosio. 2008. “A Qualitative Exploration of Self-Regulation Behaviors Among Older Drivers.” Journal of Aging & Social Policy, 20(3)323-339.
Eberhard, John W. 1996. “Safe Mobility for Seniors Citizens.” IATSS Research, 20(1), 1996, pp. 29–37, as referenced in Transportation in an Aging Society: A Decade of Experience, Transportation Research Board, 1999, Conference Proceedings 27, p. 146, Washington, DC.
Evans, Leonard. 2000. “Risks Older Drivers Face Themselves and Threats They Pose to Other Road Users.” International Epidemiological Association, 29:315-322.
Federal Highway Administration. 2001. Highway Design Handbook: For Older Drivers and Pedestrians. 2001. FHWA-RD-01-103, U.S. Department of Transportation, Washington, D.C.
Federal Highway Administration. 2004. Summary of Travel Trends: 2001 Household Travel Survey. U.S. Department of Transportation, Washington, D.C.
Federal Highway Administration. 2006. Older Drivers: Safety Implications. NHTS Brief, U.S. Department of Transportation. Accessed July 22, 2009 at
32
Government Accounting Office. 2007. Older Driver Safety: Knowledge Sharing Should Help States Prepare for Increase in Older Driver Population. 2007. GAO-07-413, A Report to the Special Committee on Aging. U.S. Senate, Washington, D.C.
Houser, Ari. 2005. Community Mobility Options: The Older Person's Interest. AARP Public Policy Institute. Washington, D.C., August 23, 2005.
Li, Guohua, Elisa Braver, and Li-Hui Chen. 2003. “Fragility Versus Excessive Crash Involvement as Determinants of High Death Rates per Vehicle-Mile of Travel Among Older Drivers.” Accident Analysis and Prevention, 35:227-235.
Lyman, Stephen, SA Ferguson, ER Braver, and AF Williams. 2002. “Older Driver Involvements in Police Reported Crashes and Fatal Crashes: Trends and Projections.” Injury Prevention, 8: 116-120.
Marottoli, Richard A., Leo Cooney, D. Raye Wagner, John Doucetter, and Mary E. Tinetti, 1994, Predictors of Automobile Crashes and Moving Violations among Elderly Drivers, Annuals of Internal Medicine, 121: 842-846.
Marottoli, Richard A., Carlos F. Mendes de Leon, Thomas A. Glass, Christianna S. Williams, Leo M. Cooney, Lisa Berkman, and Mary Tinetti. 1997. “Driving Cessation and Increased Depressive Symptoms: Prospective Evidence from the New Haven EPESE.” Journal of the American Geriatrics Society, 45(2): 202-206.
Mayhew, Daniel, Herbert Simpson, and Susan Ferguson. 2006. “Collisions Involving Senior Drivers: High-Risk Conditions and Locations.” Traffic Injury Prevention, 7(2): 117-124.
Mayhew, Daniel, Herbert Simpson, Anita Pak. 2003. “Changes in Collision Rates Among Novice Drivers During the First Months of Driving.” Accident Analysis and Prevention 35: 683–691.
McGwin, Gerald and David Brown. 1999. “Characteristics of Traffic Crashes Among Young, Middle-Aged, and Older Drivers.” Accident Analysis and Prevention, 31(3): 181-198.
Méndez, Álvaro Gómez and Francisco Apraicio Izquierdo. 2009. “Quasi-Induced Exposure: The Choice of Exposure Metrics, Accident Analysis and Prevention.” Article in Press, dio:
10.1016/j.app.2009.10.003.
Morrisey, Michael and David Grabowski. 2004. “State Motor Vehicle Laws and Older Drivers.” Health Economics, 14(4): 407-419.
National Highway Transportation Safety Administration. Community Mobility and Dementia. U.S. Department of Transportation, Washington, DC: 2006. Accessed March 13, 2007, at
National Highway Transportation Safety Administration. “Seat Belt Use in 2007 – Demographic Results, Traffic Safety Facts Research Note.” DOT HS 810 932, April 2008.
Rathge, Richard. 2007. “The Economic Impact of the Senior Population on a State’s Economy: The Case of North Dakota.” North Dakota State Data Center,
33
North Dakota State Data Center. Population Trends. Accessed August 12, 2009, at
North Dakota Department of Transportation. 2006. “North Dakota’s Highway Safety Plan for Federal Fiscal Year 2006.” Office of Traffic Safety. Accessed online August 22, 2006, at
Owsley, Cynthia, Karlene Ball, Gerald McGwin, Jr, Michael E. Sloane, Daniel L. Roenker, Milton F. White, E. Todd Overley. “Visual Processing Impairment and Risk of Motor Vehicle Crash Among Older Adults.” Journal of the American Medical Association, 279:1083-1088.
Oxley, Jennifer and Michelle Whelan. 2008. “It Cannot Be All about Safety: The Benefits of Prolonged Mobility.” Traffic Injury Prevention, 9:367–378.
Potts, Ingrid, Jane Stutts, Ronald Pferer, Timothy Neuman, Kevin Slack, and Kelly Hardy. 2004. “Guidance for Implementation of the AASHTO Strategic Highway Safety Plan Volume 9: A Guide for Reducing Collisions Involving Older Drivers.” NCHRP Report 500 Series, Transportation Research Board, Washington, D.C.
Preusser, David, Allan Williams, Susan Ferguson, Robert Ulmer, and Helen Weinstein. 1998. “Fatal Crash Risk for Older Drivers at Intersections” Accident Analysis and Prevention, 30(2): 151-159.
Rizzi, Matteo, Johan Strandroth, and Claes Tingvall. 2009. “The Effectiveness of Antilock Brake Systems on Motorcycles in Reducing Real-Life Crashes and Injuries.” Traffic Injury Prevention, 10: 479-487. Schieber, Frank. 1994. “Recent Developments in Vision, Aging and Driving: 1988–1994.” Report No. UMTRI-94-26,Transportation Research Institute. University of Michigan, Ann Arbor. As referenced in Transportation in an Aging Society: A Decade of Experience. Transportation Research Board. 1999. Conference Proceedings 27, p. 127, Washington, D.C.
Shope, Jean T. and Raymond Bingham. 2008. “Teen Driving Motor Vehicle Crashes and Factors That Contribute.” American Journal of Preventative Medicine, 35: S261-S271.
Spinney, Jamie E.L., Darren, Darren M. Scott, and K. Bruse Newbold. 2009. “Transport Mobility
Benefits and Quality of Life: A Time-Use Perspective of Elderly Canadians.” Transport Policy, 16: 1-11. Stamatiadis, Nikiforos, and John Deacon. 1997. “Quasi-Induced Exposure: Methodology and Insight.” Accident Analysis and Prevention, 29(1): 37-52.
Stamatiadis, Nikiforos, Samantha Jones, and Lisa Aultman-Hall. 1999. “Causal Factors for Accidents on Southeastern Low-Volume Rural Roads.” Transportation Research Record 1652. Transportation Research Board of the National Academies, Washington, D.C.
Stutts, Jane and Jean Wilkins. 2009. Driver Licensing Policies and Practices: Gearing Up for an Aging Population, AAA Foundation for Traffic Safety, Washington, D.C.
Tefft, Brian C. 2008. “Risks Older Drivers Pose to Themselves and to Other Road Users.” Journal of Safety Research, 39: 577-582.
U.S. Census Bureau. American Fact Finder. GCT-P15, Selected Age Groups: 2000. United States -- County by State, Accessed online December 10, 2009, at
34
U.S. Census Bureau. 2004. Journey to Work: 2000, U.S. Department of Commerce, Economics and Statistics Administration. Census 2000 Brief, C2KBR-33.
Williams, Allan F. and Oliver Carsten. 1989. “Driver Age and Crash Involvement, Public Health Briefs.” American Journal of Public Health, 79:326-327.
Williams, Allan F., and Veronika I. Shabanovab. 2003. “Responsibility of Drivers, by Age and Gender, for Motor-Vehicle Crash Deaths.” Journal of Safety Research 34: 527– 531