Community College Review 41(4) 271 –291 © The Author(s) 2013 Reprints and permissions: sagepub.com/journalsPermissions.nav
DOI: 10.1177/0091552113503709 crw.sagepub.com Article
Improving Student Outcomes
via Comprehensive Supports:
Three-Year Outcomes From
CUNY’s Accelerated Study in
Associate Programs (ASAP)
Zineta Kolenovic
1, Donna Linderman
1, and
Melinda Mechur Karp
2Abstract
Community colleges are grappling with low rates of degree completion and transfer. The City University of New York’s (CUNY) Accelerated Study in Associate Programs (ASAP) aims to improve graduation rates by providing a range of comprehensive support services to community college students in select majors. Using student-unit record data, we employed propensity score matching to examine short-term and 3-year outcomes from ASAP’s first cohort, as well as logistic regression to identify program factors related to graduation. We found that ASAP participation was significantly positively related to retention, credit accrual, transfer, and degree attainment. Regression analyses indicated that a key influence on graduation is participation in advisement sessions. This study provides evidence that encouraging academic momentum via structured and comprehensive support can significantly improve community college graduation rates. It also provides evidence that ongoing and intrusive advisement can encourage positive academic outcomes among community college students.
Keywords
student retention, degree completion, academic momentum, academic advising, student support services, City University of New York
1City University of New York, USA 2Columbia University, New York, NY, USA
Corresponding Author:
Melinda Mechur Karp, Teachers College, Columbia University, 525 West 120th Street, Box 174, New York, NY 10027, USA.
Community colleges around the nation are grappling with low rates of degree comple-tion and transfer. As foundacomple-tions, policymakers, and educators shift their focus from higher education access to completion, community colleges have been forced to rethink their mission, focus, and measures of success. Meeting the needs of students who enter community college with few academic, economic, and family resources— and who are therefore least likely to graduate or transfer—is a fundamental challenge for these institutions. Recognizing this challenge, in 2007 the City University of New York (CUNY) developed and implemented Accelerated Study in Associate Programs (ASAP) to support new community college students and move them quickly toward an associate’s degree. This article reports on 3-year outcomes from the program’s first cohort.
Background
Statement of the Problem
Though a primary point of access to higher education, community colleges struggle to ensure that all of their students earn a credential. Of the first-time college students who entered a community college during the 2003-2004 school year, for example, 45% had left postsecondary education without earning a degree by 2006 (Provasnik & Planty, 2008). Only 6% had earned some sort of credential during the same 3-year period. Looking only at those students enrolled full-time and who might be better expected to complete a degree quickly improves the statistics only slightly: 21% of first-time, full-time students who enrolled in a public 2-year college in the fall of 2005 had earned a certificate or associate’s degree 3 years later (Aud et al., 2010).
Looking over a longer period of time does not change the overall low rates of completion for beginning community college students. Analyses of data from the National Education Longitudinal Study of 1988 (NELS:88) indicate that 8 years after high school graduation, fewer than 40% of community college enrollees earned a cre-dential (Bailey & Morest, 2006). Another 11% transferred to a 4-year institution, though they had not earned a degree. These rates are even lower for Hispanic and Black students.
New York City’s community colleges are not immune to low rates of completion and transfer. According to CUNY’s Office of Institutional Research and Assessment (OIRA), of first-time freshmen enrolling in one of CUNY’s community colleges in the fall of 2004, only 20% earned an associate’s degree within 6 years (CUNY OIRA, 2011). Another 8% had earned a bachelor’s degree, and 9% were still enrolled.
Low levels of postsecondary degree attainment are problematic at both the indi-vidual and the macro levels. For indiindi-viduals, earning a credential is associated with significantly higher wages and earnings (Belfield & Bailey, 2011; Rouse, 2007). Particularly for individuals, like those in CUNY’s community colleges, who otherwise lack access to economic capital, earning a college credential is a key mechanism for long-term economic health and an important gateway to the middle class. From a macro perspective, ensuring that large numbers of individuals obtain postsecondary
credentials has important economic and civil implications, such as increased tax rev-enues (Baum, Ma, & Payea, 2010; Hilliard, 2011; Rouse, 2007), decreased unemploy-ment (Baum et al., 2010), and lower rates of criminality and welfare receipt (Baum et al., 2010; Belfield & Bailey, 2011).
The Office of the Mayor and CUNY’s ASAP
Aware of the need to improve CUNY’s graduation rates and provide more individuals with access to postsecondary credentials, in 2007 the Office of the Mayor’s Center for Economic Opportunity (CEO) provided funds for CUNY to develop a new approach to community college education. The aim of the initiative was to help socially and economically disadvantaged students earn an associate degree as quickly as possible. Named the ASAP initiative, the program was designed to eliminate many of the eco-nomic and social barriers that hinder progression toward a degree. ASAP’s stated goal was to have 50% of program participants earn an associate’s degree within 3 years—a significantly higher proportion than the approximately 13% of CUNY community col-lege students who typically do so.
Students were eligible for the initial fall 2007 ASAP cohort if they were a New York City resident, had fewer than 12 college credits, were pursuing an associate’s degree in one of ASAP’s approved majors, were not enrolled in any other special CUNY support program, and had completed any developmental education coursework prior to program enrollment.1 Twenty-eight percent of the fall 2007 cohort completed
developmental courses in the summer of 2007 to join the program.
Students were recruited for the 2007 ASAP cohort after acceptance to a CUNY community college and upon taking the CUNY Assessment Test, which measures col-lege readiness in reading, writing, and math. All incoming students received prelimi-nary information about ASAP with their CUNY acceptance materials, and, once test scores became available, ASAP college staff members reached out directly to eligible incoming students by email, mail, and phone. All eligible students were invited to group or individual information sessions to learn more about the program. Continuing students with fewer than 12 credits were also recruited by mail, through classroom visits, and by faculty referral.2
To help students move quickly toward their degree goals, ASAP staff implemented a comprehensive array of services and program requirements. Key program compo-nents included:
•
• required full-time study (at least 12 credits per semester);
•
• a consolidated schedule, in which students took their courses in morning, after-noon, evening or weekend blocks to free up time for family, work, and other responsibilities;
•
• cohorts organized by major whereby students took classes with fellow ASAP students;
•
• full-time ASAP staff devoted to comprehensive and personalized advisement and career development services;
•
• twice-monthly required advising sessions for all students; and
•
• special programs for ASAP students, including tutoring, weekly seminars, employment services, leadership opportunities, and transfer advising.
From its inception, ASAP has existed at six CUNY community college campuses.3
ASAP students selected an approved program major; these majors are linked to the city’s economic needs as well as transfer opportunities within the CUNY system. To ease the burden of required full-time attendance, ASAP students eligible for financial aid received tuition waivers to cover any gap between financial aid awards and a stu-dent’s tuition and fees. All ASAP students also received free monthly Metrocards (for use in the city’s public transit system) and access to textbooks.
The ASAP program is housed within the University’s Office of Academic Affairs. The central office provides overall program support and guidance and consists of a University associate dean, a deputy director, an assistant director for research and evaluation, a research associate, a program coordinator, an outreach/scholarship spe-cialist, and a program assistant who does clerical work. Each participating community college has its own ASAP staff overseen by a program director who reports to the Vice President for Academic Affairs. Each college staff includes a college director, two to four advisors (depending on program enrollment), a career and employment specialist, part-time tutors, and administrative support (clerical) personnel. All ASAP staff mem-bers are fully dedicated, and their positions are funded by the program budget, which is part of the general CUNY budget.
Conceptual Framework
ASAP’s educational framework is rooted in a theory of action that assumes that col-lege success is based in three interrelated constructs: students’ ability to gain and maintain academic momentum, the development of college integration and belonging, and the ability to access timely and relevant support services (Linderman & Kolenovic, 2009). Viewing college success in this manner encouraged initiative staff to develop a program that was comprehensive and multifaceted, yet grounded in theoretical and empirical understandings of the antecedents of college success. The theory of action assumes that while all three components of student success are important on their own, their efficacy is increased when they are implemented in concert, as they complement and magnify one another.
The Importance of Academic Momentum
A growing body of research finds that helping students earn credits quickly—generating
academic momentum—is correlated with degree attainment (Adelman, 1999, 2006; Attewell, Heil, & Reisel, 2011; Calcagno, Crosta, Bailey, & Jenkins, 2007; Goldrick-Rab, 2007; Swanson, 2008). Adelman (1999, 2006), for example, found that for two large cohorts of students (NELS:88 and the sophomore cohort of the High School and Beyond study), one of the biggest predictors of bachelor’s degree attainment is whether
or not they earned a significant number of college credits during the first calendar year of postsecondary enrollment. Swanson (2008) found the same effect for a large group of highly motivated students within the NELS:88 data set. Examining a cohort of all new community college students in Florida and using event history analysis, Calcagno et al. (2007) found that reaching specific academic milestones, including earning 10 or more nonremedial credits, increases students’ likelihood of earning a credential.
For students balancing work, family, and college, gaining and maintaining aca-demic momentum is a particular challenge. Two common approaches to balancing these competing demands, part-time enrollment and temporarily stopping out of col-lege, are strongly correlated with lower rates of bachelor’s degree attainment (Adelman, 2006; Attewell et al., 2011; Swanson, 2008).
ASAP builds and maintains students’ academic momentum in a number of ways. Required full-time enrollment is a key element, of course, as it ensures that students move quickly toward earning enough credits to fulfill their degree requirements. Consolidated course schedules mean that there is less opportunity for other demands to interfere with college work. Support services such as advising and tutoring help ensure that students will pass their classes and earn college credits early and often. The financial support offered by the program decreases the likelihood that external barri-ers, such as the loss of transportation, will get in the way of student momentum.
Integration and a Sense of Belonging
ASAP is also grounded in Tinto’s (1993) notion of integration and its influence on stu-dent persistence. Tinto argued that stustu-dents who feel a strong sense of belonging and believe that they have a social and academic home in college are more likely to remain enrolled. Creating connections between students, their peers, and faculty and staff members can improve the likelihood of persistence and, presumably, graduation.
Tinto’s theory of integration has become a classic in higher education. Though the theory was developed for traditional students, recent research indicates that it is also appropriate for students attending commuter and 2-year institutions (Deil-Amen, 2011; Karp, Hughes, & O’Gara, 2010). An array of community college interventions promoting student integration have had promising results, serving as a model for ASAP. Key among them are learning communities, in which cohorts of students take courses together to build strong relationships with one another and the institution (Engstrom & Tinto, 2008; Scrivener et al., 2008; Tinto, 1997).
Integration and connection to college can also develop from strong relationships with faculty and staff members. Bensimon (2007) argued that “institutional agents” encourage students by providing interpersonal connections, advice, motivation, and information. Rendon (1994) made a similar point, while focusing on nontraditional students. She emphasized that such students, who often feel lost or out of place in col-lege, are more likely to be successful if they can identify and interact with individuals who actively provide them with help navigating college and validation that they do, indeed, belong in postsecondary education.
ASAP develops students’ sense of belonging through a variety of structures, all of them substantially different from “business as usual” on other CUNY community col-lege campuses. Before they even begin their coursework, ASAP students are required to participate in a 2- to 3-day summer institute that includes ice-breaker and team-building activities, an orientation to program expectations, campus navigation activi-ties, and small group discussions. These presemester activities allow students to begin building rapport and comfort with each other and on their campuses. Most orientation programs at CUNY, in contrast, are voluntary and last, at most, 1 day.
Once the semester begins, CUNY ASAP uses a cohort approach in which students take three to five classes with fellow ASAP students. By traveling together through gateway courses, students form study groups, attend ASAP tutoring together, and develop social networks that might be elusive to a typical CUNY community college student who frequently has different classmates in each course, leaves campus as soon as classes end, and is offered only optional support services. The program’s intensive advisement component, in which students are required to meet with a dedicated advi-sor at least twice a month, encourages connections between students and staff mem-bers. Other CUNY students, in contrast, participate in voluntary and noncoordinated support and advising activities.
The Need for Timely and Relevant Support Services
The final prong in ASAP’s conceptual framework is the importance of student access to support services. Such support is particularly important for students from educa-tionally or economically disadvantaged backgrounds (Karp, 2011). Students need to know which services are available and how to access them, but many of the students most in need of academic support are uncertain how to do so (Karp, O’Gara, & Hughes, 2008). J. E. Rosenbaum, Deil-Amen, and Person (2006) noted that the organization of student support services in many colleges assumes that students have the knowledge, social skills, and motivation to access such services. This assumption may not always be valid, particularly for students from families and communities without college-going experience.
There is evidence that making academic and social support intrusive can improve outcomes. Random assignment studies of intrusive advising programs, in which stu-dents participated in required advising over the course of two semesters and in which advisors had dramatically reduced caseloads, have shown positive effects on students’ likelihood to register for subsequent semesters and on the number of credits attempted (Scrivener & Au, 2007; Scrivener & Weiss, 2009). However, once the program ended, these results did not last, indicating that support must be sustained over time.
ASAP, in its comprehensive approach, draws from our understanding of the neces-sity of intrusive supports for community college students. Dedicated advisors are able to meet students’ needs, whenever those needs arise and in whatever form. Required student meetings with advisors ensure that the need for help is identified early, and solutions are found and implemented before it is too late. ASAP advisors also check in with faculty members on a periodic basis to identify students in need of additional
support. Such intrusive advising is supplemented with the weekly ASAP seminar, or group advising session, and supplemental programs such as career workshops and the ASAP leadership program. Such intensive and personalized advising differs signifi-cantly from most advising within CUNY community colleges, which is typically pro-vided via short meetings with whichever generalist advisor is available when students come to the advising center.
Data
Data for this study come from the CUNY OIRA. OIRA collects student-unit records for all CUNY enrollees. Data include demographic variables, including race/ethnicity, age, and income (as reported on the Free Application for Federal Student Aid [FAFSA]); enrollment variables, including terms of enrollment and full- or part-time enrollment status; course data, including all courses in which the students enrolled, the term of enrollment for each course, and grades in the course; and outcomes data, including grade point average (GPA), credits earned, and degrees awarded. Though the OIRA data set used for this study is not linked to high school data, it does allow for the control of previous academic achievement via the inclusion of (a) the college admissions average score (a CUNY-calculated score based on high school perfor-mance and reflecting CUNY’s college preparatory requirements), (b) English and mathematics scores on New York State Regents examinations, and (c) basic skills assessment test scores for placement into developmental education.
We conducted two types of analyses for this study. We first examined student out-comes using propensity score matching. We then examined factors related to ASAP students’ graduation, using logistic regression. Our cohort of interest was ASAP’s first group of enrolled students (2007-2008 school year, n= 1,132).
Method
Propensity Score Matching
For analysis of student outcomes, we constructed a comparison group of CUNY stu-dents who met the same admissions criteria and enrolled in the same majors as ASAP students, but who did not participate in the ASAP program. Notably, comparison stu-dents entered CUNY in 2006 (the year prior to ASAP’s start) to limit selection bias. Had we used 2007 comparison students, the two groups may have differed in terms of moti-vation or other unmeasured characteristics, as the comparison group would have been made up of students who could have entered ASAP but chose not to do so. In addition, students enrolled in other intensive support programs were excluded from the compari-son group.4 A total of 1,791 students were included in the comparison group.
This constructed comparison group serves as a base that allows us to assess whether the ASAP program in its entirety—mandatory full-time study combined with financial incentives, academic and career advisement, program seminar, and blocked and con-densed courses—yields better outcomes than those of similar students who are not
mandated to engage in or receive these services. The final data set used for this study contains student-unit records for all students in the treatment and comparison groups from initial entry into either CUNY (for comparison students) or the ASAP program (for treatment students) and continuing for three academic years.
Initial comparisons between the ASAP and the comparison group found that the two groups differed on characteristics such as age, enrollment status, whether they are a continuing student, and income. When treatment and control groups are not ran-domly assigned and therefore may differ on characteristics that could potentially influ-ence outcomes, propensity score matching is an appropriate statistical technique for addressing these group differences (P. R. Rosenbaum & Rubin, 1983). In propensity score matching, subjects are “matched” based on a predicted probability, or propen-sity, of how likely they are to be in the treatment group, given demographic and other preintervention characteristics, and their outcomes are then compared (P. R. Rosenbaum & Rubin, 1983).
With support from Metis Associates, CEO’s external evaluator, we used an optimal full matching method for the propensity score analysis. Earlier attempts to use one-to-one matching, also known as greedy matching, resulted in losing nearly half the sam-ple due to suitable matches being unavailable. Optimal full matching uses a clustering matching procedure, and yielded better results with only a 2.5% sample loss.5
In terms of matching variables, it is recommended that as many covariates that may have an effect on the outcome and on selection into treatment be included in the model (Heckman, Ichimura, Smith, & Todd, 1998; Smith & Todd, 2005). We used the follow-ing matchfollow-ing variables in the propensity score matchfollow-ing analysis: gender, race/ethnic-ity, age, college attended, exemption from taking CUNY assessment test, admission type, dependency status for financial aid purposes, and Pell and TAP grant receipt as a proxy for income, as has been used in other studies (Muraskin, Lee, Wilner, & Swail, 2004; Engle & O’Brien, 2008). Outcome variables of interest included 1-year reten-tion, 2 and 3-year graduareten-tion, credit accumulareten-tion, and GPA.
Logistic Regression
To examine potential influences on student outcomes, specifically graduation, we also conducted a logistic regression analysis using a subsample of only ASAP participants. We used a sample of ASAP students who began in fall 2007 ASAP cohort and remained enrolled in their initial college each spring and fall for four semesters. Including only students who were continuously enrolled ensured that the results were not skewed by students on medical leave or who had other, nonmotivational, reasons not to attend program activities; 761 students met these criteria.
Our analyses sought to examine the influence of academic momentum and integra-tion on degree attainment. The specific predictor variables of interest in the model are academic achievement (measured as the number of credits accrued after one semester and cumulative GPA after two semesters) and intensity of program participation (mea-sured as the number of ASAP advising sessions attended during the 2nd year of enrollment).
We estimated three separate logistic regression models predicting 2-year graduation. Using three models allowed us to verify model strength as additional predictors are added. Table 1 lists and operationalizes all variables used in these models. The first model includes demographic variables, as we know that student demographic charac-teristics alone can impact graduation (Cook & Cordova, 2007; Goldin, Katz, & Kuziemko, 2006). The second model adds high school achievement variables, which have been found in prior research to have an effect on college graduation (Adelman, 2006; Bowen, Chingos, & McPherson, 2009). The final full model adds college perfor-mance and engagement variables, as these variables have been found to possibly affect retention and graduation (Adelman, 2006; Herzog, 2005; Rendon, 1994; Tinto, 1993).
To include all 761 students in the analysis, we imputed missing data using the mul-tiple imputation function in SPSS for 292 students who did not have a complete record.
Table 1. Description of Variables used in Logistic Regression Models.
Variables Description
Model 1
Admission type Dummy variable for each group (continuing student
and transfer student). Reference group is first-time freshmen.
Age Continuous variable
College fixed effects Dummy variable for each college (not shown in
model)
Ethnicity Dummy variable for each group (Asian/Pacific Islander,
Black, Hispanic). Reference group is White.
Father’s educational attainment Dummy variable for each group (education
unknown, college education). Reference group is no college education.
Mother’s educational attainment Dummy variable for each group (education
unknown, college education). Reference group is no college education.
Gender Dummy variable: 1 = female; 0 = male
Graduation Dummy variable: 1 = graduate; 0 = nongraduate
Household income Continuous variable (log transformed)
Model 2
College admission average Continuous variable on a scale from 0 to 100
Score on math Regents exam Continuous variable on a scale from 0 to 100
Score on English Regents exam Continuous variable on a scale from 0 to 100
Model 3
Credits earned in first semester Continuous variable
Number of advisement meetings
in the second year Continuous variable (standardized)
Cumulative grade point average
Of the entire sample, students had missing data on the following variables: Math Regents scores (25.5%), English Regents scores (24.3%), high school average (10.3%), and income (13.7%). Missing data for high school variables was mostly due to late applicants, whose high school data did not make it into the central database, and trans-fer applicants, because they did not have to provide a high school transcript. Missing data for the income variable was a result of students not filing the FAFSA. Multiple imputation uses all predictors in the model, besides the missing variable, to estimate the missing value by calculating a pooled estimate value for each missing data point based on five separate iterations.
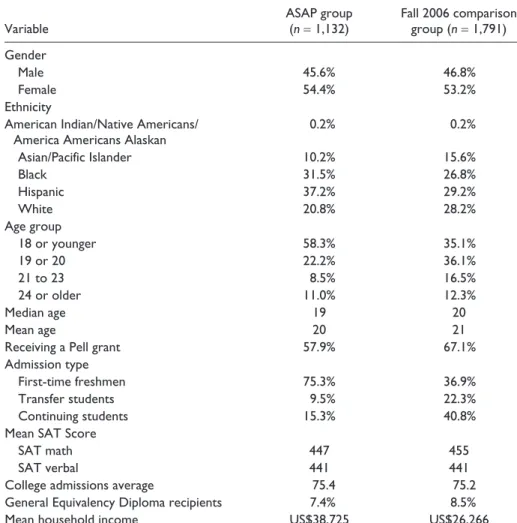
Table 2. Demographic Characteristics of ASAP and 2006 Comparison-Group Students.
Variable ASAP group (n= 1,132) Fall 2006 comparison group (n= 1,791)
Gender
Male 45.6% 46.8%
Female 54.4% 53.2%
Ethnicity
American Indian/Native Americans/
America Americans Alaskan 0.2% 0.2%
Asian/Pacific Islander 10.2% 15.6% Black 31.5% 26.8% Hispanic 37.2% 29.2% White 20.8% 28.2% Age group 18 or younger 58.3% 35.1% 19 or 20 22.2% 36.1% 21 to 23 8.5% 16.5% 24 or older 11.0% 12.3% Median age 19 20 Mean age 20 21
Receiving a Pell grant 57.9% 67.1%
Admission type
First-time freshmen 75.3% 36.9%
Transfer students 9.5% 22.3%
Continuing students 15.3% 40.8%
Mean SAT Score
SAT math 447 455
SAT verbal 441 441
College admissions average 75.4 75.2
General Equivalency Diploma recipients 7.4% 8.5%
Mean household income US$38,725 US$26,266
Results
Description of ASAP and Comparison-Group Students
Descriptive analyses indicate that ASAP is enrolling its target population. Table 2 shows the demographic and background characteristics of ASAP and comparison stu-dents upon entry into the study. ASAP stustu-dents, like community college stustu-dents nationally and within CUNY, were more likely to be female than male (54% vs. 46%). The majority were Hispanic (37%) or Black (32%). ASAP students were relatively young: Nearly 60% were 18 or younger at the time of program entry, and the average age of ASAP students at the time of admission was 20. The vast majority of ASAP students were first-time freshmen, though one quarter of the sample were continuing CUNY or transfer students. Most students were from economically disadvantaged homes, as 58% of the group was eligible for Pell grants and the mean family income was US$38,725. ASAP students were also relatively academically proficient, with high school academic grades averaging in the C range.
As noted, though the comparison group comprised students who met the same admissions criteria as ASAP participants, the two groups differed on a number of vari-ables. ASAP students were more likely to be Hispanic or Black and less likely to be White or Asian. They were less likely to receive Pell grants and had higher household incomes than comparison-group students. ASAP students were also younger, with a much higher percentage of students who were 18 years old or younger at the time of college entry. Comparison students were less likely to be first-time freshmen and more likely to be continuing or transfer students.
A primary goal of ASAP is to move students quickly toward a degree. Longitudinal data (not included in Table 2) reveal that after 2 years, 30% of ASAP students had earned a degree, while only 11% of comparison-group students had done so. Three years after enrollment, this difference in graduation rates remained, with 55% of ASAP students having earned an associate’s degree as compared with 25% of comparison-group students. One could argue that the difference in graduation rates is not necessar-ily affected by the ASAP program as a whole but is driven solely by the fact that ASAP students are required to enroll in college full-time for 2 years, while comparison stu-dents may have enrolled part-time after their first semester. However, when we look at only those students enrolled full-time for 2 years, the difference in graduation rates remain: 43% of ASAP full-time enrollees (n= 1, 132) graduated within 3 years; 30% of comparison students (n= 1,791) did so. This result indicates that full-time attendance alone is not responsible for this large difference in graduation rates. First, as noted, comparison students who did attend full-time for 2 years still graduated at lower rates than ASAP students. Second, ASAP students had the option of leaving the program and attending college part-time (just as comparison-group students decided each semester whether to reenroll full-time or drop to part-time status). ASAP students tended to remain enrolled full-time at a higher rate, which indicates that the broader ASAP pro-gram may influence students’ enrollment decisions and subsequent graduation.
In this study, we were particularly interested in the effectiveness of the ASAP pro-gram in its entirety. Our contention—and what this study sought to test—is that the ASAP model encourages full-time enrollment and other behaviors that increase stu-dents’ likelihood of completion. Therefore, the remainder of our analyses examines the complete comparison and treatment groups, to ascertain the influence of the ASAP model as a whole on student outcomes.
Outcomes After Optimal Full-Propensity Score Matching
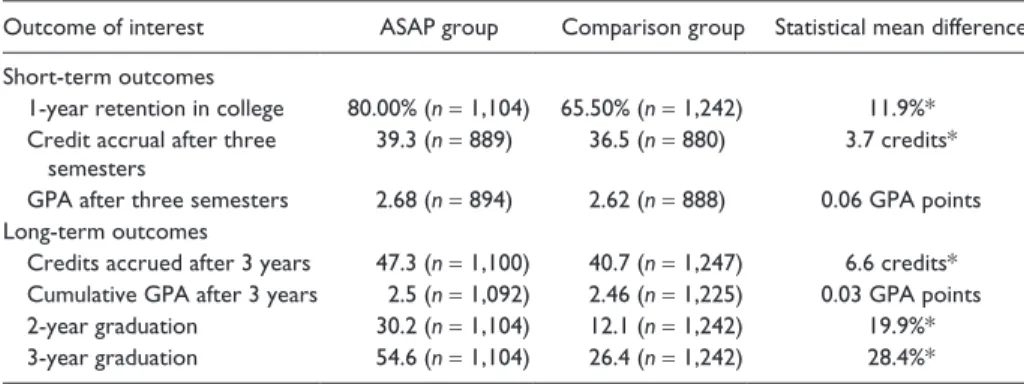
Controlling for student characteristics via optimal full-propensity score matching, the short-term impact of ASAP participation on retention was statistically significant, with ASAP students having a 12% higher reenrollment rate (i.e., 1-year retention rate) in their initial CUNY college than comparison-group students. Moreover, after three semesters of enrollment, ASAP students had earned nearly four more credits than had comparison-group students. There were no impacts on students’ GPAs during their early course taking. Table 3 summarizes these short-term outcomes and shows the average program impact for each outcome in the column showing statistical mean differences.
The academic momentum gained by ASAP students propelled them to stronger long-term outcomes than their nonparticipating peers. Again, after propensity score matching, ASAP students continued to be advantaged in terms of credit accumulation and, ultimately, graduation rates. Table 3 also shows long-term outcomes for these two groups of students, including the average program impact for each outcome. ASAP students continued to accumulate credits at a greater rate than their similar peers—on average, 6.6 more credits 3 years after initial college enrollment. However, ASAP students earned grades that were no higher than those earned by comparison-group students.
Table 3. Outcomes After Optimal Full Matching Propensity Score Analysis.
Outcome of interest ASAP group Comparison group Statistical mean difference Short-term outcomes
1-year retention in college 80.00% (n= 1,104) 65.50% (n= 1,242) 11.9%* Credit accrual after three
semesters 39.3 (n= 889) 36.5 (n= 880) 3.7 credits* GPA after three semesters 2.68 (n= 894) 2.62 (n= 888) 0.06 GPA points Long-term outcomes
Credits accrued after 3 years 47.3 (n= 1,100) 40.7 (n= 1,247) 6.6 credits* Cumulative GPA after 3 years 2.5 (n= 1,092) 2.46 (n= 1,225) 0.03 GPA points 2-year graduation 30.2 (n= 1,104) 12.1 (n= 1,242) 19.9%* 3-year graduation 54.6 (n= 1,104) 26.4 (n= 1,242) 28.4%*
Note. Sample sizes, noted in parentheses, are based on students included in the analysis after optimal full matching procedure. ASAP = Accelerated Study in Associate Programs; GPA = Grade point average.
The most striking differences between the two groups are seen when we look at their graduation rates. Two years after their initial enrollment in college, 30% of ASAP students had earned an associate’s degree, compared with 12% of comparison students—a difference of nearly 20% and almost two-and-one half times as many students. After 3 years, the difference in graduation rates rises to nearly 30%; 55% of ASAP students had earned an associate’s degree compared with 26% of comparison-group students. In other words, for every one comparison-comparison-group student who gradu-ated within 2 years, two ASAP students gradugradu-ated.
Predictors of 2-Year Graduation
The above results indicate that the ASAP program, as a whole, leads to positive results for students. To better understand why ASAP appears to positively influence student outcomes, and to provide information on the potential efficacy of two key elements of the model, academic momentum and integration, we examined the influence of ASAP participants’ academic performance and advising experiences on graduation. We used logistic regression analysis to compare similar ASAP graduates to nongraduates.
As noted in the methods section, we constructed a subsample of ASAP students, all of whom were enrolled continuously for four semesters. Descriptive information about this sample, which we refer to as the logistic regression subgroup, is shown in Table 4. As with the full ASAP sample described earlier, the majority of students in
Table 4. Descriptive Statistics for the Logistic Regression Subgroup (n= 761).
Variable M SD
2-year graduation rate 0.413 0.493
Advisement meetings in second year 16.3 6.9
Gender Female 0.580 0.494 Age 21 4.603 Ethnicity Asian/Pacific Islander 0.118 0.323 Black 0.293 0.455 Hispanic 0.380 0.486 White 0.206 0.405 Admission type First-time freshmen 0.790 0.408 Transfer students 0.076 0.266 Continuing students 0.134 0.341
College admissions average 75.7 6.393
First-semester credits earned 13.5 3.393
Cumulative grade point average in last semester 2.79 0.627
this subgroup was female. The logistic regression subgroup was also similar in the percentages of Hispanic and Black students enrolled, with these two groups compris-ing nearly 70% of the subgroup. Forty-one percent of students in the logistic regres-sion subgroup graduated within 2 years.
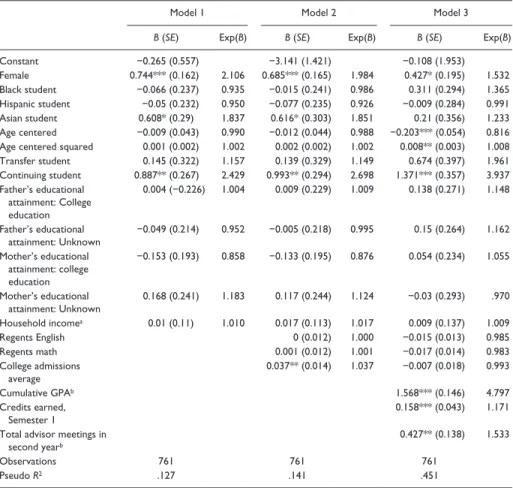
Table 5 shows the results of the logistic regression models. We found that female students were more likely to graduate than male students and that there were no sig-nificant differences between racial groups. Expectedly, we found that continuing stu-dents were more likely to graduate in 2 years than first-time freshmen.
In the second model, which includes high school achievement variables, we found that college admission average was a significant predictor of graduation; however, that
Table 5. Logistic Regression on 2-Year Graduation for the Logistic Regression Subsample.
Model 1 Model 2 Model 3
B (SE) Exp(B) B (SE) Exp(B) B (SE) Exp(B) Constant −0.265 (0.557) −3.141 (1.421) −0.108 (1.953) Female 0.744*** (0.162) 2.106 0.685*** (0.165) 1.984 0.427* (0.195) 1.532 Black student −0.066 (0.237) 0.935 −0.015 (0.241) 0.986 0.311 (0.294) 1.365 Hispanic student −0.05 (0.232) 0.950 −0.077 (0.235) 0.926 −0.009 (0.284) 0.991 Asian student 0.608* (0.29) 1.837 0.616* (0.303) 1.851 0.21 (0.356) 1.233 Age centered −0.009 (0.043) 0.990 −0.012 (0.044) 0.988 −0.203*** (0.054) 0.816 Age centered squared 0.001 (0.002) 1.002 0.002 (0.002) 1.002 0.008** (0.003) 1.008 Transfer student 0.145 (0.322) 1.157 0.139 (0.329) 1.149 0.674 (0.397) 1.961 Continuing student 0.887** (0.267) 2.429 0.993** (0.294) 2.698 1.371*** (0.357) 3.937 Father’s educational attainment: College education 0.004 (−0.226) 1.004 0.009 (0.229) 1.009 0.138 (0.271) 1.148 Father’s educational attainment: Unknown −0.049 (0.214) 0.952 −0.005 (0.218) 0.995 0.15 (0.264) 1.162 Mother’s educational attainment: college education −0.153 (0.193) 0.858 −0.133 (0.195) 0.876 0.054 (0.234) 1.055 Mother’s educational attainment: Unknown 0.168 (0.241) 1.183 0.117 (0.244) 1.124 −0.03 (0.293) .970 Household incomea 0.01 (0.11) 1.010 0.017 (0.113) 1.017 0.009 (0.137) 1.009 Regents English 0 (0.012) 1.000 −0.015 (0.013) 0.985 Regents math 0.001 (0.012) 1.001 −0.017 (0.014) 0.983 College admissions average 0.037** (0.014) 1.037 −0.007 (0.018) 0.993 Cumulative GPAb 1.568*** (0.146) 4.797 Credits earned, Semester 1 0.158*** (0.043) 1.171
Total advisor meetings in second yearb
0.427** (0.138) 1.533
Observations 761 761 761
Pseudo R2 .127 .141 .451
Note. Models include college fixed effects for which results are not shown above. Omitted categories include the follow-ing: male, White, first-time freshmen, father no college, mother no college. GPA = Grade point average.
aLog transformed. bStandardized z.
effect faded when college performance variables were included. In our full model with college performance and engagement variables, we found that all three variables (first-semester credit accrual, GPA after two (first-semesters, and advising sessions during the 2nd year) were significant predictors of 2-year graduation. That credit accrual and GPA influence graduation is not surprising, as these variables indicate that students are performing well and progressing toward a degree.
The most interesting finding, however, is the large, significant effect of advisement on 2-year graduation. Results indicate that, while holding all variables constant, for a one standard deviation increase in the number of advisement meetings throughout the 2nd year (16 meetings), we expect to see a 53% increase in the odds of graduating within 2 years. Reporting this same effect using a delta-p calculation, we can also say that the probability of graduating increases by 10% for one standard deviation increase above the average number of advisement meetings.
However, these results could be driven by student characteristics such as motiva-tion, rather than the advising experience itself. We therefore investigated whether there was a relationship between number of advising sessions and student characteris-tics. We broke the logistic regression subsample into four quartiles, based on how many advising sessions students attended during their 2nd year of college enrollment,6
and we compared characteristics of students in each of the four quartiles, using one-way analysis of variance to see whether there were any differences that might indicate a selection bias in the logistic analyses.
Table 6 shows that there are few significant differences between quartiles on most variables. However, older students attended fewer advising sessions than younger stu-dents. Unexpectedly, both household income and the number of credits earned during the first semester were negatively correlated with advising. Though we might expect more advantaged and more academically successful students to make better use of available advising services, our data indicate that students who are most at risk of failure due to family or educational background actually see their advisors more often.
These findings indicate that the logistic regression findings are unlikely to be posi-tively skewed due to student characteristics. Better-prepared students do not seek out advising at higher rates. This increases our confidence that the positive relationship between advising and graduation is driven by the advising itself.
Discussion
This study examined the impact of participation in CUNY’s ASAP initiative on com-munity college students’ retention in and completion of associate’s degrees. ASAP aims to improve student progress toward a degree and attempts to achieve this via a comprehensive and intensive series of supports. Using propensity score matching, we compared ASAP participants with similar nonparticipants. ASAP participation posi-tively influenced a wide range of academic outcomes, including retention and credit accrual. Most importantly, ASAP students were significantly more likely to earn degrees than comparison students. Three years after enrollment, 55% of ASAP stu-dents had earned a degree, while only 26% of comparison stustu-dents had done so.
We also used logistic regression analysis to understand potential influences on the outcomes of ASAP students. Examining a subsample of ASAP students, and compar-ing those who graduated to those who did not, we found that one significant predictor of graduation was participation in academic advising. Importantly, students who par-ticipated in advising at low and high rates did not vary on most demographic or aca-demic variables, indicating that it was advising—not motivation or ability—that drove these results.
The findings extend our understanding of ways to promote student success in the community college. First, they provide additional evidence that helping students gain academic momentum can improve long-term outcomes (Adelman, 1999, 2006; Attewell et al., 2011; Calcagno et al., 2007; Goldrick-Rab, 2007; Swanson, 2008). The ASAP students in our sample had positive early college experiences, as compared with nonparticipating students. Notably, participants accrued more credits during their 1st
Table 6. Number of Advisement Meetings Attended During Second Year of Enrollment, by Quartile.
Number of advisement meetings
Student characteristics Less than 10 11 to 20 21 to 30 More than 30
Total sample 20.6% 55.2% 20.5% 3.7% Female 17.0% 58.3% 21.3% 3.4% Male 25.6% 50.9% 19.4% 4.1% Asian 21.1% 61.1% 15.6% 2.2% Black 17.0% 48.0% 27.8% 7.2% Hispanic 19.7% 57.4% 19.7% 3.1% White 27.4% 57.3% 14.6% 0.6% Age* 22 21 21 20 First-time freshmen 20.5% 55.7% 19.6% 4.2% Transfer student 29.3% 50.0% 19.0% 1.7% Continuing students 16.7% 54.9% 26.5% 2.0%
Father’s educational attainment: No college 21.4% 55.8% 19.2% 3.6% Father’s educational attainment: College
education
23.2% 52.9% 22.5% 1.4% Father’s educational attainment: Unknown 18.1% 55.6% 21.2% 5.0% Mother’s educational attainment: No college 21.9% 51.6% 22.8% 3.7% Mother’s educational attainment: College
education 19.7% 56.0% 20.9% 3.4%
Mother’s educational attainment: Unknown 19.3% 61.4% 15.3% 4.0% Household income* US$47,028 US$44,004 US$41,597 US$32,779
Regents’ English score 79.2 77.7 77.1 78.9
Regents’ Math score 74.8 75.9 76.1 74.7
College admissions average 75.9 75.8 75.3 74.6
Cumulative GPA 2.86 2.78 2.73 2.75
Credits earned, Semester 1* 15.1 13.6 11.9 12.3
Note. GPA = Grade point average. *p < .05.
year of enrollment. This credit accrual continued, though at a lower rate, over the next few years, culminating in stronger graduation rates for ASAP students.
The findings also support the importance of integration (Tinto, 1993, 1997), insti-tutional agents (Bensimon, 2007; Rendon, 1994), and intrusive supports (Karp, 2011; J. E. Rosenbaum et al., 2006) for community college students. ASAP, as a whole, is a supportive, cohort-based program, so its positive influence on student outcomes sup-ports these conceptualizations of student success. But the logistic regression analysis takes this one step further, identifying one specific way of operationalizing institu-tional agents and intrusive support—mandatory, frequent, one-on-one advising—and correlating such support with student success.
The findings also provide empirical support for newer theories of student success in the community college. Recent authors and practitioners (see, for example, Scott-Clayton, 2011) have theorized that “structuring” students’ community college experi-ence, by limiting their choices and providing clear curricular pathways, can improve student outcomes. Few empirical studies have supported this contention as of yet, how-ever. ASAP provides structure to students’ community college experiences by limiting their choice of major and scheduling options. The positive findings presented here likely stem, in part, from such structure and so represent some of the first empirical support for the “structure hypothesis” that is now prevalent in the community college field.
One of the key frustrations among community college practitioners and researchers today is that many programs that seem to improve student outcomes at first fall prey to a fade-out effect. Initial gains disappear after subsequent semesters. This is true for learning communities (Scrivener et al., 2008), enhanced guidance and counseling (Scrivener & Weiss, 2009; Visher, Butcher, & Cerna, 2010), and student success courses (Weiss, Brock, Sommo, Rudd, & Turner, 2011).
The failure of such programs to result in long-term effects have led to questions about the efficacy of an “inoculation” approach, in which it is assumed that early inter-vention can lead to long-term change in outcomes. The findings presented here sup-port the notion that inoculation is not enough, and that longer-term interventions are likely necessary to meaningfully move the needle of community college graduation rates. ASAP’s promising outcomes are the result of a long-term, ongoing and intensive program lasting 3 academic years.
Another key finding from this study has to do with the importance of advisement. Much has been made of the poor state of advisement services at the community col-lege (see, for example, Grubb, 2006). And we have already noted that good advising is seen as a key mechanism for improving student outcomes (Karp, 2011; J. E. Rosenbaum et al., 2006; see also Metzner, 1989). The findings presented here provide additional evidence that advisement can improve student outcomes.
The logistic regression findings can be interpreted to indicate that creating new advising structures that allow for individualized advising occurring more than once a semester could improve student outcomes. But it is important to note that the mean advising rate for ASAP students was already high—an average of 16.3 meetings dur-ing the 2nd year of enrollment. This is much higher than the level of advisdur-ing offered to most students on most community college campuses.
The findings presented in this article call for a rethinking of how advising is deliv-ered at community colleges. To provide the level of advising services received by ASAP students to all students, let alone the amount of advising received by those to whom the additional benefits found in the logistic regression accrue, would require additional advisors and of course, funds. It also requires shifting the way advising services are provided—from a drop-in, voluntary model to something more frequent, mandatory, and structured. Though the logistical and implementation challenges to doing this are many, the findings presented in this article provide strong evidence that doing so can meaningfully improve student outcomes, even for the most academically vulnerable students.
The study presented here has a number of limitations. First, the students included in the 2007 cohort were somewhat unique among community college students. Students began the program without needing any remedial coursework, although 28% required and completed remediation prior to enrolling in ASAP. As such, they are not entirely representative of the broader community college student popula-tion. In addition, despite the use of propensity score matching techniques, this study also cannot say for certain that the positive outcomes presented are due to the program rather than preexisting characteristics. The findings may be correlational, rather than causal, though a randomized study of the ASAP initiative is currently in progress.
Despite these limitations, the findings presented here strongly support the notion that community college students’ outcomes can be improved via their participation in an intensive, structured, and supportive program. ASAP students were more success-ful than similar peers on a range of outcomes. Moreover, one specific program ele-ment, advising, is related to graduation rates. This study suggests that helping students by giving them personalized guidance and frequent support over multiple semesters can greatly increase their chances of obtaining a college credential.
Acknowledgment
We gratefully acknowledge the research guidance and assistance of Jing Zhu, Senior Research Associate, Metis Associates; Alex Tavares, Research Associate, CUNY ASAP; and Dr. Cheryl Littman, Assistant Dean and the staff of the CUNY Office of Institutional Research and Assessment.
Declaration of Conflicting Interests
The authors declared no potential conflicts of interest with respect to the research, authorship, and/or publication of this article.
Funding
The authors disclosed receipt of the following financial support for the research, authorship, and/or publication of this article: ASAP is supported by the New York City Center for Economic Opportunity, the Leona M. and Harry B. Helmsley Charitable Trust, and the Robin Hood Foundation.
Notes
1. Encouraged by first-cohort results, in 2009, program eligibility was expanded to include students in need of one or two developmental courses.
2. Additional information about the ASAP program, its recruitment procedures, and program elements can be found in ASAP’s early outcomes report (Linderman & Kolenovic, 2009). 3. At the time of ASAP’s founding, there were six community colleges within the CUNY
system. A seventh, the New Community College, opened in the fall of 2012.
4. CUNY offers a variety of other support programs to new enrollees, most of which are targeted at specific types of students and some of which offer services similar to ASAP. To ensure that we were testing the impact of ASAP versus no services (rather than ASAP vs. other programs), we excluded students enrolled in these programs.
5. We ran our analyses using the datasets generated by both the greedy matching and optimal full matching approaches and found that the results hold true across outcomes and datasets. Since optimal full matching allows us to include nearly all ASAP students, this approach increases the generalizability of the findings.
6. Recall that ASAP students are required to attend twice-monthly sessions, which averages to 16 sessions during students’ second academic year.
References
Adelman, C. (1999). Answers in the tool box: Academic intensity, attendance patterns, and
bachelor’s degree attainment. Washington, DC: U.S. Department of Education.
Adelman, C. (2006). The tool box revisited: Paths to completion from high school to college. Washington, DC: U.S. Department of Education.
Attewell, P., Heil, S., & Reisel, L. (2011). What is academic momentum? And does it matter?
Educational Evaluation and Policy Analysis, 34, 27-44. doi:10.3102/0162373711421958
Aud, S., Hussar, W., Planty, M., Snyder, T., Bianco, K., Fox, M. A., . . .Drake, I. (2010). The
condition of education 2010. Washington, DC: National Center for Education Statistics.
Bailey, T. R., & Morest, V. S. (Eds.). (2006). Defending the community college equity agenda. Baltimore, MD: The Johns Hopkins University Press.
Baum, S., Ma, J., & Payea, K. (2010). Education pays: The benefits of higher education for
individuals and society. New York, NY: The College Board Advocacy and Policy Center.
Belfield, C., & Bailey, T. R. (2011). The benefits of attending community college: A review of the evidence. Community College Review, 39, 46-68. doi:10.1177/0091552110395575 Bensimon, E. M. (2007). The underestimated significance of practitioner knowledge in the
scholarship on student success. Review of Higher Education, 30, 441-469. doi:10.1353/ rhe.2007.0032
Bowen, W. G., Chingos, M. M., & McPherson, M. S. (2009). Crossing the finish line: Completing
college at America’s public universities. Princeton, NJ: Princeton University Press.
Calcagno, J. C., Crosta, P., Bailey, T., & Jenkins, D. (2007). Stepping stones to a degree: The impact of enrollment pathways and milestones on community college student outcomes.
Research in Higher Education, 48, 775-801. doi:10.1007/s11162-007-9053-8
City University of New York Office of Institutional Research and Assessment. (2011). System retention and graduation rates of full-time first-time freshmen in associate programs by
year of entry: Community colleges (Table RTGS_0015). Retrieved from http://owl.cuny.
edu:7778/RTGS_0015_FT_FTFR_ASSOC_CC_TOT_UNIV.rpt.pdf
Cook, B. J., & Cordova, D. I. (2007). Minorities in higher education twenty-second annual
Deil-Amen, R. (2011). Socio-academic integrative moments: Rethinking academic and social integration among two-year college students in career-related programs. Journal of Higher
Education, 82, 54-91. doi:10.1353/jhe.2011.0006
Engle, J., & O’Brien, C. (2008). Demography is not destiny: Increasing graduation rates of
low-income college students at large public universities. Washington, DC: The Pell Institute for
the Study of Opportunity in Higher Education.
Engstrom, C. M., & Tinto, V. (2008). Learning better together: The impact of learning commu-nities on the persistence of low-income students. Opportunity Matters, 1, 5-21.
Goldin, C., Katz, L. F., & Kuziemko, I. (2006). The homecoming of American college women: The reversal of the college gender gap. The Journal of Economic Perspectives,
20, 133-156.
Goldrick-Rab, S. (2007). Promoting academic momentum at community colleges: Challenges
and opportunities (CCRC Working Paper No. 5). New York, NY: Community College
Research Center, Teachers College, Columbia University.
Grubb, W. N. (2006). Like, what do I do now? The dilemmas of guidance counseling. In T. Bailey & V. S. Morest (Eds.), Defending the community college equity agenda (pp. 195-222). Baltimore, MD: The Johns Hopkins University Press.
Heckman, J., Ichimura, H., Smith, J., & Todd, P. (1998). Characterizing selection bias using experimental data. Econometrica, 66, 1017-1098. doi:10.2307/2999630
Herzog, S. (2005). Measuring determinants of student return vs. dropout/stopout vs. transfer: A first-to-second year analysis of new freshman. Research in Higher Education, 46, 883-928. doi:10.1007/s11162-005-6933-7
Hilliard, T. (2011). Mobility makers. New York, NY: Center for an Urban Future. Retrieved from http://nycfuture.org/pdf/Mobility_Makers.pdf
Karp, M. M. (2011). Towards a new understanding of non-academic support: Four mechanisms
for encouraging positive student outcomes in the community college (CCRC Working
Paper No. 28). New York, NY: Community College Research Center, Teachers College, Columbia University.
Karp, M. M., Hughes, K., & O’Gara, L. (2010). An exploration of Tinto’s integration frame-work for community college students. Journal of College Student Retention, 12, 69-86. doi:10.2190/CS.12.1.e
Karp, M. M., O’Gara, L., & Hughes, K. L. (2008). Do support services at community col-leges encourage success or reproduce advantage? An exploratory study of students in two
community colleges (CCRC Working Paper No. 10). New York, NY: Community College
Research Center, Teachers College, Columbia University.
Linderman, D., & Kolenovic, Z. (2009). Early outcomes report for City of New York (CUNY)
Accelerated Studies in Associate Programs (ASAP). New York: City University of New
York and the Center for Economic Opportunity.
Metzner, B. S. (1989). Perceived quality of academic advising: The effect on freshman attrition.
American Educational Research Journal, 26, 422-442. doi:10.3102/00028312026003422
Muraskin, L., Lee, J., Wilner, A., & Swail, W. S. (2004). Raising the graduation rates of
low-income college students. Washington, DC: The Pell Institute for the Study of Opportunity
in Higher Education. Retrieved from http://www.luminafoundation.org/publications/ PellDec2004.pdf
Provasnik, S., & Planty, M. (2008). Community colleges: Special supplement to the condition of
education 2008. Washington, DC: National Center for Education Statistics. Retrieved from
Rendon, L. I. (1994). Validating culturally diverse students: Toward a new model of learning and student development. Innovative Higher Education, 19, 33-51. doi:10.1007/BF01191156 Rosenbaum, J. E., Deil-Amen, R., & Person, A. E. (2006). After admission: From college
access to college success. New York, NY: Russell Sage Foundation.
Rosenbaum, P. R., & Rubin, D. B. (1983). The central role of propensity score in observational studies for causal effects. Biometrika, 70, 41-55. doi:10.2307/2335942
Rouse, C. E. (2007). Consequences for the labor market. In C. R. Belfield & H. M. Levin (Eds.),
The price we pay: Economic and social consequences of an inadequate education (pp.
99-124). Washington, DC: The Brookings Institution.
Scott-Clayton, J. (2011). The shapeless river: Does a lack of structure inhibit students’
prog-ress at community colleges? (CCRC Working Paper No. 25). New York, NY: Community
College Research Center, Teachers College, Columbia University.
Scrivener, S., & Au, J. (2007). Enhancing student services at Lorain county community college:
Early results from the opening doors demonstration in Ohio. New York, NY: MDRC.
Scrivener, S., Bloom, D., LeBlanc, A., Paxson, C., Rouse, C. E., & Sommo, C. (2008). A good start: Two-year effects of a learning community program at Kingsborough Community
College. New York, NY: MDRC.
Scrivener, S., & Weiss, M. J. (2009). More guidance, better results? Three-year effects of an
enhanced student services program at two community colleges. New York, NY: MDRC.
Smith, J., & Todd, P. (2005). Does matching overcome Lalonde’s critique of nonexperimental estimators? Journal of Econometrics, 125, 305-353. doi:10.2139/ssrn.286297
Swanson, J. (2008, May). An analysis of the impact of high school dual enrollment course
participation on post-secondary academic success, persistence and degree completion.
Paper presented at the meeting of the National Association for Gifted Children, Tampa, FL: Retrieved from http://www.nacep.org/confdownloads/swanson_executive_summary.pdf Tinto, V. (1993). Leaving college: Rethinking the causes and cures of student attrition (2nd ed.).
Chicago, IL: University of Chicago Press.
Tinto, V. (1997). Classrooms as communities: Exploring the educational character of student persistence. Journal of Higher Education, 68, 599-623. doi:10.2307/2959965
Visher, M. G., Butcher, K. F., & Cerna, O. S. (2010). Guiding developmental math students to
campus services: An impact evaluation of the Beacon program at South Texas college. New
York, NY: MDRC.
Weiss, M., Brock, T., Sommo, C., Rudd, T., & Turner, M. C. (2011). Serving community college
students on probation: Four-year findings from Chaffey college’s opening doors program.
New York, NY: MDRC. Author Biographies
Zineta Kolenovic is the assistant director of research and evaluation at City University of New York’s Accelerated Study in Associates Programs (ASAP).
Donna Linderman is the university associate dean for student success initiatives in the Office of Academic Affairs at the City University of New York.
Melinda Mechur Karp is a senior research associate at the Community College Research Center, Teachers College, Columbia University, New York, NY.