ec in 1Han Emai 2 Duk Emai Captu ISBN conomic an global pro nyang Univ l: joonklee@ ke Universi l:ggere@so uring the Ga : 978-1-9093 nd social u oduction n versity @hanyang. ty oc.duke.edu ains 2013 336-94-0 upgrading networks ac.kr u
The
in m
and
in d
Joo
Ma
W
e co-evo
mobile p
d its imp
developi
onkoo Le
arch 2013
orking P
olution of
phone glo
pact on s
ing coun
ee
1and G
3
Paper 25
f concen
obal valu
social up
ntries
Gary Ger
ntration
ue chain
pgrading
reffi
2s
Abstract
This paper examines the relationship of economic and social upgrading in the global value chain (GVC) of mobile phone manufacturing. It specifically questions (1) how the GVCs of mobile phone manufacturing have changed the dynamics of trade, production and value creation and capturing in developing countries; and (2) how those dynamics have affected the social upgrading of workers in GVCs in terms of employment and wages. The paper identifies several key features of the mobile phone GVC. First, although mobile phone manufacturing was fragmented significantly over the past decade as a result of the relocation of production to developing economies, by the end of the decade it was characterized by the mutually reinforcing co-evolution of geographic and organizational concentration within the mobile phone GVC. Second, global mobile phone production is driven by a handful of lead firms. The consolidation of lead firms helps drive the consolidation of their suppliers, while lead firms capture much more value than their contract manufacturers do. Finally, GVC participation has a significant impact in terms of generating employment where manufacturing is concentrated, but it has a limited impact on wage increase.
Keywords
:
mobile phone manufacturing; global value chains; concentration; economic upgrading; social upgradingAuthors
Joonkoo Lee
is Assistant Professor of Business at Hanyang University, South Korea.Gary Gereffi
is Professor of Sociology and Director of the Center on Globalization, Governance & Competitiveness at Duke University, US.Acknowledgements
Research for this paper was supported by the Capturing the Gains (www.capturingthegains.org) programme. An earlier draft of this paper was presented at the Society for the Advancement of Socio-Economics meetings in June 2012. The authors thank Dev Nathan, Khalid Nadvi and participants at Capturing the Gains workshops for their valuable comments. Joonkoo Lee acknowledges the research assistance of Na Seung Yeon.
This document is an output from a project funded by the UK Department for International Development (DFID), the Sustainable Consumption Institute (SCI), the Chronic Poverty Research Centre (CPRC) and the Economic and Social Research Council (ESRC). However, the views expressed and information contained in it are not necessarily those of or endorsed by the funding organizations, which can accept no responsibility for such views or information or for any reliance placed on them.
1
Abbreviations
CPRC Chronic Poverty Research Centre
CIVIDEP Civil Initiatives for Development and Peace DFID UK Department for International Development EMS Electronics Manufacturing Service ESRC Economic and Social Research Council EU European Union
FIH Foxconn International Holdings GVC Global Value Chain
HS Harmonized System
ILO International Labour Organization
ISIC International Standard Industrial Classification MNO Mobile Network Operator
NAICS North American Industry Classification System n.e.s. not elsewhere specified
NGO Non-governmental Organization NIPA National IT Industry Promotion Agency
OECD Organisation for Economic Co-operation and Development OEM Original Equipment Manufacturer
OES Occupational Employment Statistics OP Operating Profit
OS Operating System
R&D Research and Development RIM Research In Motion
SCI Sustainable Consumption Institute SEZ Special Economic Zone
UK United Kingdom UN United Nations US United States
2
Introduction
This paper examines the relationship of economic and social upgrading in the global value chain (GVC) of mobile phone manufacturing. Specifically, it aims to answer the following questions: (1) how are the GVCs of mobile phone manufacturing changing the dynamics of trade, production and value creation and capturing in developing countries? and (2) how are GVC dynamics affecting the social upgrading of workers in GVCs in terms of employment and wages?1
To answer the first question, this paper examines the dynamics of mobile phone manufacturing GVCs in terms of trade, production and economic upgrading patterns at the country level, and the patterns of growth, competition and inter-firm governance at the firm level. For the second question, it investigates how these dynamics affect one of the key dimensions of social upgrading for workers in GVCs, that is, employment and wages.
Mobile telecom value chains, as Figure 1 shows, consist of multiple sub-chains that function to bring mobile telecommunication devices and services to the customer: mobile phone manufacturing, mobile telecommunication infrastructure, mobile services, etc. The value chain of mobile phone manufacturing is a critical part of these long and complicated chains, consisting of a variety of activities from acquiring raw materials like coltan and a variety of input materials, to putting together hundreds of components and sophisticated software into increasingly smaller devices and finally to distributing and marketing phones across the world. This paper specifically focuses on the middle segment of mobile phone value chains, that is, component manufacturing and final assembly, and the chain actors involved in these activities, that is, branded manufacturers, or original equipment manufacturers (OEMs), and contract manufacturers, especially electronics manufacturing service (EMS) providers.2
The rest of the paper is organized as follows: first we discuss the data used in our analysis. Next, we summarize the key findings of the study, then moving on to highlight three analytic modules: country-level international trade data; firm-level lead firm and key supplier analysis; and social upgrading outcomes. Finally, we reflect the findings in terms of GVC dynamics, and the relationship between economic and social upgrading as well as the governance of GVCs.
1
See Barrientos et al. (2011) for the definition of social upgrading. 2
Branded manufacturers, or OEMs, manufacture mobile phones with their own brand in-house or by using third-party contract manufacturers. These include major global brands, such as Nokia, Samsung and Apple. Contract manufacturers produce mobile phones with their buyers’ brand. EMS providers, among them, specialize in full-package production and service by starting from the sourcing of input materials and components and moving onto assembly and the delivery of the final product. Notable are Foxconn, Flextronics and Samina-SCI.
3
Figure 1: Mobile telecommunication value chains
Source: Authors.
Data and analysis
The study uses quantitative and qualitative data from a variety of sources. For country-level analysis of economic upgrading, it mainly uses international trade data from the UN Commodity Trade Statistics Database (UN Comtrade) at the six-digit product category, the most disaggregated level for comparable cross-national data.3 For the analysis of firms, it uses annual reports and publicly available financial data, along with industry reports and newspaper and magazine articles. For the analysis of social upgrading outcomes, we use quantitative data from national governments and international organizations to examine the change of employment and wages at the sectoral level. Compared with trade data, employment/wages data are generally less disaggregated by industry or by sector. Therefore, the categories we use, such as communications equipment manufacturing (32 in International Standard Industrial Classification [ISIC] ver. 3), include jobs in other activities than manufacturing mobile phones.
Overview of key findings
The key findings of our study on mobile phone manufacturing GVCs in terms of economic and social upgrading can be summarized as follows:
First, mobile phone manufacturing has been significantly fragmented since the early 2000s, when lead firms, or OEMs, began to outsource and move manufacturing to locations outside of the advanced economies. By the end of the decade, however, mobile phone GVCs were characterized by the co-evolution, or mutually reinforcing pattern, of geographic and organizational concentration in terms of production. Only a few countries and firms managed to upgrade economically in ‘manufacturing hotspots’, built around regional supply chains.
3
For mobile phones, we use Harmonized System (HS) code 851712 (telephones for cellular networks/other wireless networks, other than line telephone sets with cordless handsets) in the 2007 HS classification and
HS 852520 (transmission apparatus for radio‐telephony incorporating reception apparatus) in the previous
4
Second, global mobile phone production is driven by a handful of lead firms. The consolidation of lead firms helps drive the consolidation of their suppliers, particularly EMS firms, as the latter became bigger to meet the growing scale and speed of their major clients, leading to the co-evolution of concentration across different value chain segments.4 Lead firms tend to capture the largest portion of value created in mobile phone chains, while contract manufacturers and low-end component suppliers capture a much smaller share of value.
Third, participation and economic upgrading in mobile phone GVCs has varied impacts on social upgrading. When it comes to improvement in employment and wages in developing countries, GVC participation has greater impact in terms of generating employment in manufacturing, as the location of such activity shifted to developing countries. Meanwhile, economic upgrading has a more limited impact on increasing wages.
GVC dynamics: country-level analysis of international trade data
Our country-level analysis based on international trade data shows that economic upgrading, measured by export share growth and unit value increase, took place in a relatively small number of emerging economies, while a great deal of countries either lost their export competitiveness in the global market or continued to be excluded from mobile phone GVCs.
Global mobile phone exports: divergent performance
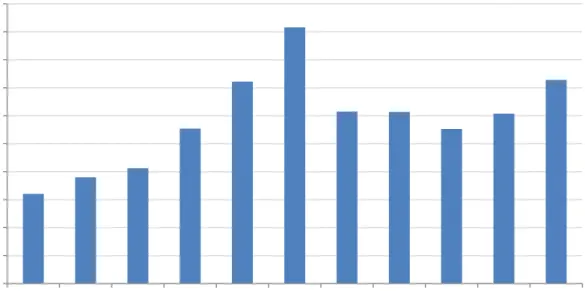
The world’s exports of mobile phones grew significantly over the decade. Exports almost tripled in 2001-2006, from $64 billion to $183 billion. The growth trend was reversed after 2007, when economic recessions significantly reduced the world trade of mobile phones. In 2010, the world’s exports recorded $120 billion, the first annual growth since 2007, and, although not all countries reported, the preliminary 2011 figure shows the recovery is on the track (Figure 2).
Figure 2: The world’s mobile phone exports, 2001-2011
Source: UN Comtrade (HS codes 852520 and 851712).
4
Our ‘co-evolution’ concept entails two aspects: between geographic and organizational concentration in mobile phone production, and between different segments of the value chains, particularly brand-name buyers and their key EMS suppliers. Thus, our paper is distinctive from the existing literature on co-evolution in GVCs, which tends to focus on the latter aspect either at the lead firm level (Nishiguchi, 2001), or at the industry level (Sturgeon and Lee, 2005).
0 20 40 60 80 100 120 140 160 180 200 2001 2002 2003 2004 2005 2006 2007 2008 2009 2010 2011 $ billions
5
Over the past decade, the location of mobile phone production shifted from advanced industrial countries to emerging economies. At the same time, a few large exporting countries began to take up the majority share of the world’s exports, leading to a significant consolidation among exporters. In 2001, the top five exporters of mobile phones were all developed countries: Germany, the UK, South Korea (Korea hereafter), the US and Finland; all but Korea are in Western Europe and North America. Still, they accounted for just over a half of the world’s mobile phone exports (52 percent). The picture was quite different in 2011. More than a half of total exports (61 percent) came from three East Asian economies – China, Korea and Hong Kong – indicating the surge of Asia in mobile phone GVCs.5 Mobile phone exports thus became far more concentrated, with the five largest exporting countries representing 73 percent of the world’s exports in 2010, compared with 52 percent in 2001.
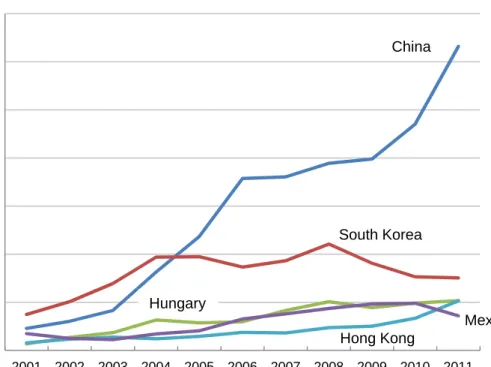
Major exporting countries of mobile phones are divided into three groups in terms of their performance in the past decade: ‘leaders’, ‘dropouts’ and ‘rising stars’ (Figure 3). In 2011, the leader group, the top five exporters, consisted of China (43 percent), Korea (10 percent), Hungary (7 percent), Hong Kong (7 percent) and Mexico (5 percent); all marked a high growth in export shares over the decade, although the rate of growth varied considerably, between China and the other leading exporters in particular. China expanded its global export share drastically, by 36 percentage points, from just 7 percent in 2001. While the expansion was slowed in the face of global recessions (from 29 to 36 percent in 2007-2009), its export growth has accelerated since 2009. The others in the leader group also succeeded in increasing their global export share, up to 6 percent (Hungary) and 3 percent (Mexico) in 2001-2010.
Figure 3: Three groups of mobile phone exporters, 2001-2011 A. Leaders (Top 5 in 2011)
5
This does not take Taiwan into account, because UN Comtrade does not include Taiwan’s exports. If the world’s imports from the category of ‘Asia, n.e.s. (not elsewhere specified)’ are attributed to Taiwan’s exports, then Taiwan exported $7.6 billion worth of mobile phones in 2010, which would put it ahead of Hong Kong ($6.7 billion). 0 10 20 30 40 50 60 70 2001 2002 2003 2004 2005 2006 2007 2008 2009 2010 2011 $ billions China South Korea Hungary Hong Kong Mexico China Hungary South Korea Hong Kong Mexico
6
B. Dropouts
C. Rising stars
Source: UN Comtrade (HS codes 852520 and 851712).
The dropout group consists of advanced industrial economies that used to be the powerhouse of mobile phone exports but experienced a significant decline in export share over the decade. These include Germany, the US, Finland and Sweden. For example, Germany was the largest exporter of mobile phones in 2001, claiming 13 percent of the world’s export market, but its share plummeted, particularly after the mid-2000s, ending at 2.9 percent in 2011. In fact, a large portion of these countries’ exports came from their flagship companies: Siemens (Germany), Motorola (the US), Nokia (Finland) and Ericsson (Sweden). The countries began to struggle in exports as these firms relocated mobile phone production abroad (e.g. Motorola and Nokia) or chose to exit the business in the face of fierce competition (e.g. Siemens). This indicates the close relationship between a country’s exports and the location strategy of lead firms in the mobile phone GVC.
0 2 4 6 8 10 12 14 16 2001 2002 2003 2004 2005 2006 2007 2008 2009 2010 2011 $ billions Germany USA Finland Sweden 0 1 2 3 4 5 2001 2002 2003 2004 2005 2006 2007 2008 2009 2010 2011 $ billions India Romania Viet Nam Czech Rep. Malaysia Brazil Germany Finland USA Sweden Malaysia Czech Rep. Brazil India Viet Nam Romania
7
Finally, the ‘rising star’ group consists of mobile phone exporting countries that experienced an export boom at some point during the decade. For some countries, like Brazil and Malaysia, the boom was too brief to put them up in the leader club, and the steam of export growth has disappeared since 2006-2007.6 Others, such as India, Romania, Vietnam and the Czech Republic, recorded rapid export growth only for the last few years, mainly because foreign firms began to set up factories in these countries (see below). While their exports remain much smaller in size compared with those of the leading exporters, these countries are likely to emerge as the major exporters in the next five to ten years, if they can maintain export growth.
In mobile phone manufacturing GVCs, a country’s economic upgrading, when it is defined as the improvement of a country’s position in the global economy measured by export share increase, took place in only a handful of countries, mostly leaders and a few rising stars. For the rest, the decade signified either economic downgrading or a short-lived upgrading. The recent global recession might slow geographic concentration in mobile phone exports (particularly to China), but it has not reversed the direction. Many in the second group and some in the third group experienced a rapid decline in exports from 2006-2007. At the same time, almost 75 percent of the world’s mobile phone exports nowadays come from only five countries, and 90 percent from only a dozen countries. This indicates a high degree of concentration. A large majority of countries are simply excluded from mobile phone manufacturing GVCs, at least when it comes to final assembly and exports.
Economic upgrading in mobile phone GVCs
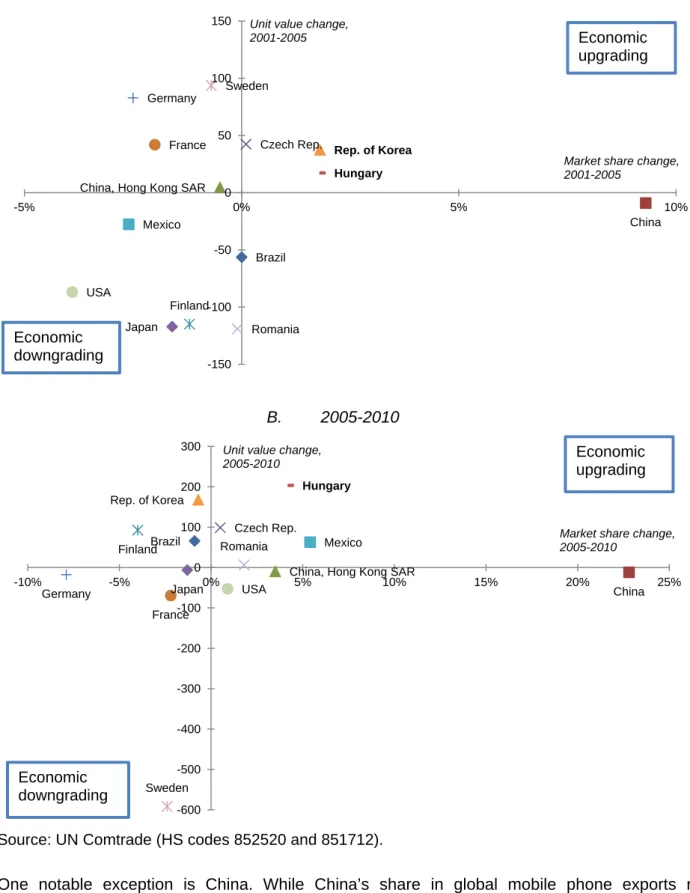
In order to further examine the incidence of country-level economic upgrading, we use the definition proposed by Kaplinsky and Readman (2005) and adopted by Bernhardt and Milberg (2011), whereby economic upgrading is considered to occur in a given sector when a country increases its global export market share without decreasing the average unit value of its exports.7 This restricted definition, in our analysis, further shrinks the group of countries that managed to upgrade economically (Figure 4). Only Hungary, Mexico, Korea and the Czech Republic succeeded in simultaneously increasing their global export share and increasing the unit value of their exports in either of two periods, 2001-2005 and 2005-2010. In contrast, most of the dropout countries, notably Germany and Sweden, experienced a decline in their export share while increasing their export unit value in 2001-2005,8 but their unit value remained unchanged or decreased in the next five years.
6
Brazil has used its clout as a large emerging economy to induce Foxconn, the world’s largest EMS provider, to set up five factories in Brazil since 2010, but focused mainly on supplying the domestic markets (Vlasic et al., 2012). Thus, the economic upgrading of countries in the mobile phone GVC may be defined not simply by the prominence of their exports, but also by production for the domestic market, particularly to those with a large domestic market.
7
Change in unit values has important implications for economic upgrading. Unit values could go down because of lower costs owing to any of several factors: lower wages, currency devaluation or increasing productivity (e.g. via automation). Each of these factors has very different implications for upgrading. Conversely, increasing unit values may also involve high-quality products, which is clearly associated with economic upgrading.
8
If this export share decline occurred because of moving part of domestic production to overseas locations (through either foreign direct investment or offshore outsourcing), this initial increase of unit values might be because firms first shipped lower-end (lower unit-value) product lines to lower-cost locations abroad, while domestic facilities specialized in higher-end products.
8
Figure 4: Economic upgrading in mobile phone exports, 2001-2010 A. 2001-2005
B. 2005-2010
Source: UN Comtrade (HS codes 852520 and 851712).
One notable exception is China. While China’s share in global mobile phone exports rose dramatically over the decade, the average unit value of its exports did not increase and actually dropped from $81 to $61 per item in 2001-2010. Moreover, the country’s export unit value is one of the lowest among its competitors. This suggests that China’s export share growth (one aspect of economic upgrading) occurred with the decline of its export unit value (the other aspect of economic downgrading). Thus, China’s export growth might have taken place without significant upgrading of its exports to high-end (high unit-value) products, given that the country is a low-cost production location. However, the decline of export unit values may also signify the improvement of
Brazil
China China, Hong Kong SAR
Czech Rep. Finland France Germany Hungary Japan Mexico Rep. of Korea Romania Sweden USA -150 -100 -50 0 50 100 150 -5% 0% 5% 10%
Unit value change, 2001-2005
Market share change, 2001-2005 Economic upgrading Economic downgrading Brazil China China, Hong Kong SAR
Czech Rep. Finland France Germany Hungary Japan Mexico Rep. of Korea Romania Sweden USA -600 -500 -400 -300 -200 -100 0 100 200 300 -10% -5% 0% 5% 10% 15% 20% 25%
Unit value change, 2005-2010
Market share change, 2005-2010
Economic upgrading
Economic downgrading
9
productivity, that is, mobile phone factories in China made the same product at a lower cost. While interpreting export unit values from the perspective of economic upgrading is not straightforward,9 this finding shows the significance of China’s position in mobile phone GVCs. This topic is revisited below with firm-level analysis.
In sum, our country-level analysis of economic upgrading in mobile phone manufacturing GVCs based on international trade data highlights several results: (1) shifting export origins from developed countries to a few emerging economies; (2) the growing geographic concentration of mobile phone exports to a few countries, or ‘manufacturing hotspots’, especially China, and the East Asia region; (3) a limited number of economic upgrading cases; and (4) the exclusion of the vast majority of less developed economies. As shown next, these country-level export dynamics reflect underlying changes in the mobile phone GVC, that is, the shifting geography of lead firms’ GVCs and the co-evolution of concentration along the value chain.
GVC dynamics: firm-level analysis
Our firm-level analysis finds that the geographic concentration of mobile phone production and exports is driven by the fragmentation and decentralization of value chain activities, that is, moving low added activities (e.g. assembly) to emerging economies, while maintaining high value-added activities (e.g. research and development (R&D) and marketing) in advanced economies. This changing geography of mobile phone GVCs is increasingly led by fewer, more consolidated global brand OEMs. These lead firms facilitate the agglomeration of production in a specific region or country, such as China, by co-locating their key suppliers, which multiplies the effect of their relocation on job creation. Simultaneously, consolidation at the OEM segment has led to consolidation among contract manufacturers, especially EMS firms, although value distribution between the two consolidated chain segments highly favours of lead firms. We discuss each of these findings in detail.
Value chain fragmentation and changing geography of production
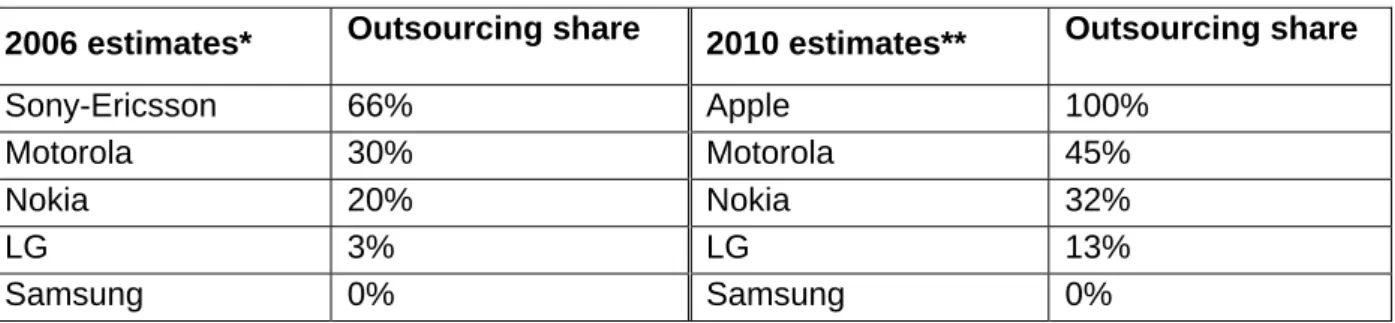
Mobile phone value chains have become fragmented and geographically decentralized since the late 1990s. One driver of this process is outsourcing, especially to offshore firms specializing in manufacturing. Ericsson was the first European OEM to outsource mobile phone manufacturing, in 1997, to then burgeoning EMS firms, Flextronics and Solectron. The move was followed by others like Siemens, which were forced to cut costs after the IT bubble burst in the early 2000s. However, outsourcing is still less common in mobile phones than it is in other electronics. Only about 30 percent of mobile phones are produced through outsourcing, whereas more than 90 percent of game consoles and laptops are (NIPA 2011). Also, despite the rise of outsourcing, as shown in Table 1, there is a marked difference among lead firms in the degree to which their mobile phones are produced, or, more precisely, assembled, by contract manufacturers.
9
These two possibilities – product vs. process upgrading – are inherent in the usage of unit values as a measure of economic upgrading because increased unit value may occur because of exporting higher-end products (product upgrading), but at the same time because of productivity losses (process downgrading). Furthermore, export unit values may drop across countries as a result of overall productivity gains (e.g. new technology) or lowering input prices.
10
Table 1: Mobile phone production outsourcing – selected OEMs, 2006 and 2010
2006 estimates* Outsourcing share 2010 estimates** Outsourcing share
Sony-Ericsson 66% Apple 100%
Motorola 30% Motorola 45%
Nokia 20% Nokia 32%
LG 3% LG 13%
Samsung 0% Samsung 0%
Source: * Wilde and de Hann (2006); ** NIPA (2011).
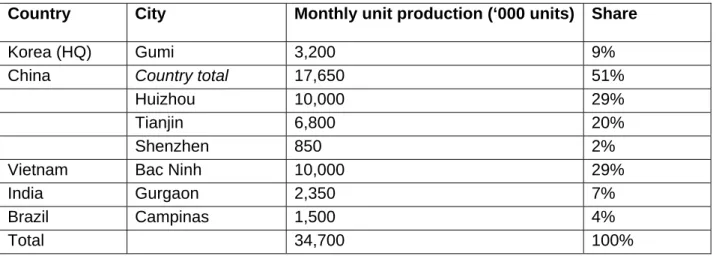
Another driver of value chain decentralization is firms relocating low-value-added activities or product lines to their affiliates in low-cost countries. Nokia, for example, opened its factories in China, Mexico, Brazil and Hungary in 1995-1999. Its global expansion continued in the latter 2000s as it built factories in India, Romania and Vietnam, while closing factories in Germany and cutting capacity in Finland (Nolin and Grundberg 2012). According to a 2009 estimate, 52 percent and 30 percent of Nokia’s total output came, respectively, from China and India, while Finland contributed just 3 percent of its output (Fuji Chimera Research Institute 2009). Similarly, three Chinese factories and a new Vietnamese factory accounted for 80 percent of Samsung’s total unit production capacity of mobile phones in 2011, and its factory in Korea churned out only 9 percent of total output, although it produced mainly high-value-added advanced smartphones (Kim 2012). It is noteworthy that the production locations of these two leading OEMs, Nokia and Samsung (Tables 2 and 3), are closely associated with the countries in the export ‘leader’ group (see Figure 3). China, Mexico, Hungary and Brazil, where Nokia and Samsung expanded their presence significantly from the mid-1990s, have been the major exporters of mobile phones, and the countries hosting new factories, that is, India, Vietnam and Romania, have all experienced a significant rise of mobile phone exports in recent years. This confirms the importance of lead firms in a country’s GVC export performance.
Table 2: Nokia’s overseas production facilities
Country City Establishment year
Finland (HQ) Salo 1979 South Korea Masan 1984
China Beijing 1995 China Dongguan 1995 Mexico Reynosa 1996 Brazil Manaus 1998 Hungary Komárom 1999 India Chennai 2006 Vietnam Hanoi 2012
Source: Nokia website.10
10
http://www.nokia.com/global/about-nokia/about-us/production-facilities/production-facilities/ (accessed 17
January 2013). At the end of 2011, Nokia closed down its Cluj, Romania, factory, to which it had moved its mobile phone production in 2008 from Bochum, Germany (Thorpe, 2011).
11
Table 3: Samsung’s mobile phone production capacity by factory location, 2011 Country City Monthly unit production (‘000 units) Share
Korea (HQ) Gumi 3,200 9%
China Country total 17,650 51%
Huizhou 10,000 29%
Tianjin 6,800 20%
Shenzhen 850 2%
Vietnam Bac Ninh 10,000 29%
India Gurgaon 2,350 7%
Brazil Campinas 1,500 4%
Total 34,700 100%
Source: Kim (2012).
Concentration along the value chain: lead firms and contract manufacturers
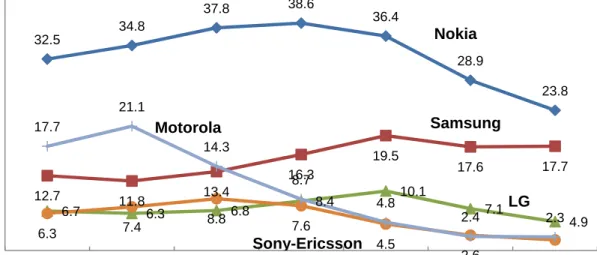
The offshoring of mobile phone value chains has not led to the wide dispersion of chain activities across the world. Rather, production has become highly concentrated in certain geographic areas, in part because fewer lead firms dictate the geography of mobile phone production. In 2005-2009, more than 75 percent of the global mobile phone market (in units) was accounted for by the five largest OEMs, or the ‘Big Five’: Nokia, Motorola, Samsung, Sony-Ericsson and LG (see Figure 5). Their market domination has weakened since 2009, when Motorola and Sony-Ericsson began to struggle and new entrants like Apple and Research In Motion (RIM) gained market share in the fast-growing smartphone market.11
When looking at the entire mobile phone market, we observe decreased consolidation in the past few years. However, the picture is quite different in high-end market segments or in terms of profit share. At the fourth quarter of 2011, just two lead firms, Apple and Samsung, accounted for 46 percent of global smartphone sales. More strikingly, as Figure 6 shows, these two lead firms absorbed 99 percent of the industry’s operating profits, while other OEMs continue to struggle in generating profits, particularly in a fast-growing smartphone market (Dediu 2012). In this regard, consolidation has increased in the high-value-added product segments in the mobile phone value chain.
The effect of lead firm consolidation on geographic concentration of mobile phone GVCs is intensified by the co-location of component suppliers with their OEM or EMS buyers. For example, many Finnish component suppliers for Nokia moved to China and later India to follow Nokia, locating in the same special export zones (SEZs) as their key customer. Similarly, many Korean suppliers have moved to or set up new factories in China and Vietnam to cater to their main buyer, Samsung. The demand of shorter lead time from design to market and closer buyer–supplier coordination increases the incentives for both buyers and suppliers to get closer to each other in their global supply chains.12 The presence of capable suppliers also creates externalities that other buyers could benefit from, an incentive for them to move along.
11
As of the end of 2011, the combined share of the top five OEMs was 55 percent, the lowest since 2005 (Gartner, 2012). Another contributing factor to lower market share consolidation is the rise of non-brand, low-end phones in emerging markets over the last few years. The market is bifurcated into a consolidated high-end segment and a fragmented low-high-end segment (Dediu, 2012).
12
The Chief Executive Officer of a Nokia supplier that moved production from Finland to China said, ‘We are here because our customers are here. It is necessary for us to be logistically closer to them. The pace of
12
Figure 5: Global mobile phone market share – the Big Five, 2005-2011
Source: Gartner.13
Figure 6: Profit share by eight mobile phone vendors
Source: Dediu (2012).
Overall, geographic concentration and lead firm consolidation have generated a handful of manufacturing hotspots in mobile phone GVCs that are built around the clusters of extensive regional supply chains. A notable example is China, particularly the Pearl River Delta area, where
production is so intense that it is not possible to ship components from the other side of the world’ (Helsingin Sanomat 2005).
13
These figures are compiled from multiple reports and press releases in different years published by Gartner, an industry consultancy, including: ‘Market share: mobile terminals, worldwide, 4Q05 and 2005’ (27 February 2006); ‘Gartner says worldwide mobile phone sales increased 16 per cent in 2007’ (27 February 2008); ‘Gartner says worldwide mobile phone sales grew 6 per cent in 2008, but sales declined 5 per cent in the fourth quarter’ (2 March 2009); ‘Gartner says worldwide mobile device sales to end users reached 1.6 billion units in 2010; Smartphone sales grew 72 percent in 2010’ (9 February 2011); ‘Gartner says worldwide smartphone sales soared in fourth quarter of 2011 with 47 percent growth’ (15 February 2012).
32.5 34.8 37.8 38.6 36.4 28.9 23.8 12.7 11.8 13.4 16.3 19.5 17.6 17.7 6.7 6.3 6.8 8.4 10.1 7.1 4.9 6.3 7.4 8.8 7.6 4.5 2.6 1.8 17.7 21.1 14.3 8.7 4.8 2.4 2.3 0 5 10 15 20 25 30 35 40 45 2005 2006 2007 2008 2009 2010 2011 % Nokia Samsung LG Motorola Sony-Ericsson
major OEM alongside t Another no supply ch consolidati match the leading EM just two le percent of company, has since e Figure 7: G Note: The s in 2000 is t Source: IDC The key d providers i based EM associated result of th first develo Ericsson a acquiring t business e EMS firms When Eric now owned the mobile effect of th firms seek their buyer among EM 0% 10% 20% 30% 40% 50% 60% 70% 80% 90% 100% 2000 Ms like Nok their key su otable aspe ain consol ion in the E scale and s MS provider eading EMS f the entire starting as expanded a Global EMS share of firm he combine C (2011), cit developmen n North Am S firms like d with what he exit of fi opment rela and Siemen the assets entirely (Stu s acquired csson sold d by its EM e device bus he OEM se k economie rs. This sca MS firms, wh
kia and Sam uppliers. ect in mobil lidation. Th EMS busine speed of pro rs rose from S firms, Fl e EMS ma a compone aggressively S market s ms below the ed share of S ted in NIPA nts in the E merica and E e Foxconn a we have d rms falling ates to the i ns. Particula sold by OE rgeon and not only ph its factory t S supplier. siness, and gment was s of scale ale-building hich has acc
F S msung and e phone GV he concent ess, since E oduction req m 53 to 75 p extronics ( arket in 201 ent supplier y; in 2010, i share, 2000 e top five ea Sanmina and (2011). EMS marke Europe in th and shifting described in behind, an increasing o arly, many E EMs that h Kawakami 2 hysical ass to Flextroni As many E d a few maj s carried ov by acquirin g effort has celerated th Solectron Flextronics Celestica anmina-SCI Foxconn Others 2005 13 EMS firms VCs is the tration of EMS firms, quired by b percent in 2 Singapore) 10. Foxcon to IT firms, it accounted 0-2010 ach year is i d SCI, which et over the he late 199 g EMS prod n the OEM d geograph outsourcing EMS firms ad retreate 2011). ets like fac ics, it quick European O
jor EMS firm ver to the E ng more as also led to he consolida like Foxco co-evolutio market po to be succe ig OEM buy 2000-2010, and Foxco nn’s growth first entere d for 44 per ncluded in ‘ h have since decade w 0s and earl duction to A market: fir hic concent g and dives have expan ed from ma ctories, but kly became EMs, like S ms picked u EMS sector. ssets and o o the incre ation proces Jabil Circuit 20
onn and Fle
on of OEMs wer among essful and yers. The m as Figure 7 onn (Taiwa h is particu ed the EMS rcent of the Others’; the e merged. ere: (1) the ly 2000s; an Asia in the rm-level con tration of pr titure of mo nded their p anufacturing also skills the first cu Siemens and up their ass In a thin-m outsourcing ase of mer ss. t 010 extronics ar s and EMS g OEMs h grow, have market share 7 shows. Fu an), accoun ularly impre business in global EMS e share of Sa e emergenc nd (2) the r mid-2000s. nsolidation roduction to obile phone production c g or the mo and custom ustomer of d Sagem (F sets, the co margin busi orders or rgers and a e all based in terms of has led to e needed to e of the five urthermore, nted for 59 essive. The n 2001, and S market. anmina-SCI ce of EMS ise of These are partly as a o Asia. The OEMs like capacity by obile phone mer bases. the factory France), left onsolidation ness, EMS diversifying acquisitions d f o o e , 9 e d I S -e a e e y e . y t n S g s
14
The rise of Foxconn as the leading EMS provider is emblematic because it parallels the emergence of big buyers like Apple in mobile phone GVCs. The revenues of Taiwan-based Hon Hai Precision (Foxconn’s trading name) grew more than 10 times in 2001-2008, from $4.4 billion in the year it first adopted an EMS model to $61.8 billion.14 Foxconn International Holdings (FIH), Hon Hai’s mobile phone manufacturing unit, increased its sales from $7.6 million in 2001 to $10.7 billion in 2007, the highest level before the ensuring recession.15 In 2010, half of FIH’s net sales came from Asia. The growth of Foxconn relied on a few big buyers. In 2008, 91 percent of FIH’s sales came from three largest buyers (Apple is believed to be one of them)16 and the largest buyer represents 43 percent of the sales. While the share has since declined as a result of the company’s recent efforts to diversify its clientele, the top three buyers still represented 70 percent of FIH’s sales in 2010 (the leading buyer’s share was 28 percent).17
Foxconn’s functional upgrading from a small IT component supplier to the world’s largest electronics assembler over the decade also benefited from the regionalization of mobile phone supply chains in East Asia, where most of the company’s production facilities are located. The clustering of supplier bases in China and neighbouring Asian countries gave Foxconn an advantage over its Western competitors, which began to move to the region only in the mid-2000s. Foxconn tries to maintain the advantage of its lower-wage labour force in China by relocating to inland regions.18
The company’s other strategy to compete in the thin-margin EMS segment is vertical integration. Unlike other EMS firms that tend to provide only manufacturing services like assembly and supply chain management, Foxconn engages actively in component manufacturing. This allows it not only to make up for lower margins in its EMS operation, but also to be able to supply buyers with components produced in-house at prices that are 10-30 percent lower than what its EMS competitors can do with independent suppliers (NIPA 2011). The fact that Foxconn has major electronics firms as its EMS buyers is also beneficial to its component business because this can make orders keep flowing into its higher-margin units.
Value distribution in mobile phone GVCs
Despite the concentration in both OEM and EMS segments, there is a great deal of disparity in mobile phone GVCs in terms of how much value the GVC actors in each segment can capture. As reported by a series of papers based on tear-down analysis data, value capture is highly skewed in favour of OEMs and high-end component suppliers and, to a less degree, mobile network operators (MNOs); conversely, contract manufacturers, including EMS firms and the suppliers of low-end, unbranded components, capture very little value.
In their research on three mobile phone models from Motorola, Palm (currently Hewlett-Packard) and RIM, Dedrick et al. (2011) find that assembly and test activities, which are conducted by EMS, account for only 4-7 percent of the factory costs for these mobile phones. About 70-80 percent of
14
http://www.foxconn.com/PullulateCourse.html (accessed 17 January 2013).
15
Reflecting the effect of weak global demands, FIH’s net sales continued to decline, to $6.4 billion in 2011
from $6.6 billion in the previous year (http://www.fih-foxconn.com/investors/Download.aspx?ID=500,
accessed 23 February 2013). 16
FIH’s annual reports provided revenues from those customers that accounted for more than 10 percent of the company’s revenue, while these customers were unidentified in the reports.
17
This information comes from FIH’s annual reports in 2005 and 2007 through 2010. 18
In 2011, inland regions accounted for 69 percent of Foxconn Group’s employment, while coastal regions represented only 31 percent. The ratio was in favour of coastal regions in 2010, 55 percent compared with 45 percent in inland regions (CLSA 2011, cited in NIPA 2011)
15
the factory costs are attributed to about a dozen high-end components, such as display modules, baseband processors and memory chips, which tend to be provided by specialized suppliers from the US, Japan, Germany and Korea; hundreds of other low-end components represent only 14-28 percent of the factory costs. A similar finding is reported for Nokia’s N95 model. Out of the €546 retail price, only 2 percent (€11.5) is attributed to final assembly, while 33 percent goes to a variety of components, 14 percent to distribution and retailing, 4 percent to software and licences and finally 49 percent to the value added by Nokia, including final assembly, support functions and its profits (Ali-Yrkkö et al. 2011).19
These findings suggest, first, that economic upgrading has different effects on value capture, depending on the type and path of upgrading. Upgrading to EMS, as Foxconn did, has a limited effect on the value capture of the upgrading firm. EMS firms have to manage a very slim margin per unit. For example, FIH’s operating profit (OP) in 2001 was 42 percent of its net sales, but since 2005, when Hon Hai became the world’s largest EMS, its OP has never exceeded 7 percent of net sales in any given year. In 2001-2007, FIH’s net sales grew 1,405 times while its OP rose only 244 times, which is still impressive but does not match its phenomenal sales growth.20 This appears to explain why many EMS firms seek economies of scale to maintain a minimum level of overall profits.
Meanwhile, the path of HTC, a Taiwanese mobile phone producer, shows a contrasting pattern. HTC was founded in 1997 and worked as an outsourcing supplier for Microsoft’s music player during the early 2000s. Then, in 2006, HTC first launched its own branded smartphone for T-Mobile, and it introduced the world’s first smartphone powered by Google’s Android operating system (OS) in 2008. Since then, it has expanded its global market share with its branded smartphones, and HTC became the second largest smartphone maker in the US market in 2011, after only Apple.21 This upgrading to brand manufacturing boosted its profits. In 2001, HTC’s operating profit was just 2 percent of its net sales, but it grew to 18 percent in 2005 and 26 percent in 2007, and it has maintained a profit rate above 15 percent since then.
Second, because value chain decentralization relates closely to the shifting and concentrating geography of production, this disparity of value capture between chain actors also has implications for value distribution between regions and countries. While Apple’s iPhones are manufactured and assembled primarily in China, where the value captured by the assembler, Foxconn, is 3.6 percent ($6.50) of the total factory costs of making one unit of the iPhone ($178.96), China captures much less value than firms from its neighbours, like Japan and Korea, or American and German firms do by supplying high-end components for iPhones (Xing and Detert 2010). Similarly, in the case of Nokia’s N95 assembled in China, 39 percent and 12 percent of its value is attributed to Finland and other European Union (EU) countries, respectively, and 28 percent to North American countries where high-value-added activities are conducted, whereas Asia’s share is just 16 percent (Ali-Yrkkö et al., 2011).
In short, the co-evolution of high levels of concentration along the mobile phone GVC does not provide consolidated chain actors in different segments with equal power. Value distribution is
19
Nokia assembled N95 phones in its own factories in Finland and China, so 2 percent of the retail price attributed to final assembly is included Nokia’s 49 percent share of value added.
20
This is based on our own calculation with the data from FIH’s annual reports from 2005 through 2010. 21
http://blog.nielsen.com/nielsenwire/online_mobile/nielsens-tops-of-2011-digital/ (accessed 17 January
16
highly skewed in favour of a handful of OEMs and high-end suppliers, while EMS firms, despite their growing size in revenues, capture a much smaller value.
Social upgrading in mobile phone manufacturing GVCs: changing dynamics in
employment and wages
The question addressed in this section is whether the GVC dynamics identified above made any difference to social upgrading in developing countries. Social upgrading is defined in three aspects: (1) increasing employment and wages; (2) improving the quality of working conditions; and (3) enhancing labour rights (Barrientos et al. 2011). The initial variable deals with quantifiable measures; the other two aspects are relatively qualitative. In this paper, we examine the first aspect only, that is, the change in employment and wages, using national labour statistics and firm-level employment data with a focus on advanced developed economies, that is, the US and European countries, and two emerging economies, that is, China and India.
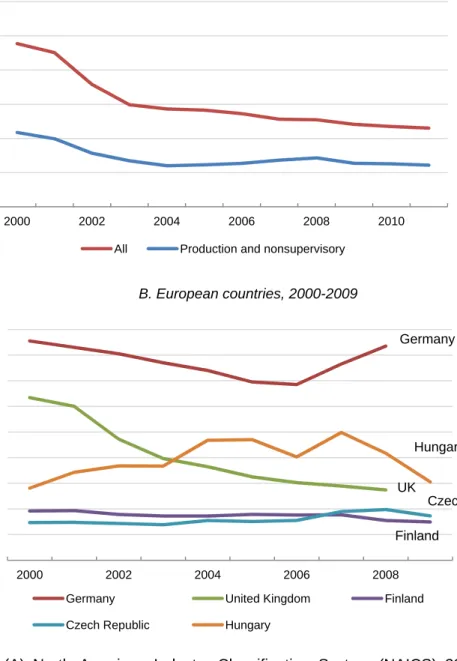
Our analysis of national labour statistics shows a significant shift of manufacturing employment in mobile phone manufacturing GVCs from advanced industrial economies to emerging economies.22 In 1997-2004, over a million electric/electronic manufacturing jobs disappeared in the US, Germany and Japan (ILO 2007). As Figure 8 shows, American employees in communication equipment manufacturing dropped in 2000-2010 by 52 percent, from 238,600 to 117,400, and the number of production/non-supervisory workers decreased by 44 percent, from 108,700 to 60,800. Similarly, in the UK and Germany, employment in the radio, television and communication equipment manufacturing sector declined, respectively, by 52 percent and 20 percent in 2000-2006, although the trend was later reversed in Germany. Employment also decreased in Hungary and Finland in 2005-2009, by 35 percent and 16 percent, respectively. Among 18 Organisation for Economic Co-operation and Development (OECD) countries that report employment figures for this sector, only the Czech Republic and the Slovak Republic added new jobs in 2005-2009 (increases of 14 percent and 31 percent, respectively).
Because data categories used here cover broader sectoral activities than mobile phone manufacturing,23 any inference from these figures ought to be drawn carefully concerning the effects of mobile phone GVCs on employment. It is interesting, however, to note that export growth appears to have contrasting impacts on job growth in Hungary and the Czech Republic, two economic upgraders in our analysis (Figure 4 above). Also, Finland’s job losses are likely to persist if its flagship company Nokia, facing a declining global market share, continues to shed jobs at home and move production abroad (Nolin and Grundberg 2012).
22
National labour statistics tend not to be disaggregated enough to allow us to look at employment in mobile phone manufacturing; therefore, depending on the availability of data, we have to use a larger category that includes mobile phone manufacturing, such as radio, television and communication equipment manufacturing, or, more broadly, electronics and telecommunications.
23
17
Figure 8: Employment changes in communication equipment manufacturing in the US and selected European countries (unit: thousands)
Note: (A) North American Industry Classification System (NAICS) 3342 (communication equipment manufacturing); (B) ISIC (ver.3) 32 (radio, television and communication equipment manufacturing). Source: (A) US Bureau of Labor Statistics; (B) OECD Structural Analysis Database (STAN).
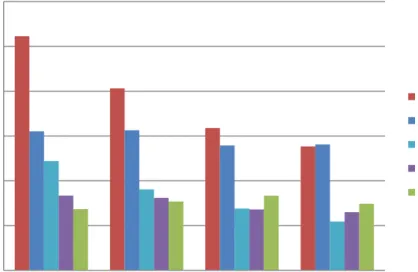
The effect of increased offshore production on employment is evident when we look at the changing occupation composition of the communication equipment sector. For example, in the midst of the overall decline of employment in the US, from 166,410 to 113,000 between 2002 and 2011, production occupations (e.g. electronics assemblers) recorded the largest job losses, while the number of high-skilled jobs like ones in engineering and computer sciences decreased only slightly (see Figure 9). The relatively solid performance of the latter types of jobs suggests the growing importance of software and applications activities in mobile phone GVCs.
0 50 100 150 200 250 300 2000 2002 2004 2006 2008 2010 A. The US, 2000-2011
All Production and nonsupervisory
0 20 40 60 80 100 120 140 160 180 2000 2002 2004 2006 2008 B. European countries, 2000-2009
Germany United Kingdom Finland
Czech Republic Hungary
Germany
Hungary
UK
Finland
18
Figure 9: Employment in US communication equipment manufacturing by occupation, thousands
Source: Occupational Employment Statistics (OES), US Bureau of Labor Statistics.24
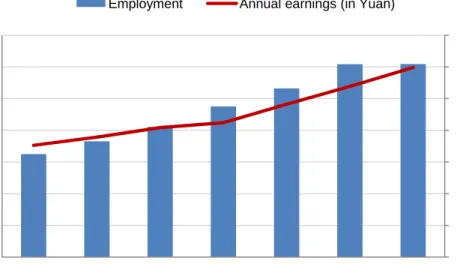
In contrast, employment has grown steadily in the developing countries with significant export growth. Take the examples of China, the world’s largest mobile phone exporter, and India, one of the fast growing exporters in the past few years (Figure 10). In China, electronics and telecommunication manufacturing almost doubled its employment, from 1.6 billion to 3 billion between 2002 and 2008, increasing its share in urban manufacturing employment from 5.4 percent to 8.9 percent. The sector’s growth rate, 88 percent in 2002-2008, exceeded that of the total industrial sectors, 15% (Banister and Cook 2011). In India, the growth of employment in communication equipment manufacturing, albeit still fluctuating, has emerged since 2005-2006. Although this industrial category represents broader activities than mobile phone manufacturing, both Nokia and Samsung began to operate their mobile phone factories in India in around 2006. In wages, an average Chinese employee in the electronics and telecom manufacturing sector earned 29,915 Yuan per year (or $4,304) in 2008, 23 percent higher than the average for all urban manufacturing (24,404 Yuan, or $3,511), indicating that the sector provided relatively high-paying jobs in China.25 Wage growth in the sector, however, was much slower compared with overall manufacturing and other key industries. In 2002-2008, the average wage grew by 70 percent in electronics and telecom manufacturing, while wages rose by on average 119 percent, 124 percent and 120 percent in all manufacturing, textiles and transportation equipment, respectively. The growth rate was higher in 2005-2008 (41 percent) than in 2002-2005 (20 percent), but in both periods the sector underperformed all the other three sector categories. Meanwhile, in India, wages began to increase from 2008 in communication equipment manufacturing only after the sector experienced the growth of employment and exports in 2006-2007.
24
NAICS 3342 (communication equipment manufacturing). Related OES data are available at
http://www.bls.gov/oes/oes_dl.htm (accessed 12 January 2013).
25
The Chinese Yuan is converted into the US dollar at the ratio of 6.95 to 1, based on the US Federal Reserve Bank’s Annual Foreign Exchange Rates G5.A, released 6 January 2011
(http://www.federalreserve.gov/releases/g5a/20110818/, accessed 17 January 2013).
0 10 20 30 40 50 60 2002 2005 2008 2011 Production
Architecture & Engineering Office & Admininstrative Support Management
19
Figure 10: Telecommunication manufacturing employment, China and India
Note: (A) electronics and telecom manufacturing; (B) communication equipment manufacturing (NIC-1998 & NIC-2004, 322; NIC-2008, 263).
Source: (A) Banister and Cook (2011); (B) India’s Annual Survey of Industries, each year.
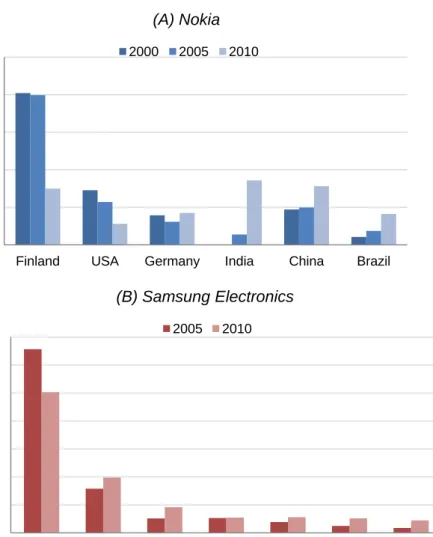
The shift of employment in mobile phone GVCs is also observed in firm-level data. As Figure 11 shows, Finland, Germany and the US were Nokia’s three largest operating countries in 2000 by employment, but these countries’ share in the OEM’s employment declined by the end of the decade. In 2000-2005, nearly 40 percent of Nokia employees were in Finland, but by 2010 the share dropped to 15 percent.26 The dynamic growth of Nokia’s employment has taken place in emerging economies. China, India, Mexico, Brazil and Hungary accounted for 71 percent of all the new jobs created in Nokia in 2000-2010. In 2010, India and China surpassed Finland for the first time in the number of the country’s Nokia workers. It is not surprising that these countries are among those where Nokia set up its own factories during the period (see Table 2 above).
26
Because the number of Nokia’s employees more than doubled in the period, actual job losses in Finland were not as pronounced as the percentage drop might suggest, but about 4,500 jobs disappeared in the company’s home country in 2000-2010.
-5 10 15 20 25 30 35 0.0 0.5 1.0 1.5 2.0 2.5 3.0 3.5 2002 2003 2004 2005 2006 2007 2008 Thous a nds Millions (A) China, 2002-2008
Employment Annual earnings (in Yuan)
-2 4 6 8 10 12 14 16 -10 20 30 40 50 60 70 80 2001 2003 2005 2007 2009 Thous a nds Thous a nds (B) India, 2001-2010
20
Meanwhile, Samsung’s employment shift was less dramatic. It continued to have the largest share of its employees in Korea, although the share dropped from 66 to 50 percent in 2005-2010. Notable growth occurred in China and Southeast Asia (e.g. Vietnam), Samsung’s major offshore mobile phone production locations. In 2010, these represented 20 percent and 9.2 percent of Samsung’s global workforce, respectively.
Figure 11: Employment shift in lead firms – Nokia and Samsung
Source: (A) Nokia’s annual reports; (B) Samsung Electronics’ annual reports.
While the cases of Nokia and Samsung show the geographic shift to varying degrees of employment in lead firms, the Foxconn case illustrates the effect of concentration in mobile phone manufacturing, particularly for EMS firms. The rapid rise of a giant employer would have not been possible but for GVC concentration. In 2001, when Hon Hai Group started as an EMS supplier, it employed only 47,000 workers, but in 2011 its employees amounted to 1.3 million. The company is the largest private employer in China and the world’s third largest employer, only after Wal-Mart and McDonald’s (Alexander 2012). The million Foxconn employees in China equals almost one-third of the country’s entire urban employment in 2008 in electronics and telecommunication manufacturing (Figure 10 above), showing how a single company can become a critical force behind generating employment when GVCs are concentrated. In this regard, the Foxconn case illustrates the relationship of geographic and organizational GVC concentration and employment concentration, both for China and for a single firm.
0% 10% 20% 30% 40% 50%
Finland USA Germany India China Brazil
(A) Nokia 2000 2005 2010 0% 10% 20% 30% 40% 50% 60% 70%
Korea China Southeast Asia North America Europe Rest of Asia ROW (B) Samsung Electronics 2005 2010
21
Discussion and conclusion
In this paper, we have examined the relationship of economic and social upgrading in the case of mobile phone manufacturing GVCs. We have asked, specifically, how these GVCs are changing the dynamics of trade, production and value creation and capture in developing countries, and how those dynamics are affecting the social upgrading of workers in GVCs in terms of employment and wages. We have analysed this relationship over the past decade, using international trade data and production and employment data at both country and firm levels.
The analysis highlights an extraordinary level of concentration and selectiveness in production and trade at both country and firm levels. Only a handful of countries and firms managed to achieve economic upgrading in a sustainable manner, while many of the rest were excluded or marginalized from the mobile phone GVC. This high degree of consolidation and exclusion resulted from co-evolution or interaction between different GVC aspects (geographic and organizational concentration) as well as between different chain segments (OEMs and EMS firms). One form of concentration reinforced concentration in other areas, mutually enforcing the benefit of value chain inclusion and the disadvantage of exclusion.
The effect of concentration is further amplified by the co-location of supply chains and the regionalization of production. By having their key suppliers move closer to their production locations, lead firms have reinforced the significance of the co-evolution pattern, and at the same time challenged with higher entry barriers less developed countries or mid- and low-end firms that are eager to enter their supply chains. Even the question of whether manufacturing jobs for Apple products could return to the US confronts the suggestion that it would not feasible as long as the most capable suppliers are all clustered in East Asia (Duhigg and Bradsher 2012). Yet, being a manufacturing hotspot for foreign firms is one thing; the economic upgrading of local firms is another. It is reported that the domestic value added in China’s processing exports of telecom equipment remains relatively low – about 35 percent in 2007 (Koopman et al., 2008). In a concentrated GVC, many are called but few are chosen, and fewer are able to upgrade.
Our GVC analysis highlights the important role of lead firms and big suppliers in shaping the geography of production and trade in mobile phone GVCs. The findings presented here illuminate a close linkage between the production locations of major OEMs and EMS providers, and export and employment growth. The rapid growth of Foxconn would have been unimaginable without the presence of large customers like Apple, and the latest take-off of mobile phone production in India and Vietnam would have not been possible but for the arrival of major OEMs like Nokia and Samsung. This does not mean these lead firms have the complete freedom to locate and relocate their production wherever and whenever they please. As the latest struggle of Nokia exemplifies, lead firms constantly confront intense competition as new technology, firms and markets are introduced. While the global OEM market is highly concentrated, the winners and losers are always changing, with the struggle of Motorola and Sony-Ericsson, and the rise of Apple, being only the latest examples.
One important issue related to the high degree of geographic concentration of lead firm production and supply chains is whether these firms and chains now become less mobile or footloose (CIVIDEP-SOMO 2010). To put it in another way, the question is whether mobile phone GVCs, as a result of geographic concentration, are likely to be more embedded in a certain locale, society or national and local governance system. If they are, it might increase the leverage or bargaining power of workers and non-governmental organizations (NGOs) so they can bring more pressure
22
on lead firms and their suppliers to improve labour conditions. It is certainly possible that, because extensive networks of capable suppliers, particularly in East Asia and China, may not be easily replaceable or replicable in another region or country, lead firms would have to accommodate the demand for social upgrading in order to keep their supply chains working. Also, an exceptional level of worker concentration at a single factory or city provides a fertile ground for the rise of strong labour activism.27 Such mega-factories can quickly exhaust local labour supply and, in the face of a declining influx of migrant workers, as in China, this can further limit the choice of lead firms and their suppliers. But, at the same time, lead firms can still move to another location to take advantage of lower wages, new labour supply and regulation rents (e.g. government concessions), as shown in the case of production migration within a country (e.g. Foxconn’s move in China from coastal regions to inland regions) and to neighbouring countries (e.g. Samsung’s move from China to Vietnam).
Another challenging question is the impact of the rising demand from emerging economies on social upgrading. While this is the topic for another paper, the growth of mobile phone consumption in developing countries is an important factor in current and future lead firm competition. As noted above, the past couple of years has witnessed the rapid increase of non-branded mobile phones in the global market, targeting the less quality-conscious or ‘bottom of the pyramid’ consumer in developing countries. Until 2009, the share of unbranded mobile phones (classified as ‘Others’) remained less than 20 percent of global shipments, but it reached 30 percent in 2010 and 34 percent in 2011, and is expected to rise (Gartner 2012). This bifurcates the mobile phone market into the high-end smartphone market dominated by a few OEMs and the low-end phone market populated by fragmented unbranded phone manufacturers, notably ‘Shanzhai’ phone producers in China (Brandt and Thun 2011; Zhu and Shi 2010). The popularity of non-branded phones is even challenging lead firms whose bottom line are based on selling a large volume of basic feature phones, what is called the ‘low-end disruption’ in the mobile phone market (Dediu 2012). In this regard, shifting end markets to emerging economies is likely to accompany market/GVC segmentation or bifurcation, presenting different opportunities and challenges in social upgrading in various GVCs.
27
Some of Foxconn’s factories in China, for example, hire more than 100,000 workers. The three largest ones in terms of employment are Shenzhen (390,000 workers), Zhengzhou (192,000) and Chengdu (110,000) (Hille and Jacob, 2012).
23
References
Alexander, R. (2012). ‘Which is the world's biggest employer?’ BBC News, 20 March.
Ali-Yrkkö, J., Rouvinen, P., Seppälä, T. and Ylä-Anttila, P. (2011). ‘Who captures value in global supply chains? Case Nokia N95 Smartphone’. Journal of Industry, Competition and Trade 11: 263-278.
Banister, J. and Cook, G. (2011). ‘China's employment and compensation costs in manufacturing through 2008’. Monthly Labour Review 134: 39-52.
Barrientos, S., Gereffi, G. and Rossi, A. (2011). ‘Economic and social upgrading in global production networks: A new paradigm for a changing world’. International Labour Review 150: 319-340.
Bernhardt, T and Milberg, W. (2011). ‘Economic and social upgrading in global value chains: Analysis of horticulture, apparel, tourism and mobile telephones’. Capturing the Gains Working Paper 2011/06. Manchester: BWPI.
Brandt, L. and Thun, E. (2011). ‘Going mobile in China: Shifting value chains and upgrading in the mobile telecom sector’. International Journal of Technological Learning, Innovation and Development 4: 148-180.
CIVIDEP (Civil Initiatives for Development and Peace) (2010). ‘Changing industrial relations in India's mobile phone Manufacturing industry’. Amsterdam: SOMO.
Dediu, H. (2012). ‘The phone market in 2012: a tale of two disruptions’ (available at
http://www.asymco.com/2012/05/03/the-phone-market-in-2012-a-tale-of-two-disruptions/). Accessed 23 February 2013.
Dedrick, J., Kraemer, K.L. and Linden, G. (2011). ‘The distribution of value in the mobile phone supply chain’. Telecommunications Policy 35: 505-521.
Duhigg, C. and Bradsher, K. (2012). ‘How the US lost out on iPhone work’. The New York Times. 21 January.
Fuji Chimera Research Institute (2009). ‘Future market outlook of key devices for next generation mobile phone 2009’ (available in Japanese at http://www.fcr.co.jp/en/09_list.html). Accessed 23 February 2013.
Gartner (2012). ‘Gartner says worldwide smartphone sales soared in fourth quarter of 2011 with 47 percent growth’ (available at http://www.gartner.com/it/page.jsp?id=1924314). Accessed 23 February 2013.
Helsingin Sanomat (2005). ‘Perlos expanding in China’ (Available at
http://www.hs.fi/english/article/Perlos+expanding+in+China/1101979526819). Accessed 17 January 2013.
24
ILO (International Labour Organization) (2007). ‘The production of electronic components for the IT industries: changing labour force requirements in a global economy’. Sectoral Activities Programme TMITI/2007. Geneva: ILO.
Kaplinsky, R. and Readman, J. (2005). ‘Globalization and upgrading: what can (and cannot) be learnt from international trade statistics in the wood furniture sector?’ Industrial and Corporate Change 14: 679-703.
Kim, H.S. (2012). ‘Samsung Electronics restructuring overseas mobile phone production facilities, closing Shenzhen plants and increasing capacity in Vietnam and India’. Hankyung Daily, 20 March. Koopman, R., Wang., Z. and Wie, S. J. (2008). ‘How much of Chinese exports is really made in China? Assessing domestic value-added when processing trade is pervasive’. Working Paper 14109. Cambridge, MA: NBER.
NIPA (National IT Industry Promotion Agency) (2011). ‘The rise of EMS/ODM industry and its implications’. Seoul: NIPA.
Nishiguchi, T. (2001). ‘Coevolution of interorganizational relations’. In Nishiguchi, T. and Nonaka, I. (eds.), Knowledge Emergence: Social, Technical, and Evolutionary Dimensions of Knowledge Creation (pp. 197-222). Oxford, New York: Oxford University Press.
Nolin, A. and Grundberg, S. (2012). ‘Nokia completes talks on planned job cuts’. The Wall Street Journal, 23 March.
Sturgeon, T. J. and Kawakami, M. (2011). ‘Global value chains in the electronics industry: characteristics, crisis, and upgrading opportunities for firms from developing countries’. International Journal of Technological Learning, Innovation and Development 4: 120-147.
Sturgeon, T. J. and Lee, J.-R. (2005). ‘Industry co-evolution: a comparison of Taiwan and North American electronics contract manufacturers’. In Berger, S. and Lester, R. K. (eds.), Global Taiwan: Building Competitive Strengths (pp. 33-75). Armonk, NY: M.E. Sharpe.
Thorpe, N. (2011). ‘Romania's “Nokia City” hopes dashed’. BBC News, 22 December.
Vlasic, B., Tabuch, H. and Duhigg, C. (2012). ‘In pursuit of Nissan, a jobs lesson for the tech industry?’ The New York Times, 5 August 5.
Wilde, J. and de Hann, E. (2006). ‘The high cost of calling: critical issues in the mobile phone industry’. Amsterdam: SOMO.
Xing, Y. and Detert, N. (2010). ‘How the iPhone widens the United States trade deficit with the People's Republic of China’. Working Paper 257. Tokyo: ADBI.
Zhu, S. and Shi, Y. (2010). ‘Shanzhai manufacturing – an alternative innovation phenomenon in China: Its value chain and implications for Chinese science and technology policies’. Journal of Science and Technology Policy in China 1: 29-49.
25
economic and social upgrading
in global production networks
Published by:
Capturing the Gains
The University of Manchester
Arthur Lewis Building
Oxford Road
Manchester
M13 9PL
United Kingdom
www.capturingthegains.org
Capturing the Gains brings together
an international network of experts
from North and South. The research
programme is designed to engage
and influence actors in the private
sector, civil society, government and
multi-lateral organizations. It aims to
promote strategies for decent work
in global production networks and
for fairer international trade.