Structural Breaks and Volatility Spillover in South
Asian Economies
Hafiz Rauf Iqbal1*, Syed Kashif Saeed2, Syed Zulfiqar Ali Shah3
1International Islamic University Islamabad (IIUI)
2Pakistan Institute of Engineering and Applied Sciences, Islamabad
3Faculty of Management Sciences (FMS), International Islamic University Islamabad
(IIUI)
* Corresponding author: rauf.iqbal@iiu.edu.pk
Article History Abstract
Purpose - This study examines the volatility spillovers in the presence of structural breaks with specific reference to South Asian Capital markets. The global financial crisis of 2007-2009 has compelled policymakers to realize that financial instability has the potential to threaten economic stability and growth; therefore, managing the financial crisis is inevitable. To manage the impact of financial crises, understanding the dynamics of volatility spillover across various markets is imperative. This study has investigated the possible emergence of structural breaks in risk patterns after global financial crises in south Asian markets.
Methodology - Using the data from July 2002 to June 2016, employing the Exponential GARCH methodology.
Findings - This study finds a significant volatility spillover after the financial crisis of 2007-09. Therefore, the existence of a structural break in the risk pattern of south Asian capital markets cannot be fully rejected.
Policy Implications - This conclusion is of prime importance to policymaker in devising policy guidelines concerning financial crises Received 2019-11-22 Revised 2019-12-19 Revised 2020-01-11 Accepted 2020-01-14 Published 2020-01-20 Keywords Financial Crisis, Volatility Spillover, Structural Breaks,
Exponential Generalized Auto-Regressive Heteroscedasticity (EGARCH)
How to cite?
Iqbal, H. R., Saeed, S. K., & Shah, S. Z. A. (2020). Structural Breaks and Volatility Spillover in South Asian Economies SEISENSE Journal of Management, 3(1), 64-77.
doi:10.33215/sjom.v3i1.260
65
Introduction
The recent developments in the financial sector throughout the world have resulted in growth in international portfolio investment and free capital flows. These developments have consequently given rise to inter-linkages and interdependencies among the markets. This integration in markets has also resulted in vulnerability to external shocks. One empirical evidence of this integration is the Global Financial Crisis, which started from the United States and spread to other markets around the world(Hwang & Ogwu, 2016).
The characteristic of these financial markets to follow each other and fall simultaneously during the crisis period have raised concerns about the stability of the financial system and the effectiveness of international diversification strategies(Baur, 2006). Claessens and Forbes (2001) also highlight the same point noting that there is a general agreement in the academia that the financial crises spilled from the countries of their origin to other countries that had strong financial or trade ties with these countries. This sort of transmission of crisis or shock from one market to the other is termed as volatility spillover. Hamao, Masulis, and Ng (1990) define volatility spillover as effects from foreign stock markets on the variances of daytime returns of subsequently trading markets. Mulyadi (2009) states the presence of interdependence and co-movement among the global capital markets and posits that the co-movement stemmed from market integration can result in the transmission of shocks from one to another market as volatility spillover.
Various researchers are of the view that volatility spillover pattern changes significantly in the crisis period; however, once the crisis period is over, the pattern is supposed to be same as earlier. If the pattern of volatility spillover is permanently amended, then it is said that structural break has occurred (Lu Sui, 2016; Maderitsch & Jung, 2014; Natarajan, Singh, & Priya, 2014). There is a strand of literature that points out that structural break can occur due to the transmission of external shocks, significant information or decisions of policymakers as well (Lamoureux & Lastrapes, 1990; Malik & Hassan, 2004). Huang (2012) observes that significant information shocks in a market can originate structural change in the variance of other markets if they are integrated. Numerous empirical studies have confirmed that the volatility persistence is significantly reduced due to the transmission of major external shocks (Ewing & Malik, 2005; Malik & Hassan, 2004; Miralles Marcelo, Quiros, & Quiros, 2008).
This study investigates potential structural break in south Asian capital markets consequent upon global financial crises along with analysis of volatility spillover. We do so with the help of Bivariate EGARCH. The study contributes to the literature in more than one way. Up to the best information of authors, this is the first study which is covering all important and major economies of South Asia, i.e., Pakistan, India, Bangladesh, and Sri Lanka. In this way, the results of this study will be generalized for SAARC, which is a regional block for economic cooperation. Secondly, the inclusion of three developed nations’ stock markets makes the result relevant for international portfolio diversification as well. And thirdly, the event study analysis based on the global financial crisis for south Asian economies is another feature that makes this study a contribution to the literature.
The remainder of this paper is organized as follows. Section 2 presents the existing literature. In Section 3, data and methodology are presented. The results of statistical estimation have been discussed in section 4. And in the last, the conclusion has been presented in section 5.
Literature Review
Financial crises are not altogether a new phenomenon in capitalist economies. The last decade of the 20th century has already witnessed few, e.g., Brazilian financial crisis in 1999, the Ruble crises of 1998 in Russia, Asian Financial Crises of 1997-98, Exchange Rate Mechanism collapse in 1992, and Mexican Peso crisis of 1994.In the words of Mishkin (1991), the financial crisis is a disruption in money and capital markets due to
which “adverse selection and moral hazard problems become much worse so that financial markets are unable to efficiently channel funds to those who have the most productive investment opportunities.” In the past, such crises were a case of the local economy. However, the liberalization of financial markets has resulted in financial linkages. Thus, the phenomenon of volatility spillover is now talk of the town.
Volatility spillover can be defined as the impact of seemingly unrelated events among two or more than two stock markets within or outside the geographical boundaries of the country. Although there are positive spillover effects, the term is most commonly applied to the negative impact a domestic event has on other parts of the world, such as an earthquake, stock market crisis, or another macro event.
Various researchers have examined the volatility spillover, not only across different countries, rather than in different areas of economies as well. Natarajan et al. (2014) confirmed statistically significant spillovers to Australian and German markets from US markets. Choudhry and Jayasekera (2014), while studying European markets, have also confirmed similar results. In their study, they concluded an increase in volatility spillover between the major and the stressed economies of the European Union. Similar results are argued by Claeys and Vasicek (2014) while studying the European bond market. On the other hand, various studies have also confirmed volatility spillover from the US and UK stock markets to the Japanese stock markets (Hamao et al., 1990; Panayiotis Theodossiou, 1997).
Similar studies have also been conducted for south Asian economies as well. Saeed, Riaz, and Ayub (2013) have investigated the transmission of six financial crises shocks from developed economies to South Asian economies. Results suggest that South Asian economies are getting more integrated with the world markets resulting in greater volatility spillover from developed markets during financial crises. Abbas, Khan, and Shah (2013) have documented the existence of volatility spillover among China, Pakistan, India, Sri Lanka, USA, UK, and Singapore. They have also confirmed the presence of spillover between hostile countries of the region provided there are trade relations between them. Jebran and Iqbal (2016) showed evidence of significant bidirectional and sometimes unidirectional spillover of return and volatility between China, India, Pakistan, and Japan. Jebran, Chen, Ullah, and Mirza (2017) also investigated the volatility spillover among emerging stock markets from normal and turbulent time periods. Huo and Ahmed (2017) investigated the spillover effects generated due to recently introduced Shanghai-Hong Kong Stock Connect. They argue that after the introduction of new connects system, a weak and unstable co-integration relationship is found along with the increased level of conditional variances of both stock markets Habiba, Peilong, Hamid, and Shahzad (2019)also investigated the dynamics of volatility spillover among various Asian economies by employing an extended version of EGARCH.
Consequent upon the occurrence of global financial crises, researchers started examining the possibility of the presence of a structural break in capital markets. The structural break can be defined, in non-technical terms, like persistence and pronounced macroeconomic shift in the data generating process. The presence of structural breaks tends to produce erroneous or spurious statistical relationships among variables. Research shows that the sum of estimated autoregressive parameters will be heavily biased towards one in a GARCH model if structural breaks are not considered (Hillebrand, 2005). Similarly, Pettenuzzo and Timmermann (2011) argue that structural breaks can cause instability in an economic mode, which will result in faulty prediction. Several academicians believe that excessive volatility spillover, consequent upon financial crises, may result in structural breaks in the volatilities of the markets(Arago & Fernandez-Izquierdo, 2007; Hammoudeh & Li, 2008; Jose Luis Miralles Marcelo, 2008; Mcmillan & Wohar, 2011; Moore, 2009; Wang, 2014).
Aggarwal, Inclan, and Leal (1999) document that markets of developing economies have experienced numerous volatility structural breaks in the recent past. Some of these breaks were due to economic crises like periods of hyperinflation in Latin America, Mexican peso crisis, stock market scandal in India, and the October 1987 crash
67 that affected various stock markets around the world. Similarly, Jose Luis Miralles Marcelo (2008) document intra-market structural breaks in volatility while analyzing the spillover effect between large and small-cap portfolios in the Spanish stock market. Their results show structural changes in volatilities due to shock transmission among these portfolios. Hammoudeh and Li (2008)have found that the transmission of external shock results in a significant decline volatility persistence of the market. Similarly, occurrences of volatility breaks have been found in Japanese and Korean stock markets as a result of the spillover of external shocks (Kang, Cho, & Yoon, 2009).
Malik and Hassan (2004) also found similar results. They employed the ICSS algorithm to determine volatility shifts and then incorporated it with a modified GARCH model to ascertain the true impact of shocks on changes in volatilities. They found that volatility persistence is significantly reduced in the result of the transmission of major shocks. Further, Ewing and Malik (2005), Maderitsch and Jung (2014) confirmed sudden strong breaks in volatilities of markets due to shock spillover and that failing to incorporate these volatility shifts results in the overestimation of spillover effects.
South Asian economies were also greatly affected by Global Financial Crises. Still, up to the best of authors’ knowledge, no study has been conducted yet to examine whether structural breaks happened here or not. This is the contribution of this research paper.
Data and Methodology
This study intends to examine the phenomenon of volatility spillover in south Asian economies along with the occurrence of a possible structural break. In literature, various methodologies have been recommended for analyzing the transmission of shocks among various markets. ARCH/GARCH family of the model has been considered as one of the most suitable being able to identify volatility clustering. Therefore, the authors find it reasonable to employ the GARCH family of the model. This family of the model consists of many advanced and multivariate mode as well. For example. However, it has been witnessed that the utilization of more sophisticated models in economic and finance literature often leads to unnecessarily complicated results, which may seem glamorous econometrically but do not provide any significant marginal benefits. Therefore, keeping in view the specific requirements of this study, authors have decided to employ bivariate EGARCH to examine volatility spillover.
Nelson (1991) proposed the Exponential GARCH model. EGARCH not only handles one of the limitations of GARCH, i.e., the non-negative condition for all estimated coefficients but also helps to capture leverage effect. 2 2 2 2 1 1 1 ...Eq(1)
log
log
s r r t i t i i i i t t i i i i t i t i
Where
0, θi,
i, and
i are the coefficients to estimate. When
I<0, positive or good news results in a less volatile situation in comparison with negative or bad news. Considering up to one lag only, the EGARCH can be written as
2 2 1 1 1 2 1 1 .... 0... (2)log
log
t t t t t if Eq
2 2 1 1 1 2 1 1 ... 0... (3)log
log
t t t t t if Eq
The main agenda of this investigation is to analyze volatility transmission across various markets accordingly; the bi-variate EGARCH model has been used to estimate the effect of volatility spillover from one country into the other country. The pairwise estimation has been conducted in order to estimate volatility transmission among countries. The above bi-variate EGARCH model can be written as follows;
2 2 1, 1, 2 1,n , 1, 2 2 1, 1, ...Eq(4)
log
log
t m t m t t m t m t m t m
Where n denotes the country from whose volatility transmission is estimated into another country as denoted by m. The extent of volatility spillover from one country to another is measured by the coefficient δ.
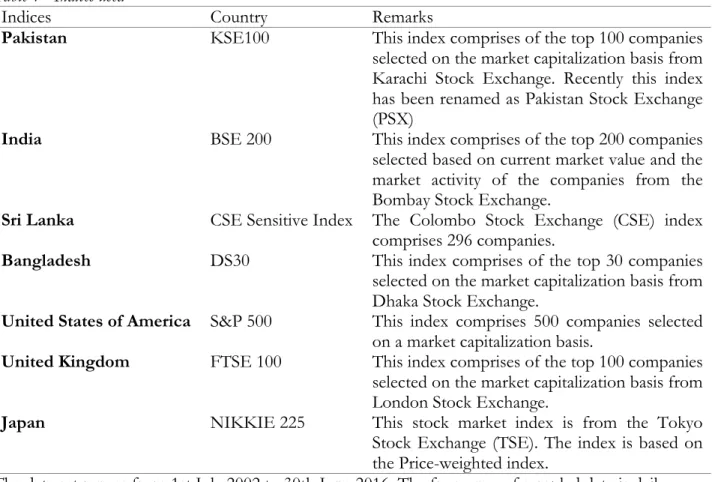
Our data set consists of stock indices of four major economies of South Asia, i.e., Pakistan, India, Sri Lanka, and Bangladesh. To capture the impact of global financial crises, the indices from three developed economies, i.e., USA, UK, and Japan, have also been included in our analysis. Table 1 represents the selected indices in our data set.
Table 1 - Indices used
Indices Country Remarks
Pakistan KSE100 This index comprises of the top 100 companies selected on the market capitalization basis from Karachi Stock Exchange. Recently this index has been renamed as Pakistan Stock Exchange (PSX)
India BSE 200 This index comprises of the top 200 companies selected based on current market value and the market activity of the companies from the Bombay Stock Exchange.
Sri Lanka CSE Sensitive Index The Colombo Stock Exchange (CSE) index comprises 296 companies.
Bangladesh DS30 This index comprises of the top 30 companies selected on the market capitalization basis from Dhaka Stock Exchange.
United States of America S&P 500 This index comprises 500 companies selected on a market capitalization basis.
United Kingdom FTSE 100 This index comprises of the top 100 companies selected on the market capitalization basis from London Stock Exchange.
Japan NIKKIE 225 This stock market index is from the Tokyo Stock Exchange (TSE). The index is based on the Price-weighted index.
69
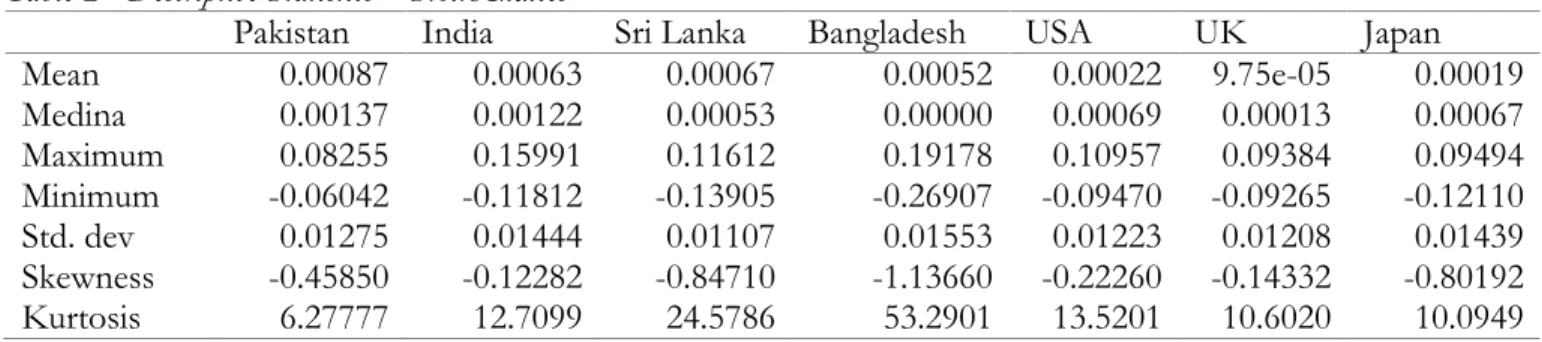
Table 2 - Descriptive Statistics – Stock Indices
Pakistan India Sri Lanka Bangladesh USA UK Japan
Mean 0.00087 0.00063 0.00067 0.00052 0.00022 9.75e-05 0.00019 Medina 0.00137 0.00122 0.00053 0.00000 0.00069 0.00013 0.00067 Maximum 0.08255 0.15991 0.11612 0.19178 0.10957 0.09384 0.09494 Minimum -0.06042 -0.11812 -0.13905 -0.26907 -0.09470 -0.09265 -0.12110 Std. dev 0.01275 0.01444 0.01107 0.01553 0.01223 0.01208 0.01439 Skewness -0.45850 -0.12282 -0.84710 -1.13660 -0.22260 -0.14332 -0.80192 Kurtosis 6.27777 12.7099 24.5786 53.2901 13.5201 10.6020 10.0949 For analysis of structural break, the sample is divided into two sub-samples, i.e., pre (July 01, 2002, to June 30, 2007) and post-crisis (July 01, 2009, to June 30, 2016) periods. National Bureau of Economic Research announced that the USA was facing depression since December 2007, which ultimately recovered in Mar 2009.Therefore to avoid any possible time overlapping, the period from Jul 01, 2007, till June 30, 2009, has been considered as the Global Financial Crisis period. Data has been gathered from Yahoo finance and the official website of the relevant stock markets. The justification sample period selection is based on the financial crisis period. As the study is being conducted in an event study environment, therefore, a reasonable sample period has been taken before and after the event has been selected.
July 2002-June 2007
Before Crisis period 5-Years before Crisis
July 2007-June 2009
The Crisis period
July 2009-June 2016
After the Crisis period 7-Years after Crisis
Results and Discussion
A common issue with the time series data is the existence of unit root, which leads to spurious results of the estimation. The stationarity of the data set has been checked using the Augmented Dickey-Fuller (ADF) Test and Philips-Perron (PP) tests. The total data set has been found stationary at first difference. The results of ADF and PP tests are as follows: -
Table 3 - Stationary Test at first difference
Countries / stock markets Augmented Dickey Fuller (ADF)
Test Philips-Perron(PP) Test
T-Statistics Probability T-Statistics Probability
Pakistan (PAK) -51.025 0.000 -52.138 0.000
India (IND) -53.698 0.000 -53.611 0.000
Sri Lanka (SL) -25.733 0.000 -49.146 0.000
Bangladesh (BNG) -61.538 0.000 -61.448 0.000
United States (US) -45.038 0.000 -64.2482 0.000
United Kingdom (UK) -29.814 0.000 -61.668 0.000
Japan (JPN) -58.634 0.000 -58.702 0.000
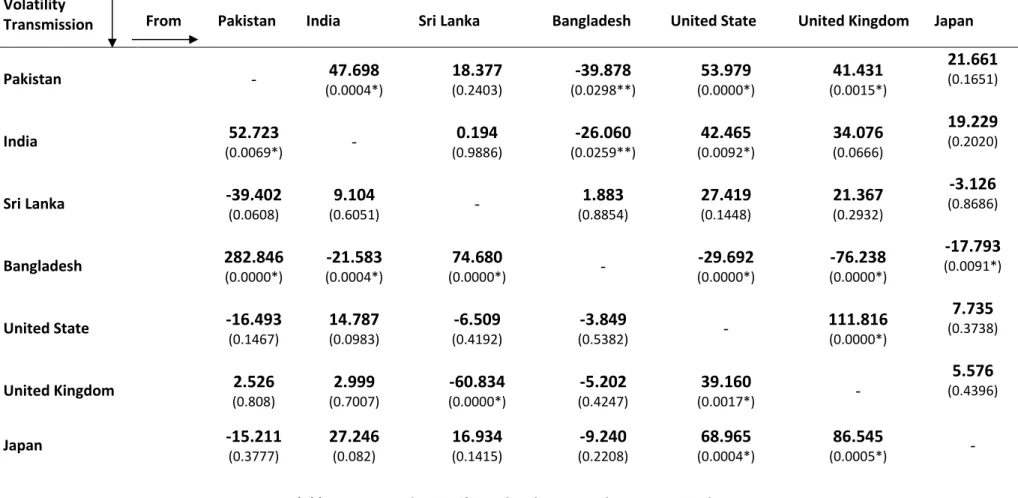
Pair-wise estimation of the model presented at Eq (4) has been conducted, in the model at Eq 4, the coefficient of our interest is only DELTA, which is representing the magnitude and sign of volatility spillover from market n to market m. The detailed results of this coefficient of the EGARCH model are presented in Table 4. The overall analysis of the results shows that the volatility spillover among the paired countries, i.e., spillover from the first country to the second and from second to the first in a single pair, is not identical. In some cases, there is a difference in magnitude of volatility spillover between the countries in a single pair, while in others the effects are not reciprocated at all, i.e., there is significant volatility transmission from the first country to the
second country in a pair however there is no spillover effect from later to the former. It is important to mention that overall results match with the general prudence criteria as well. For example, volatility spillover from the USA to Pakistan is significant at 1% (p=0.000, Coeff=53.979), whereas volatility spillover from Pakistan to the USA is insignificant even at 10% (p=0.1467, Coeff=-16.493). Similarly, volatility spillover from the UK to Pakistan is significant at 1% (p=0.0015, Coeff=41.431), whereas volatility spillover from Pakistan to the UK is insignificant altogether (p=0.8080, Coeff=2.526). The results of both of these two spillovers are very easy to understand, keeping in view the trade pattern and the level of remittances between these countries. Pakistan has even introduced Global Depository Receipts (i.e., GDRs) of one its biggest Oil exploration company, i.e., OGDCL. On similar lines, the results related to Japan do make sense as well.
Results within South Asian economies are quite eye-opener. There exists bi-directional volatility transmission significant at 1%, between India and Pakistan, even being considered an enemy state. Such results are corroborated with the studies by Abbas et al. (2013) and Saeed et al. (2013). Similarly, the bi-directional volatility spillover exists between Pakistan and Bangladesh; however, the impacts are not identical as it is in the case of India. The uni-directional phenomenon exists between Sri Lanka and Pakistan, where spillover exists at 10% from Pakistan, however, no spillover is evidenced from Sri Lanka.
Table 4 shows the presence of bi-directional spillover effects among some of the countries included in the study. On the other hand, some of the countries exhibit only un-directional volatility transmission. The bi-directional volatility spillover among countries highlights the high level of integration among these markets due to which these markets affect each other simultaneously in time of financial or business crisis. While some of the stock markets are not integrated enough to affect or to be affected by other stock markets. Further, developed markets such as the US or the UK also exhibit unidirectional volatility transmission with developing economies as they are immune to conditions in small markets like Bangladesh and Sri Lanka.
The results of volatility spillover for each country are mixed based on the individual country’s integration and trade links with other countries. Volatility transmission from the US, UK, and India into Pakistan is significant at α=1%, while transmission in Pakistan from Bangladesh is significant at α=5%. While spillover from Japan and Sri Lanka into Pakistan are statistically insignificant. The statistically significant spillover from the US, UK, and India indicates strong linkages of the Pakistani market with these countries. On the other hand, despite significant trade volume among Pakistan and Japan, the Pakistani market is not strongly linked with the Japanese market. The same is true for Sri Lanka and Pakistan. The spillover from Pakistan and the United States into India is significant at α=1%. While the same is significant at α=5% for Bangladesh. Transmission from Sri Lanka, United Kingdom, and Japan are insignificant.
The result of spillover from developed economies also presents interesting facts. The transmissions from the United States, United Kingdom, Japan, Bangladesh, India, and Pakistan to Sri Lanka are insignificant. This shows that the Sri-Lankan market is not integrated with other markets so far. Volatility transmission from all the countries included in Bangladesh is statistically significant. The possible reasons behind these results might be that Bangladesh is a tax-free zone, which ultimately attracts a huge amount of foreign investment due to which its market has become highly sensitive to conditions in foreign markets.
Developed economies such as the United States and the United Kingdom are considered resistant to shocks in most of the underdeveloped countries. The results of this study also confirm the same as the coefficients for volatility transmission for most of the developing economies are insignificant. Markets of the United States and the UK are affected by each showing that both markets are well integrated. While the result also shows that the coefficient of volatility transmission from Japan to the UK and US is statistically insignificant.
Table 4 -Coefficients of BI-VARIATE Exponential GARCH
Volatility
Transmission From Pakistan India Sri Lanka Bangladesh United State United Kingdom Japan
Pakistan - 47.698 (0.0004*) 18.377 (0.2403) -39.878 (0.0298**) 53.979 (0.0000*) 41.431 (0.0015*) 21.661 (0.1651) India 52.723 (0.0069*) - 0.194 (0.9886) -26.060 (0.0259**) 42.465 (0.0092*) 34.076 (0.0666) 19.229 (0.2020) Sri Lanka -39.402 (0.0608) 9.104 (0.6051) - 1.883 (0.8854) 27.419 (0.1448) 21.367 (0.2932) -3.126 (0.8686) Bangladesh 282.846 (0.0000*) -21.583 (0.0004*) 74.680 (0.0000*) - -29.692 (0.0000*) -76.238 (0.0000*) -17.793 (0.0091*) United State -16.493 (0.1467) 14.787 (0.0983) -6.509 (0.4192) -3.849 (0.5382) - 111.816 (0.0000*) 7.735 (0.3738) United Kingdom 2.526 (0.808) 2.999 (0.7007) -60.834 (0.0000*) -5.202 (0.4247) 39.160 (0.0017*) - 5.576 (0.4396) Japan -15.211 (0.3777) 27.246 (0.082) 16.934 (0.1415) -9.240 (0.2208) 68.965 (0.0004*) 86.545 (0.0005*) - *,** represents the significant level at 1% and 5% respectively
The results of Japan present a somewhat strange picture. In spite of significant trade volume between Japan and South Asian economies, i.e., Indian, Pakistan, Bangladesh, Sri Lanka, the coefficient of volatility transmission is statistically insignificant, indicating the lack of inter-dependencies of these economies and Japan. Volatility transmission into Japan from the United States and the United Kingdom is significant at α=1%. The influence of the markets of the United States and the United Kingdom are significant due to the interdependency of these markets.
EGARCH with Dummy Variable
One important objective of this study is to investigate the existence of structural break and its impact on volatility spillover in the capital markets of south Asian economies. It is believed that excessive volatility spillover, consequent upon financial crises, may result in a break in the data generating process, commonly known as structural breaks(Mcmillan & Wohar, 2011).
Econometrics literature provides various mechanisms to identify the breaks in the data generating process. However, using the classic concept of “simple is beautiful,” this study uses the dummy variable in an event study environment to investigate the effect of global financial crises on post crises volatility patterns.
An alternative methodology, instead of introducing a dummy variable, can be to estimate the model independently for pre-crisis and post-crisis data and then comparing the results. However, estimating the model into two parts, i.e., pre-crisis and post-crisis, leads to the loss of a degree of freedom. Therefore, introducing a dummy variable for the post-crisis period seems a better option.
For examining the breaks in the data generating process consequent upon global financial crises, the first step is to identify the period representing global financial crises. National Bureau of Economic Research announced that the USA was facing depression since December 2007, which ultimately recovered in Mar 2009.Therefore, to avoid any possible time overlapping, the period from Jul 01, 2007, till June 30, 2009, has been considered as the Global Financial Crisis period (i.e., Event Window) in this study. The sample has been divided into two sub-samples, i.e., pre-crisis subsample comprising of data from 1st July 2002 to 30th June 2007, and post-crisis subsample comprising of data gathered from 1st July 2009 to 30th June 2016. Whereas the data related to the crisis period, i.e., from 1st July 2007 to 30th June 2009, have been excluded from the analysis altogether. To incorporate the dummy variable, we have augmented our basic model with another coefficient. Dummy variable has a value of zero for the pre-crisis period, whereas 1 for the post-crisis period. Now the augmented EGARCH-Dummy model is as follows:
2 2 1, 1, 2 1,n , 1, 2 2 1, 1, ...( 5)
log
log
t m t m t t m t m t m t m D Eq
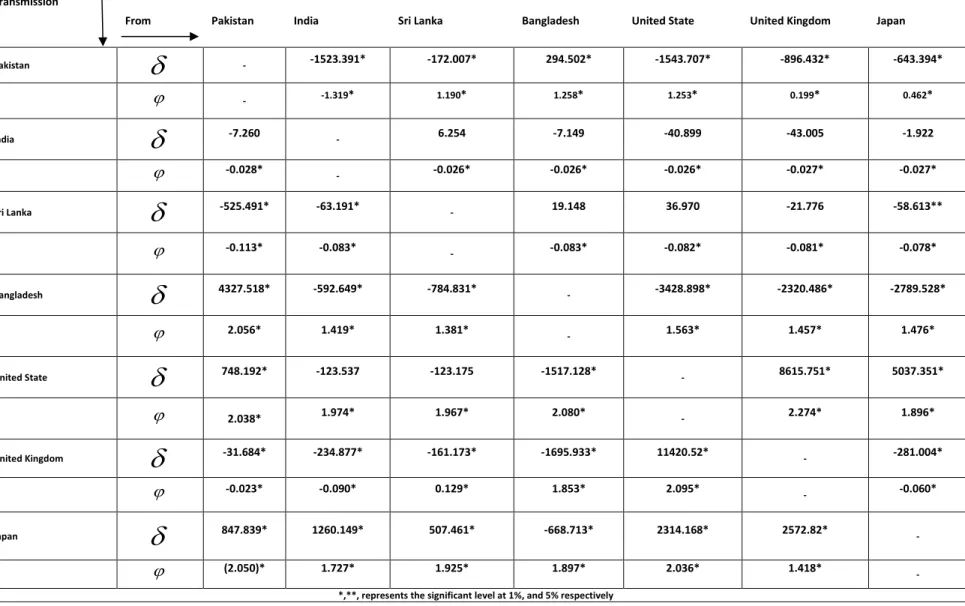
Table 5 presents the variation in volatility spillover in the presence of possible structural break, if exist, with the help of EGARCH-D (i.e., dummy coefficient in EGARCH) model presented at Eq (5).The result of the EGARCH-D model, after incorporating dummy variables, confirms the presence of bi-directional transmission of volatility across all markets. The difference among the results of both models, i.e., EGARCH and EGARCH-D model, points out structural break in the market volatility, i.e., volatility spillover from other market has consequently resulted in variation in the primary market.
Table 5 -Bi-Variate Exponential Garch Coefficient With Dummy Variable
Transmission
From Pakistan India Sri Lanka Bangladesh United State United Kingdom Japan
Pakistan
- -1523.391* -172.007* 294.502* -1543.707* -896.432* -643.394* - -1.319* 1.190* 1.258* 1.253* 0.199* 0.462* India
-7.260 - 6.254 -7.149 -40.899 -43.005 -1.922 -0.028* - -0.026* -0.026* -0.026* -0.027* -0.027* Sri Lanka
-525.491* -63.191* - 19.148 36.970 -21.776 -58.613** -0.113* -0.083* - -0.083* -0.082* -0.081* -0.078* Bangladesh
4327.518* -592.649* -784.831* - -3428.898* -2320.486* -2789.528* 2.056* 1.419* 1.381* - 1.563* 1.457* 1.476* United State
748.192* -123.537 -123.175 -1517.128* - 8615.751* 5037.351* 2.038* 1.974* 1.967* 2.080* - 2.274* 1.896* United Kingdom
-31.684* -234.877* -161.173* -1695.933* 11420.52* - -281.004* -0.023* -0.090* 0.129* 1.853* 2.095* - -0.060* Japan
847.839* 1260.149* 507.461* -668.713* 2314.168* 2572.82* - (2.050)* 1.727* 1.925* 1.897* 2.036* 1.418* -In Eq (5), the coefficient of our interest is of the dummy variable. The significance of the dummy variable in Eq (5) suggests the significant shift in volatility spillover pattern after global financial crises. The results presented in Table 5 confirm this pattern. The coefficient of the dummy variable in all estimated results is significant, thus suggesting the existence of a structural break in volatility spillover pattern. After incorporating the structural break into the EGARCH model at Eq (5), the results are drastically changed. Results suggest the existence of bi-directional spillover effect Pakistan - US and Pakistan - Sri Lankan markets. These results suggest that these markets are highly integrated with the Pakistani market and that any sort of financial shocks in these countries is transmitted into the Pakistani market and vice versa.
The results also show that the Indian market is not affected by external shocks. The estimation result of the EGARCH model suggests the absence of significant coefficients for the sampled countries with respect to the Indian market. However, the results of EGARCH-D models show that spillover coefficients of all the sampled countries with respect to the Indian market are significant. The results show that there is a bi-directional spillover effect between India – US, India – UK, and Indian – Pakistan.
On the other hand, the results of the EGARCH and EGARCH-D model with respect to Sri Lanka are quite different. The result of the EGARCH model suggests that none of the volatility spillover coefficients are significant except that of Pakistan. While the results of the EGARCH-D model suggest spillover coefficients in respect of all the countries included in the study are significant. These results show a bi-directional spillover effect between Sri Lanka and the US, Sri Lanka and UK, Sri Lanka and Pakistan and Sri Lanka, and India. In the case of Bangladesh, however, the results of both the EGARCH and EGARCH-D model are similar, indicating that the Bangladesh market is highly sensitive to external shocks. It suggests that conditions in all the countries included in the study have a significant impact on the Bangladesh market and vice versa. This also proves that Bangladesh is getting integrated with international markets.
The results with respect to the United States contradict the results of previous studies. In comparison with the earlier model, the coefficients for spillover from the US to Sri Lanka and India are insignificant according to our results. The result of the EGARCH-D model shows that there is a significant bi-directional transmission of volatility between the US and other sampled countries. The variation in the results may bedue exclusion of data for the period relating to the global financial crisis 2008. This signifies the US market is highly integrated with all the other countries included in the study.
With respect to the United Kingdom, the results of EGARCH and EGARCH-D models are also not similar. As per the results of the former model, only shocks in Sri Lanka are transmitted over to the market of the United Kingdom. While as per the results of the later model, shocks occurring in all of the countries included in the study, namely the United States, India, Pakistan, Bangladesh, Sri Lanka, and Japan, have implications on the UK’s market. Similar results are documented for Japan. The only UK and US market shocks have an impact on the Japanese market, as per the results of the EGARCH model. While as per the results of the EGARCH-D model, shocks in any of the countries included in the study are transmitted have an impact on the Japanese market.
Conclusion
This study aims to investigate volatility spillover in the presence of structural breaks in South Asian financial markets, i.e., India, Pakistan, Bangladesh, and Sri Lanka, during the 2008 global financial crisis. These selected countries represent the key economic players in the south Asian region and have relatively developed financial markets.
The methodology of this investigation consists of two steps. In the first step, volatility spillover has been examined pairwise using the whole period, i.e., from 2002 to 2016. In the next step, a dummy variable
75 representing the crisis period has been introduced, and data has been re-estimated. The detailed results are presented in Table 5 and conform to our intuitive thinking.
This study, therefore, suggests the strong evidence of volatility spillover with certain exceptions. The results also suggest the existence of a structural break in volatility patterns of all sample countries. Exceptions include India and Sri Lanka, which show the absence of spillover effect in some cases depicting the strong internal mechanism of financial markets due to domestic confidence in the financial sector, which ultimately provided a buffer from external threats. Similar results exist about Sri Lankan markets depicting possible reason for less integration with the world markets. Interestingly, evidence regarding bi-directional volatility spillover exists among the financial markets of Bangladesh, Japan, Pakistan, and the United Kingdom.
Policy Implications
The result of this study has important implications for policymakers. Better economic and financial planning depends on better forecasting models. These models, with possible scenarios amendments, provide optimal policymaker solutions. However, in the presence of structural breaks, forecasting models also need to be significantly amended. Therefore, the conclusion of a study about the existence of structural breaks suggests that policymakers need not rely on earlier tools and models for effective decision making.
The results of this study also suggest that due to significant spillover, international portfolio diversification with countries with higher spillover is not feasible and can lead to losses in capital markets.
Limitations and Future Research Directions
The results of this study indicate structural breaks in the market after the transmission of the financial crisis from outside markets. However, extent of these structural breaks could not be determined as the scope of this investigation only included determining and estimating the volatility spillover in the markets, and the model developed in the light of the said scope was able to estimate the extent of transmission of shocks among the sampled markets and lacked the ability to estimate the magnitude of structural break in the markets resulting from transmission of shocks.
The literature on the financial crisis and volatility spillover are still an open and new phenomenon for further research by other researchers. The Global Financial Crisis has warned and conveyed the cost of the financial crisis and volatility spillover to the world. There are alternative ways to extend the research. First of all, to check the volatility spillover in the money market as well as foreign exchange markets. The methodology used by including economics variables like inflation, capital inflow/outflow, and Gross Domestic Product, etc. Secondly, instead of investigating one market from one country, the volatility spillover effect can be investigated between national financial markets with various sectors like Telecom and Energy, etc.
Funding: This research received no external funding.
Conflicts of Interest: The authors declare no conflict of interest.
References
Abbas, Q., Khan, S., & Shah, S. Z. A. (2013). Volatility transmission in regional Asian stock markets. Emerging
Markets Review, 66-77.
Aggarwal, R., Inclan, C., & Leal, R. (1999). Volatility in Emerging Stock Markets. The Journal of Financial and
Quantitative Analysis, 33-55.
Arago, V., & Fernandez-Izquierdo, M. A. (2007). Influence of structural changes in transmission of information between stock markets: A European empirical study. Journal of Multinational Financial
Baur, D. (2006). Multivariate market association and its extremes. International Financial Markets, Institutions &
Money, 355-369.
Choudhry, T., & Jayasekera, R. (2014). Returns and volatility spillover in the European banking industry during global financial crisis: Flight to perceived quality or contagion? International Review of Financial
Analysis, 36-45.
Claessens, S., & Forbes, K. J. (2001). International financial contagion. Boston ; London : Kluwer Academic
Publishers, c2001.
Claeys, P., & Vasicek, B. (2014). Measuring Bilateral Spillover and Testing Contagion on Sovereign Bond Markets in Europe. Journal of Banking and Finance.
Ewing, B. T., & Malik, F. (2005). Re-examining the asymmetric predictability of conditional variances: The role of sudden changes in variance. Journal of Banking & Finance, 2655-2673.
Habiba, U. E., Peilong, S., Hamid, K., & Shahzad, F. J. G. B. R. (2019). Stock Returns and Asymmetric Volatility Spillover Dynamics Between Asian Emerging Markets. 0972150919838433.
Hamao, Y., Masulis, R. W., & Ng, V. (1990). Correlations in Price Changes and Volatility across International Stock Markets. The Review of Financial Studies, 281-307.
Hammoudeh, S., & Li, H. (2008). Sudden changes in volatility in emerging markets: The case of Gulf Arab stock markets. International Review of Financial Analysis, 47-63.
Hillebrand, E. (2005). Neglecting parameter changes in GARCH models. Journal of Econometrics, 121-138. Huang, P.-K. (2012). Volatility transmission across stock index futures when there are structural changes in
return variance Applied Financial Economics, 1603-1613.
Huo, R., & Ahmed, A. D. J. E. M. (2017). Return and volatility spillovers effects: Evaluating the impact of Shanghai-Hong Kong Stock Connect. 61, 260-272.
Hwang, J.-K., & Ogwu, A. (2016). Spillover effects of the 2008 financial crisis on NIE stock markets. Applied
Economics Letters, 1261-1264.
Jebran, K., Chen, S., Ullah, I., & Mirza, S. S. (2017). Does volatility spillover among stock markets varies from normal to turbulent periods? Evidence from emerging markets of Asia. The Journal of Finance and Data
Science, 3(1-4), 20-30.
Jebran, K., & Iqbal, A. (2016). Examining volatility spillover between Asian countries’ stock markets. China
Finance Economic Review, 4(1), 6.
Jose Luis Miralles Marcelo, J. L. M. Q. a. M. d. M. M. Q. (2008). Asymmetric variance and spillover effects Regime shifts in the Spanish stock market. International Financial Markets, Institution and Money, 1-15. Kang, S. H., Cho, H.-G., & Yoon, S.-M. (2009). Modeling sudden volatility changes: Evidence from Japanese
and Korean stock markets. Physica A: Statistical Mechanics and its Applications, 3543-3550.
Lamoureux, C. G., & Lastrapes, W. D. (1990). Persistence in variance, structural change, and the GARCH model. Journal of Business and Economic Statistics, 225-234.
Lu Sui, L. S. (2016). Spillover effects between exchange rates and stock prices: Evidence from BRICS around the recent global financial crisis. Research in International Business and Finance, 459-471. Maderitsch, R., & Jung, R. (2014). Structural Breaks in Volatility Spillovers between International Financial
Markets: Contagion or Mere Interdependence? Journal of Banking and Finance, 331-342.
Malik, F., & Hassan, S. A. (2004). Modeling volatility in sector index returns with GARCH models using an iterated algorithm. Journal of Economics and Finance, 211-225.
Mcmillan, D. G., & Wohar, M. E. (2011). Structural breaks in volatility: the case of UK sector returns. Applied
Financial Economics, 1079-1093.
Miralles Marcelo, J. L., Quiros, J. L. M., & Quiros, M. d. M. M. (2008). Asymmetric variance and spillover effects: Regime shifts in the Spanish stock market. Journal of International Financial Markets, Institutions
and Money, 1-15.
77 Moore, P. W. a. T. (2009). Sudden changes in volatility: The case of five central European stock markets.
International Financial Markets, Institutions and Money, 33-46.
Mulyadi, M. S. (2009). Volatility spillover in Indonesia, USA, and Japan Capital Market. MPRA Online at
http://mpra.ub.uni-muenchen.de/16914/.
Natarajan, V. K., Singh, A. R. R., & Priya, N. C. (2014). Examining mean-volatility spillovers across national stock markets. Journal of Economics, Finance and Administrative Science, 55-62.
Nelson, D. B. (1991). Conditional Heteroskedasticity in Asset Returns: A New Approach. Econometrica, 347-370.
Panayiotis Theodossiou, E. K., Gregory Koutrnos and Andreas Christofi. (1997). Volatility Reversion and Correlation Structure of Returns in Major International Stock Markets. The Financial Review, 205-224. Pettenuzzo, D., & Timmermann, A. (2011). Predictability of stock returns and asset allocation under
structural breaks. Journal of Econometrics, 60-78.
Saeed, S. K., Riaz, K., & Ayub, U. (2013). Financial Contagion in South Asia: An EGARCH Approach.
American Journal of Scientific Research, 105-111.
Wang, L. (2014). Who moves East Asian stock markets? The role of the 2007–2009 global financial crisis.